

Abstract
Studies have suggested that communication between taste cells shapes the gustatory signal before transmission to the brain. To further explore the possibility of intragemmal signal modulation, we adopted an optogenetic approach to stimulate sour-sensitive (Type III) taste cells using mice expressing Cre recombinase under a specific Type III cell promoter, Pkd2l1 (polycystic kidney disease-2-like 1), crossed with mice expressing Cre-dependent channelrhodopsin (ChR2). The application of blue light onto the tongue allowed for the specific stimulation of Type III cells and circumvented the nonspecific effects of chemical stimulation. To understand whether taste modality information is preprocessed in the taste bud before transmission to the sensory nerves, we recorded chorda tympani nerve activity during light and/or chemical tastant application to the tongue. To assess intragemmal modulation, we compared nerve responses to various tastants with or without concurrent light-induced activation of the Type III cells. Our results show that light significantly decreased taste responses to sweet, bitter, salty, and acidic stimuli. On the contrary, the light response was not consistently affected by sweet or bitter stimuli, suggesting that activation of Type II cells does not affect nerve responses to stimuli that activate Type III cells.
Keywords: ATP, channelrhodopsin, chorda tympani, mice, serotonin, taste buds
Introduction
Within a taste bud, taste cells not only synapse directly onto afferent nerve fibers but may also modulate the function of adjacent taste cells to modify the ultimate neural output. Taste cells are distinguished from each other based on their morphology, molecular markers, response profile to tastants, and the neurotransmitters they release (for a review, see Roper and Chaudhari 2017b). For instance, ATP and acetylcholine are released from Type II cells, which respond to bitter, sweet, or umami stimuli, while serotonin (5-HT), GABA, and noradrenaline are released from Type III cells, which respond to sour (acids) and some salts. Both ATP and 5-HT directly activate receptors on afferent nerve fibers but are also implicated in cell–cell communication within the taste bud. One hypothesis for a cell–cell communication loop is as follows (Tomchik et al. 2007; Roper and Chaudhari 2017a): ATP released from Type II taste cells (Finger et al. 2005; Huang et al. 2007; Romanov et al. 2007; Murata et al. 2010) can activate P2Y receptors on Type III cells (Kataoaka et al. 2004; Bystrova et al. 2006; Huang et al. 2009), causing synaptic release of 5-HT, which can activate afferent nerve fibers (Larson et al. 2015), as well as 5-HT1a receptors on Type II cells to inhibit the initial ATP release (Huang et al. 2005, 2009; Jaber et al. 2014). Whether the hypothesized intragemmal communication loop affects responses to taste stimuli in vivo is not known.
One problem with investigating intragemmal signaling in vivo is that some stimuli can elicit responses in multiple cell types. For instance, in mammals, sour (acid) stimulation causes intracellular acidification in all taste cells (Lyall et al. 2001, 2006; Richter et al. 2003), which may affect their function. Similarly, some bitter receptors, expressed by Type II cells, respond to acids (Oka et al. 2013). In addition, KCl stimulation, which directly activates voltage-gated Ca++ influx in Type III cells also can directly evoke ATP release from Type II cells via the voltage-dependent ATP release channel Calhm1 (Taruno et al. 2013; Romanov et al. 2018). To bypass the nonspecific activation of multiple cell types and better understand the communication between cell types, we created a mouse model expressing channelrhodopsin (ChR2) that can be activated with blue light (470 nm) in a limited and defined population of taste cells expressing polycystic kidney disease 2-like 1 (PKD2L1) (Wilson et al. 2019). PKD2L1 is only expressed in Type III taste cells that respond to sour and some salty stimuli (Huang et al. 2006; Ishimaru et al. 2006; Kataoka et al. 2008; Oka et al. 2013; Lewandowski et al. 2016). We previously showed that half of PKD2L1-expressing cells in fungiform papillae coexpress ChR2 and that activation of PKD2L1-ChR2 (Type III) cells with light elicits a strong response on the chorda tympani and glossopharyngeal nerves, similar to taste responses (Wilson et al. 2019). Here, we investigated the effect of optogenetic activation of Type III cells on responses to different taste stimuli, including those mediated by the Type II cells. We compared the nerve response to a particular tastant with the nerve response to the same tastant on top of the optogenetic activation of Type III cells. By doing so, we could assess whether intragemmal communication affects the neural output from the taste bud. We show that all taste qualities are affected by blue light activation, suggesting a modulation of the taste signal from Type III cells within the taste bud before its transmission to the brain. In contrast, when tastant was applied before light, little or no modulation of the light response was observed, suggesting that release of ATP from Type II cells does not translate into changes in nerve responses from Type III cells.
Materials and methods
Animals
Mice were housed at the University of Colorado Anschutz Medical Campus on a 12-h light–dark cycle in ventilated cages with access ad libitum to standard chow and water. All experimental procedures were approved by the Animal Care and Use Committee at the University of Colorado Medical School. PKD2L1-Cre channelrhodopsin (PKD-ChR2) mice were bred as previously described (Wilson et al. 2019). Briefly, Cre-dependent channelrhodopsin (ChR2) mice (The Jackson Laboratory, Stock # 012569) were crossed with PKD2L1-Cre mice, which feature a knock-in, IRES Cre construct directly following the pkd2l1 sequence (made in house; Ye et al. 2016). For controls, littermates lacking at least 1 allele necessary for the ChR2 expression were used. Both male and female mice were included in the cohort.
Nerve recordings
Mice were anesthetized with an intraperitoneal injection of urethane (2 mg/kg; Sigma Aldrich) and placed in a head holder. A cannula was placed in the trachea to facilitate breathing. The chorda tympani was accessed using a ventral approach and the nerve severed near the tympanic bulla. The nerve was placed on a platinum–iridium electrode connected to an acquisition system consisting of an amplifier (P511; Grass Instruments), an integrator, and a recording system (AcqKnowledge software; Biopac). A reference electrode was placed in a nearby muscle. The anterior part of the tongue containing the fungiform taste papillae was stimulated with a continuous flow of water with or without stimuli (sucrose 500 mM; quinine 10 mM; NaCl 100 mM; citric acid 10 mM; blue light). NH4Cl 100 mM was used as a reference and all taste responses were normalized to the response to NH4Cl. For light application, a light-emitting diode (LED) blue light (470 nm) delivered light pulses through a 600-nm patch cord made by the Optogenetics and Neural Engineering Core at the University of Colorado School of Medicine (ONE core), which was positioned in proximity to the tongue and turned on when needed as previously described in Wilson et al. (2019). Light pulse parameters were chosen to give the optimal light response: 5 Hz, 7 mW, 50% duty cycle. Tastants were applied for 30 s and the tongue was rinsed with water for 40 s. Nerve responses were integrated over a time constant of 0.5 s and analyzed using AcqKnowlege software (Biopac). The amplitude of each integrated response was averaged over the 30-s response. Percentage change values were calculated by subtracting the modulated response (or second response, in the case of controls) from the response to light or tastant alone (the first response, for controls), dividing this difference by the first response, and finally multiplying by −100 to denote direction of change. Responses were analyzed using a single sample t-test for each condition as compared to a percentage change of 0 (Statistica software, version 10). Significant outliers were removed from the data set based on the Grubb’s test (GraphPad). Three stimulation paradigms were employed in nerve recording experiments and are displayed in Figure 1.
Figure 1.
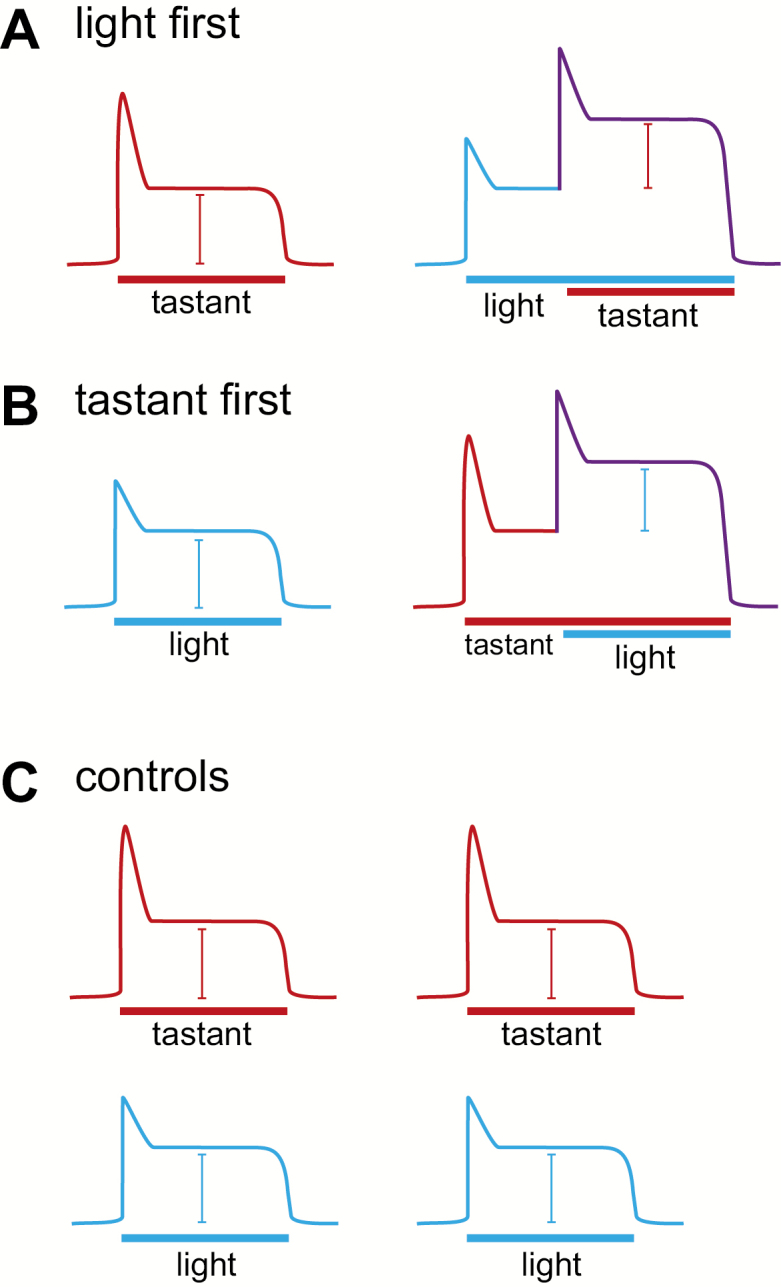
Stimulation paradigms. (A) Experiment 1: a tastant was first applied on the tongue. The same tastant was reapplied after the light was turned on for 10 s. The light was kept on while the tastant was applied. The amplitude of the tastant responses was compared in the absence or presence of light. (B) Experiment 2: the light was first applied on the tongue. The same light was reapplied after a tastant was applied on the tongue for 10 s. The amplitude of the light responses was compared in the absence or presence of a tastant. (C) Control experiment: the same tastant or light were applied repeatedly on the tongue. Response amplitudes were compared.
Experiment 1: light before tastant
To assess the possibility that optogenetically activated Type III cells might modulate nerve responses to chemical stimuli, we compared the nerve response to chemical stimulus application to the nerve response to the same chemical stimulus following a 10-s period of light application (Figure 1A). Amplitudes of the chemical stimulus responses alone were calculated by subtracting the mean amplitude of 5 s of baseline activity from the mean amplitude of 30 s of stimulus response. For chemical stimulus on top of light application, the mean amplitude of 5 s of the light response directly before the addition of the chemical stimulus was subtracted from the mean amplitude of the 30 s response to both light and chemical stimulus.
Experiment 2: tastant before light
To assess whether chemical stimuli might modulate the nerve response to optogenetic activation of Type III cells, the first experiment was performed in reverse. Nerve responses to light alone were compared to responses to light on top of the response to a chemical stimulus (Figure 1B). Mean amplitudes were calculated in the same manner as in Experiment 1.
Control experiments
To control for response variability over the course of both experiments, the mean amplitudes of both chemical and light stimuli alone were compared to later presentations of the same stimuli (Figure 1C). Mean amplitudes were calculated as in Experiments 1 and 2.
Results
Nerve recordings
Experiments were designed to clarify the effect of specific Type III cell stimulation on taste responses. Type III cells were activated by optogenetic stimulation with a blue light applied to the anterior part of the tongue, while tastants dissolved in water were applied with a continuous flow on the same tongue region.
Experiment 1: light before tastant
The average responses of the tastant alone were compared to the same tastant when preceded by 10 s of light stimulation. When light preceded the tastant, taste responses were reduced compared to the control taste responses without light (Figure 2A). Averaged percentage decrease for each stimulus in the presence of light are listed in Table 1. These data were evaluated using a single-sample t-test; when the percentage change values for each tastant were compared to a value of 0, each tastant was significantly decreased when light was present (Table 1). The data in this and all following experiments are also represented as relative chorda tympani response values in supplemental material (Supplemental Figure S1). These results suggest that the activation of Type III cells with blue light decreases taste responses, though the mechanism for decreases in sweet and bitter stimuli, mediated by Type II cells, is possibly different from that of salty and sour stimuli, mediated by Type III cells (see Discussion).
Figure 2.

Effect of light on taste responses. (A) Representative integrated chorda tympani response to sucrose 500 mM in the absence or presence of light in the same animal. Bars for sucrose application represent 30 s. Bar for light application represents 40 s. Graph displays the percentage change between taste responses with or without light for sucrose 500 mM, quinine 10 mM, NaCl 100 mM, and citric acid 10 mM (right). (B) Representative integrated chorda tympani response to sucrose 500 mM repeated on the same animal. Bars for sucrose application represent 30 s. Graph shows percentage change between taste responses repeated during the experiment (right). For both (A) and (B) graphs, each dot represents a different animal for each tastant. Bars represent averaged response ± standard error of the mean. All responses were normalized to responses to NH4Cl 100 mM. Asterisks represent statistical significance levels based on a one-sample t-tests: *P < 0.05; **P < 0.01; ***P < 0.001.
Table 1.
Percentage change and statistics for Experiment 1
| Experiment 1 | ||||||
|---|---|---|---|---|---|---|
| Chemical stimulus | Light before tastant | Control | ||||
| Percentage change ± SEM | t value | P value | Percentage change ± SEM | t value | P value | |
| Sucrose 500 mM | −26.8% ± 4.5 | 5.9816 | <0.0001 | 4.4% ± 3.7 | 1.1782 | 0.2660 |
| Quinine 10 mM | −51.8% ± 13.8 | 3.7442 | 0.0038 | 12.4% ± 9.3 | 1.3390 | 0.2134 |
| NaCl 100 mM | −21.8% ± 6.5 | 3.3642 | 0.0072 | 15.2% ± 6.7 | 2.2597 | 0.0451 |
| Citric acid 10 mM | −30.2% ± 12.9 | 2.3397 | 0.0474 | −1.2% ± 4.2 | 0.2885 | 0.7795 |
SEM, standard error of the mean.
By comparison, in a control experiment where the same stimulus was successively applied twice, all taste responses were not significantly decreased between repeated stimulations (Figure 2B). Hence, run-down of response is not a factor. According to 1-sample t-tests, none of the tastants showed a significant change in response amplitude, except for responses to NaCl, which were slightly increased in secondary applications (Table 1). Since secondary NaCl responses tended to be increased rather than decreased, these data do not account for the decrease seen with light modulation in Figure 2A.
Experiment 2: tastant before light
Tastants were applied for 10 s before blue light illumination of the tongue. This experiment was conducted to assess whether the tastant stimulation reduces the activation of the Type III cells. Results are shown in Figure 3. Light responses were highly reproducible with an averaged percentage of change in the response amplitude of −3.1% ± 4.9. In 1-sample t-tests, neither sucrose nor quinine caused significant changes in response amplitude to light. These data suggest that Type III cell output to the nerve is not modulated by Type II cell activation by bitter or sweet taste stimuli. While sucrose and quinine did not affect the light response, NaCl and citric acid showed more variability. By 1-sample t-tests, only the change in light responses in the presence of citric acid was statistically significant (Table 2). These data are likely to result from dual activation of the same population of cells. Whether the light or the citric acid (and, to an extent, NaCl) is presented first, both recruit the activity of Type III cells. With the added application of another Type III cell stimulant, the resulting response likely appears decreased because a portion of activated cells was already activated by the initial stimulus.
Figure 3.

Effect of tastants on light responses. (A) Representative integrated chorda tympani response to light in the absence or presence of sucrose 500 mM in the same animal (above), and chorda tympani responses to light repeated on the same animal (below). Bars for light application represent 30 s, bar for sucrose application represents 40 s. (B) Percentage change between light responses preceded by sucrose 500 mM, quinine 10 mM, NaCl 100 mM, citric acid 10 mM, and no tastant. Each dot represents a different animal for each tastant. Bars represent averaged percentage change ± standard error of the mean. Responses were normalized to NH4Cl 100 mM. Asterisks represent statistical significance levels based on a one-sample t-tests: **P < 0.01.
Table 2.
Percentage change and statistics for Experiment 2
| Experiment 2: tastant before light | |||
|---|---|---|---|
| Chemical stimulus | Percentage change ± SEM | t value | P value |
| Sucrose 500 mM | 1.7% ± 5.7 | 0.2901 | 0.7771 |
| Quinine 10 mM | 2.0% ± 10.3 | 0.1958 | 0.8496 |
| NaCl 100 mM | −12.1% ± 9.5 | 1.2700 | 0.2303 |
| Citric acid 10 mM | −22.5% ± 6.1 | 3.6675 | 0.0037 |
SEM, standard error of the mean.
Discussion
The main goal of the present study was to test whether optogenetic stimulation of Type III taste cells modulates Type II cell-mediated taste output to the central nervous system or vice versa. Previous studies examined this question using acid as a Type III cell stimulus (Huang et al. 2008, 2011; Formaker et al. 2009). When mixing sucrose and acid, sucrose responses were decreased compared to control (Formaker et al. 2009). However, examining possible interactions between taste cells is complicated in particular by the various cellular effects of acid application. Acids stimulate the OTOP1 proton channel at the apical region of Type III cells (Tu et al. 2018; Teng et al. 2019; Zhang et al. 2019), whereas intracellular acidification causes further depolarization by inhibiting the KIR2.1 potassium channels (Ye et al. 2016). However, intracellular acidification causes nonspecific effects in other lingual cell types (Lyall et al. 2001; Richter et al. 2003). The acidification can reduce cyclic adenosine 3′,5′-monophosphate (cAMP) levels (Liu et al. 1999), which could decrease responses to tastants using cAMP in their transduction pathways, such as cells responding to sweet and bitter stimuli (Type II cells; Striem et al. 1989; Naim et al. 1991). Using chemical stimuli, it is difficult to separate potential cell–cell communication from nonspecific effects on epithelial cells in general. On the contrary, our optogenetic approach allowed for the specific activation of Type III cells, since channelrhodopsin is exclusively present in PKD2L1-expressing cells.
Our finding that optogenetic stimulation of Type III taste cells modulates chorda tympani nerve responses to bitter and sweet stimuli is consistent with the existence of modulatory communication from Type III to Type II cells. Several studies demonstrate the possibility of such a signaling event. In response to relevant stimuli, Type III cells release 5-HT and GABA (Tomchik et al. 2007; Huang et al. 2008; Huang et al. 2011), both of which may signal to Type II cells, as well as afferent nerve fibers. Type II cells express 5-HT1a, GABAA, and GABAB receptors, and bath-applied 5-HT and GABA both cause a reduction in Type II cell ATP release, which is necessary to evoke neural activity (Huang et al. 2009; Dvoryanchikov et al. 2011). In our experiments, chorda tympani responses to quinine and sucrose were consistently dampened by optogenetic stimulation of Type III cells. Thus, our present findings are consistent with the hypothesis that Type III cells signal to Type II cells, thus reducing taste bud transmission to afferent nerves for Type II cell-mediated stimuli.
We hypothesize that the observed reduction in bitter and sweet stimuli with light application is the result of 5-HT or GABA release from Type III cells acting on their cognate receptors on Type II cells. Whether the decrease in ATP release results from serotonergic or GABAergic mechanisms, or both, cannot be ascertained from in vivo experiments due to previous studies showing that both 5-HT (Watts et al. 2012; Magnusson and Cummings 2018) and GABA (Shimada et al. 2009; Ma et al. 2015) affect blood pressure in animals, which affects chorda tympani responses (Hellekant 1971a, 1971b). Thus, any effect observed with drug agonists and antagonists would not necessarily be related to taste as much as changes in blood flow. Interestingly, we only observed nerve signal modulation when light application preceded bitter or sweet stimuli. The timing of these stimulation events thus seems to be an important aspect of Type II cell modulation. In rats, GABA application causes taste cell hyperpolarization via increased chloride currents (Cao et al. 2009). Perhaps GABA and/or 5-HT signaling to Type II cells modulates the membrane potential and thus the excitability of Type II cells but has little influence once the Type II cell stimulation has already generated action potentials and ATP release. Alternate experimental methods will be needed to further assess the molecular and temporal nature of Type III to Type II cell–cell communication.
Chorda tympani responses to sour and salty stimuli were also decreased during optogenetic stimulation of the tongue, but this is likely the result of overlapping activation of Type III cells rather than Type III modulation of separate taste cells. Sour stimuli, while causing intracellular acidification of all lingual epithelial cells (Lyall et al. 2001; Richter et al. 2003), are transduced by PKD2L1-expressing Type III cells (Huang et al. 2006). Salty stimuli are more complex; they can activate Type II cells (Oka et al. 2013; Roebber et al. 2019) and Type III cells (Yoshida et al. 2009; Lewandowski et al. 2016), as well as another group of cells without voltage-gated current, which may be Type I cells (Vandenbeuch et al. 2008). Regardless, both sour and salty stimuli recruit the activity of Type III taste cells. In our experimental paradigm, optogenetic stimulation of the tongue preceded liquid tastant application. Thus, optogenetic stimulation recruited a portion of Type III cells before either citric acid or NaCl were applied. Responses for both tastants may have been seemingly reduced because a portion of the Type III cells they stimulate were already activated by the blue light. Since salty stimuli can also activate some Type II cells, the reduction in responses to NaCl may be a result of both modulation of Type II cells, as well as overlapping populations of activated Type III cells.
Interestingly, activation of Type II taste cells with sucrose or quinine did not change the light-activated chorda tympani response. We initially hypothesized that, if Type II cells were activated, then the released ATP should activate the P2Y receptors on Type III cells, causing an influx of calcium, resulting in a release of serotonin. This serotonin would then activate neural 5-HT3 receptors, thereby enhancing the chorda tympani response to subsequently applied light. Our results in Figure 3 demonstrate instead that, when sucrose or quinine precedes optogenetic Type III cell stimulation, the nerve responses to blue light are unchanged. By contrast, responses to blue light were diminished when preceded by citric acid application. As in Experiment 1, this reduction in response is likely the result of overlapping populations of activated cells rather than an indication of modulation. While not statistically significant, chorda tympani responses to optogenetic Type III cell stimulation also tended to be diminished when preceded by NaCl application to the tongue. This may again reflect the complex transduction of salty stimuli. Part of the nerve response is due to Type III cell activation, which overlaps with the population of cells recruited by blue light stimulation and appears in our experiment as a slight reduction in response. A limitation of our study is that channelrhodopsin is expressed in only half of PKD2L1-expressing cells in our mouse model (Ye et al. 2016; Wilson et al. 2019). Perhaps, the cells targeted in this study are not the same Type III cell population that expresses P2Y receptors, which are requisite for the proposed signaling circuit from Type II cells. Type III cells have recently been shown to be more diverse in their molecular markers than previously thought (Lossow et al. 2017; Wilson et al. 2017), and a previous study suggested that the acid-responsive taste cells were not the same population that responded to ATP (Shimizu et al. 2014 ). Regardless, the present data are consistent with the concept that, while Type III cell activation can modulate the overall taste bud output in response to sweet and bitter stimuli, Type II cell activation does not necessarily reciprocally modulate sour signaling.
The use of whole-nerve rather than single-fiber recordings remains a caveat of the present study; however, our data corroborate previous single-fiber evidence in the field, ultimately supporting a model of cell–cell communication. Our interpretation of the presented data assumes that, without cell–cell signal modulation, chorda tympani responses to multiple taste stimuli would be additive. For example, a response to concurrent sucrose and light would be equal to the sum of the responses to sucrose and light presented alone. Single-fiber nerve recordings would provide clarification on this point and would reveal the effect of our hypothesized cell–cell interaction on individual nerve fiber responses. In hamsters, the combined application of sucrose and hydrochloric acid suppresses the response in singly recorded sweet-best fibers. Acid-best fibers in the same animals did not, however, show significant changes in response patterns to the same mixture (Hyman and Frank 1980). Reduction in the activity of sweet-best fibers by way of taste mixtures suggests modulation of either taste cells or individual taste fibers at the periphery. That acid-best fibers did not show the same modulation suggests that the modulatory effects may be unidirectional. Our data corroborates this result and further identifies sour-responsive taste cell activity as sufficient to cause peripheral modulation of the nerve signal rather than any effect of acid application on the sucrose-responsive taste cells themselves.
Recent anatomical data show that, in mouse taste buds, most Type II and Type III cells do not contact each other directly but are separated by Type I cells (Yang et al. 2020). Thus, the neurotransmitter(s) released by Type III cells following blue light activation may not directly activate Type II cells but may elicit effects indirectly through Type I cells. Type I cells express P2Y receptors and release GABA (Huang and Wu 2018), so it is possible that at least some of the modulation is caused by Type I cells responding to transmitters released by Type II and/or Type III cells. Further experiments will be required to address this possibility.
Supplementary material
Supplementary material can be found at Chemical Senses online.
Supplemental Figure 1. Chorda tympani responses relative to NH4Cl for all experiments (A) Effect of light on taste responses. Chorda tympani responses to tastant application alone and tastant application on top of light stimulation for sucrose 500mM, quinine 10mM, NaCl 100mM, and citric acid 10mM. (B) Tastant controls. Control chorda tympani responses to successive applications of sucrose, quinine, NaCl, and citric acid. (C) Effect of tastants on light responses. Chorda tympani responses to light alone and light preceded by the application of sucrose, quinine, NaCl, and citric acid. As a control, light responses were repeated successively (right). For all graphs, each pair of points represents a single animal.
Acknowledgments
We thank Dr. Eric Larson for statistical analysis of the data and Dr. Thomas Finger for helpful comments on the manuscript. Engineering support was provided by the Optogenetics and Neural Engineering Core at the University of Colorado Anschutz Medical Campus, funded in part by the National Institute of Neurological Disorders and Stroke of the NIH under award number P30NS048154.
Funding
This study was supported by National Institute on Deafness and Other Communication Disorders National Institutes of Health grant (R01 DC012555) to S.C.K. Engineering support was provided by the Optogenetics and Neural Engineering Core at the University of Colorado Anschutz Medical Campus, funded in part by the National Institute of Neurological Disorders and Stroke of the National Institutes of Health under award number P30NS048154.
Conflict of interest
The authors declare no conflict of interest.
References
- Bystrova MF, Yatzenko YE, Fedorov IV, Rogachevskaja OA, Kolesnikov SS. 2006. P2Y isoforms operative in mouse taste cells. Cell Tissue Res. 323(3):377–382. [DOI] [PubMed] [Google Scholar]
- Cao Y, Zhao FL, Kolli T, Hivley R, Herness S. 2009. GABA expression in the mammalian taste bud functions as a route of inhibitory cell-to-cell communication. Proc Natl Acad Sci USA. 106(10):4006–4011. [DOI] [PMC free article] [PubMed] [Google Scholar]
- Dvoryanchikov G, Huang YA, Barro-Soria R, Chaudhari N, Roper SD. 2011. GABA, its receptors, and GABAergic inhibition in mouse taste buds. J Neurosci. 31(15):5782–5791. [DOI] [PMC free article] [PubMed] [Google Scholar]
- Finger TE, Danilova V, Barrows J, Bartel DL, Vigers AJ, Stone L, Hellekant G, Kinnamon SC. 2005. ATP signaling is crucial for communication from taste buds to gustatory nerves. Science. 310(5753):1495–1499. [DOI] [PubMed] [Google Scholar]
- Formaker BK, Lin H, Hettinger TP, Frank ME. 2009. Responses of the hamster chorda tympani nerve to sucrose+acid and sucrose+citrate taste mixtures. Chem Senses. 34(7):607–616. [DOI] [PMC free article] [PubMed] [Google Scholar]
- Hellekant G. 1971a. On the relation between the chorda tympani nerve response, arterial oxygen tension and blood flow in the tongue of the rat. Acta Physiol Scand. 82(4):453–459. [DOI] [PubMed] [Google Scholar]
- Hellekant G. 1971b. The effect of changes in the blood flow to the tongue on the chorda tympani response in rat. Acta Physiol Scand. 82(2):145–153. [DOI] [PubMed] [Google Scholar]
- Huang AL, Chen X, Hoon MA, Chandrashekar J, Guo W, Tränkner D, Ryba NJ, Zuker CS. 2006. The cells and logic for mammalian sour taste detection. Nature. 442(7105):934–938. [DOI] [PMC free article] [PubMed] [Google Scholar]
- Huang YA, Dando R, Roper SD. 2009. Autocrine and paracrine roles for ATP and serotonin in mouse taste buds. J Neurosci. 29(44):13909–13918. [DOI] [PMC free article] [PubMed] [Google Scholar]
- Huang YJ, Maruyama Y, Dvoryanchikov G, Pereira E, Chaudhari N, Roper SD. 2007. The role of pannexin 1 hemichannels in ATP release and cell-cell communication in mouse taste buds. Proc Natl Acad Sci USA. 104(15):6436–6441. [DOI] [PMC free article] [PubMed] [Google Scholar]
- Huang YJ, Maruyama Y, Lu KS, Pereira E, Plonsky I, Baur JE, Wu D, Roper SD. 2005. Using biosensors to detect the release of serotonin from taste buds during taste stimulation. Arch Ital Biol. 143(2):87–96. [PMC free article] [PubMed] [Google Scholar]
- Huang YA, Maruyama Y, Stimac R, Roper SD. 2008. Presynaptic (Type III) cells in mouse taste buds sense sour (acid) taste. J Physiol. 586(12):2903–2912. [DOI] [PMC free article] [PubMed] [Google Scholar]
- Huang YA, Pereira E, Roper SD. 2011. Acid stimulation (sour taste) elicits GABA and serotonin release from mouse taste cells. PLoS One. 6(10):e25471. [DOI] [PMC free article] [PubMed] [Google Scholar]
- Huang AY, Wu SY. 2018. Substance P as a putative efferent transmitter mediates GABAergic inhibition in mouse taste buds. Br J Pharmacol. 175(7):1039–1053. [DOI] [PMC free article] [PubMed] [Google Scholar]
- Hyman AM, Frank ME. 1980. Sensitivities of single nerve fibers in the hamster chorda tympani to mixtures of taste stimuli. J Gen Physiol. 76(2):143–173. [DOI] [PMC free article] [PubMed] [Google Scholar]
- Ishimaru Y, Inada H, Kubota M, Zhuang H, Tominaga M, Matsunami H. 2006. Transient receptor potential family members PKD1L3 and PKD2L1 form a candidate sour taste receptor. Proc Natl Acad Sci USA. 103(33):12569–12574. [DOI] [PMC free article] [PubMed] [Google Scholar]
- Jaber L, Zhao FL, Kolli T, Herness S. 2014. A physiologic role for serotonergic transmission in adult rat taste buds. PLoS One. 9(11):e112152. [DOI] [PMC free article] [PubMed] [Google Scholar]
- Kataoka S, Toyono T, Seta Y, Ogura T, Toyoshima K. 2004. Expression of P2Y1 receptors in rat taste buds. Histochem Cell Biol. 121(5):419–426. [DOI] [PubMed] [Google Scholar]
- Kataoka S, Yang R, Ishimaru Y, Matsunami H, Sévigny J, Kinnamon JC, Finger TE. 2008. The candidate sour taste receptor, PKD2L1, is expressed by type III taste cells in the mouse. Chem Senses. 33(3):243–254. [DOI] [PMC free article] [PubMed] [Google Scholar]
- Larson ED, Vandenbeuch A, Voigt A, Meyerhof W, Kinnamon SC, Finger TE. 2015. The role of 5-HT3 receptors in signaling from taste buds to nerves. J Neurosci. 35(48):15984–15995. [DOI] [PMC free article] [PubMed] [Google Scholar]
- Lewandowski BC, Sukumaran SK, Margolskee RF, Bachmanov AA. 2016. Amiloride-insensitive salt taste is mediated by two populations of type III taste cells with distinct transduction mechanisms. J Neurosci. 36(6):1942–1953. [DOI] [PMC free article] [PubMed] [Google Scholar]
- Liu JG, Gong ZH, Qin BY. 1999. Effects of low-pH treatment on cAMP second messenger system regulated by different opioid agonists. Zhongguo Yao Li Xue Bao. 20(6):500–504. [PubMed] [Google Scholar]
- Lossow K, Hermans-Borgmeyer I, Behrens M, Meyerhof W. 2017. Genetic labeling of Car4-expressing cells reveals subpopulations of type III taste cells. Chem Senses. 42(9):747–758. [DOI] [PubMed] [Google Scholar]
- Lyall V, Alam RI, Phan DQ, Ereso GL, Phan TH, Malik SA, Montrose MH, Chu S, Heck GL, Feldman GM, et al. 2001. Decrease in rat taste receptor cell intracellular pH is the proximate stimulus in sour taste transduction. Am J Physiol Cell Physiol. 281(3):C1005–C1013. [DOI] [PubMed] [Google Scholar]
- Lyall V, Pasley H, Phan TH, Mummalaneni S, Heck GL, Vinnikova AK, DeSimone JA. 2006. Intracellular pH modulates taste receptor cell volume and the phasic part of the chorda tympani response to acids. J Gen Physiol. 127(1):15–34. [DOI] [PMC free article] [PubMed] [Google Scholar]
- Ma P, Li T, Ji F, Wang H, Pang J. 2015. Effect of GABA on blood pressure and blood dynamics of anesthetic rats. Int J Clin Exp Med. 8(8):14296–14302. [PMC free article] [PubMed] [Google Scholar]
- Magnusson JL, Cummings KJ. 2018. Central serotonin and the control of arterial blood pressure and heart rate in infant rats: influence of sleep state and sex. Am J Physiol Regul Integr Comp Physiol. 314(2):R313–R321. [DOI] [PMC free article] [PubMed] [Google Scholar]
- Murata Y, Yasuo T, Yoshida R, Obata K, Yanagawa Y, Margolskee RF, Ninomiya Y. 2010. Action potential-enhanced ATP release from taste cells through hemichannels. J Neurophysiol. 104(2):896–901. [DOI] [PMC free article] [PubMed] [Google Scholar]
- Naim M, Ronen T, Striem BJ, Levinson M, Zehavi U. 1991. Adenylate cyclase responses to sucrose stimulation in membranes of pig circumvallate taste papillae. Comp Biochem Physiol B. 100(3):455–458. [DOI] [PubMed] [Google Scholar]
- Oka Y, Butnaru M, von Buchholtz L, Ryba NJ, Zuker CS. 2013. High salt recruits aversive taste pathways. Nature. 494(7438):472–475. [DOI] [PMC free article] [PubMed] [Google Scholar]
- Richter TA, Caicedo A, Roper SD. 2003. Sour taste stimuli evoke Ca2+ and pH responses in mouse taste cells. J Physiol. 547(Pt 2):475–483. [DOI] [PMC free article] [PubMed] [Google Scholar]
- Roebber JK, Roper SD, Chaudhari N. 2019. The role of the anion in salt (NaCl) detection by mouse taste buds. J Neurosci. 39(32):6224–6232. [DOI] [PMC free article] [PubMed] [Google Scholar]
- Romanov RA, Lasher RS, High B, Savidge LE, Lawson A, Rogachevskaja OA, Zhao H, Rogachevsky VV, Bystrova MF, Churbanov GD, et al. 2018. Chemical synapses without synaptic vesicles: purinergic neurotransmission through a CALHM1 channel-mitochondrial signaling complex. Sci Signal. 11(529): eaao1815. [DOI] [PMC free article] [PubMed] [Google Scholar]
- Romanov RA, Rogachevskaja OA, Bystrova MF, Jiang P, Margolskee RF, Kolesnikov SS. 2007. Afferent neurotransmission mediated by hemichannels in mammalian taste cells. EMBO J. 26(3):657–667. [DOI] [PMC free article] [PubMed] [Google Scholar]
- Roper SD, Chaudhari N. 2017a. Taste coding and feedforward/feedback signaling in taste buds. In: Shepherd GM, Grillner S, editors. Handbook of brain microcircuits. 2nd ed. New York (NY): Oxford University Press; p. 379–388. [Google Scholar]
- Roper SD, Chaudhari N. 2017b. Taste buds: cells, signals and synapses. Nat Rev Neurosci. 18(8):485–497. [DOI] [PMC free article] [PubMed] [Google Scholar]
- Shimada M, Hasegawa T, Nishimura C, Kan H, Kanno T, Nakamura T, Matsubayashi T. 2009. Anti-hypertensive effect of gamma-aminobutyric acid (GABA)-rich Chlorella on high-normal blood pressure and borderline hypertension in placebo-controlled double blind study. Clin Exp Hypertens. 31(4):342–354. [DOI] [PubMed] [Google Scholar]
- Shimizu H, Kitada R, Matsumura S, Hayashi Y. 2014. #19 Functional differentiation of presynaptic cells and ATP receptor distributions in taste buds. Abstracts from 47th meeting of Japanese Association for the Study of Taste and Smell. Chem Senses. 39(7):641–652. [Google Scholar]
- Striem BJ, Pace U, Zehavi U, Naim M, Lancet D. 1989. Sweet tastants stimulate adenylate cyclase coupled to GTP-binding protein in rat tongue membranes. Biochem J. 260(1):121–126. [DOI] [PMC free article] [PubMed] [Google Scholar]
- Taruno A, Vingtdeux V, Ohmoto M, Ma Z, Dvoryanchikov G, Li A, Adrien L, Zhao H, Leung S, Abernethy M, et al. 2013. CALHM1 ion channel mediates purinergic neurotransmission of sweet, bitter and umami tastes. Nature. 495(7440):223–226. [DOI] [PMC free article] [PubMed] [Google Scholar]
- Teng B, Wilson CE, Tu YH, Joshi NR, Kinnamon SC, Liman ER. 2019. Cellular and neural responses to sour stimuli require the proton channel Otop1. Curr Biol. 29(21):3647–3656.e5. [DOI] [PMC free article] [PubMed] [Google Scholar]
- Tomchik SM, Berg S, Kim JW, Chaudhari N, Roper SD. 2007. Breadth of tuning and taste coding in mammalian taste buds. J Neurosci. 27(40):10840–10848. [DOI] [PMC free article] [PubMed] [Google Scholar]
- Tu YH, Cooper AJ, Teng B, Chang RB, Artiga DJ, Turner HN, Muhall EM, Ye W, Smith D, Liman ER,. 2018. An evolutionarily conserved gene family encodes proton-selective ion channels. Science. 359(6379):1047–1050. [DOI] [PMC free article] [PubMed] [Google Scholar]
- Vandenbeuch A, Clapp TR, Kinnamon SC. 2008. Amiloride-sensitive channels in type I fungiform taste cells in mouse. BMC Neurosci. 9:1. [DOI] [PMC free article] [PubMed] [Google Scholar]
- Watts SW, Morrison SF, Davis RP, Barman SM. 2012. Serotonin and blood pressure regulation. Pharmacol Rev. 64(2):359–388. [DOI] [PMC free article] [PubMed] [Google Scholar]
- Wilson CE, Finger TE, Kinnamon SC. 2017. Type III cells in anterior taste fields are more immunohistochemically diverse than those of posterior taste fields in mice. Chem Senses. 42(9):759–767. [DOI] [PMC free article] [PubMed] [Google Scholar]
- Wilson CE, Vandenbeuch A, Kinnamon SC. 2019. Physiological and behavioral responses to optogenetic stimulation of PKD2L1+ type III taste cells. eNeuro. 6(2):e0107-19.2019. [DOI] [PMC free article] [PubMed] [Google Scholar]
- Yang R, Dzowo YK, Wilson CE, Russell RL, Kidd GJ, Salcedo E, Lasher RS, Kinnamon JC, Finger TE. 2020. Three-dimensional reconstructions of mouse circumvallate taste buds using serial blockface scanning electron microscopy: I. Cell types and the apical region of the taste bud. J Comp Neurol. 528(5):756–771. [DOI] [PMC free article] [PubMed] [Google Scholar]
- Ye W, Chang RB, Bushman JD, Tu YH, Mulhall EM, Wilson CE, Cooper AJ, Chick WS, Hill-Eubanks DC, Nelson MT, et al. 2016. The K+ channel KIR2.1 functions in tandem with proton influx to mediate sour taste transduction. Proc Natl Acad Sci USA. 113(2):E229–E238. [DOI] [PMC free article] [PubMed] [Google Scholar]
- Yoshida R, Horio N, Murata Y, Yasumatsu K, Shigemura N, Ninomiya Y. 2009. NaCl responsive taste cells in the mouse fungiform taste buds. Neuroscience. 159(2):795–803. [DOI] [PubMed] [Google Scholar]
- Zhang J, Jin H, Zhang W, Ding C, O’Keeffe S, Ye M, Zuker CS. 2019. Sour sensing from the tongue to the brain. Cell. 179(2):392–402.e15. [DOI] [PubMed] [Google Scholar]
Associated Data
This section collects any data citations, data availability statements, or supplementary materials included in this article.