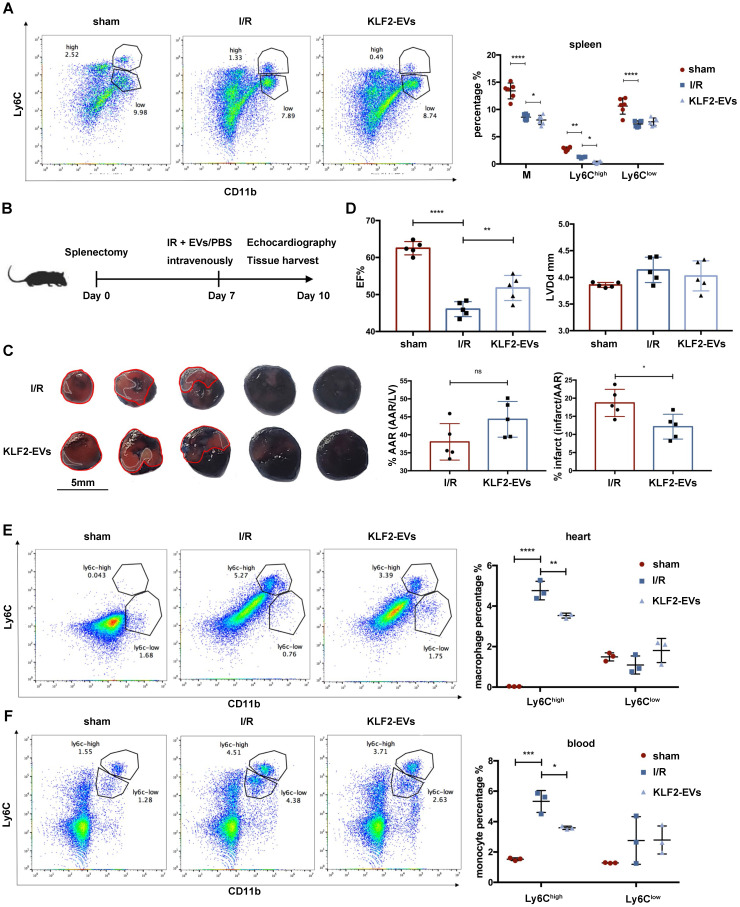
Figure 4.
KLF2-EVs did not inhibited Ly6Chigh monocytes recruitment from spleen. (A) Representative flow cytometry plots showing total monocytes, Ly6Chigh monocytes (CD11b+Ly6Chigh) and Ly6Clow monocytes (CD11b+Ly6Clow), and quantification of cells in spleen 3 days following treatment (n=6). (B) Schematic of splenectomy protocol followed by myocardial ischemia/reperfusion (I/R) injury. (C) Representative images of hearts with Evans blue/TTC staining from mice 3 days following treatment with PBS or KLF2-EVs. Area-at-risk (AAR): red line; infarct size (IS): white dotted line. Scale bar=5 mm. Quantitative analysis of the percentage AAR and percentage infarct of hearts (n=5). (D) Ejection fraction (EF) and left ventricular end-diastolic diameter (LVDd) of sham-operated, PBS or KLF2-EVs treated mice measured by echocardiography 3 days following myocardial I/R injury combined with splenectomy (n=5). Representative flow cytometry plots showing Ly6Chigh Mo/Mø (CD11b+Ly6Chigh) and Ly6Clow Mo/Mø (CD11b+Ly6Clow) and quantification of cells within heart tissues (E) or peripheral blood (F) 3 days following treatment (n=3). Graphs depict mean ± SD. Statistical significance was measured via Student's t-test for two groups' comparison, one-way ANOVA followed by Tukey's multiple comparisons test for multiple groups' comparison and two-way ANOVA followed by Bonferroni's multiple comparisons test for comparison between different groups in different cell subtypes. *P < 0.05, **P < 0.01, ***P < 0.001, ****P < 0.0001, ns = not significant.

