Abstract
It is well known that atmospheric contamination, especially the particulate matter (PM), causes severe human diseases. Yet, presently air pollution levels have dropped primarily attributable across the nation lockdown forced in the wake of the novel Coronavirus outbreak. In this study, we have attempted to establish a conceivable relationship between Covid 19 and PM10–2.5, obtained from eleven airquality monitoring stations in Chennai city, India for both Pre and during Covid situations and its influence over Covid positive cases. The observations of the materials (+ve cases, PM 10, PM 2.5) collected proved that during precovid regime less polluted areas are indicated with less than 5 infection cases reflecting the healthy people and they are less vulnerable to covid except the few occurrence of foreign source indicating no community spread whereus most polluted spots of precovid regimes are indicated with more than 90% cases and indicated that people in pollution zones are succumbed to get infected quickly. However, during Covid the lockdown has considerably reduced the particulate suspension and the results revealed that the +ve cases are of the nature of community spreading through primary and secondary contacts as reported from the media. If Covid is a visible, brutally virulent, incredibly contagious pandemic that kills rapidly and mercilessly, air pollution is its unseen evil twin. Under the radar, but even ruthlessly, if Covid and PM paired together lead to murder without delay. This is a non-communicable disease (NCD) slow-motion pandemic, equivalent-if not exceeding-the catastrophic wrath of SARS-CoV-2.
Keywords: Covid 19, PM 2.5, PM 10, Spatial distribution, Pollution, Mapping
1. Introduction
Air pollution has emerged as an increasing cause of concern worldwide, especially in developing nations such as India [1]. India saw financial development, a quick extension of urban areas, industrialization, and quick-paced improvement of the foundation since progression during the 1990s. At the same time, the degree of air pollution in India has expanded to a significant wellbeing danger and reason for massive untimely mortality [2]. Around one million individuals kicked the bucket in 2015 because of the encompassing particulate issue (PM) contamination alone in India [3]. Indian urban communities have been continually making into the best 20 most contaminated urban areas of the world for as far back as hardly any years and surpassing the surrounding air quality gauges suggested by the World Health Organization and Central Pollution Control Board (CPCB). Air pollution can exacerbate a broad scope of respiratory ailments, and Coronavirus seems, by all accounts, to be no particular case. In the first four months, the outbreak of Coronavirus disease 2019 (COVID 19), initially identified in China's Wuhan, has resulted in more than one million cases worldwide. The pandemic situation has brought about lockdown in numerous countries around the world. Though India's first confirmed case was on January 30th 2020, the cases were multipled to 10,12,442 as on today (18th July 2020). From March 16th, the country was cut off from all places of mass gatherings such as schools, shopping malls, and theatres through the lockdown. Further, the lockdown imposes limitations and measures of self-isolation which diminish emanations from transport and businesses.
2. Impact of particulate matters on COVID-19
The researchers, based at several universities across Italy, propose the virus could be scattered all the more generally on air pollution particles [4]. Harvard researchers suggest their results are especially important for vulnerable minority groups, which will be slowly exposed to air pollution in general, leading to the likelihood of Coronavirus being genuinely sick. For every small increment in air pollution, there's a generous increase in death [5]. Based on EPHA study comprising people’s ability to fight off infection resulted with weakening of Immune system by airpolloutants, [6]. One recent study found that even little increments in fine particulate matter of only 1 µg for every cubic meter related to a 15% expansion in Covid-19 passings [7]. Further the relations between PM and communicable diseases were also recorded in more recent studies revealed inhalation may transmit PM concentrated into the lungs, and particle-attached viruses may directly conquer the inferior respiratory tract, thus raising infection induction [8]. If this is true that novel Coronavirus remains active on various surfaces from a few hours to several days [9], it is reasonable to conclude the same might appear when adsorbed or absorbed by the particulate matter in the atmosphere, which can also possibly bring the viruses into the respiratory epithelium.
3. Study area and methodology
A part of central and western Chennai which covers 44 wards of more commercial areas, around 11 stations (Ambattur, Maduravayol, Porur, Valasaravakkam, Koyembedu, Annanagar, Kilpauk, Nungambakkam, T.Nagar, and Alandur) in Chennai city, India was chosen for the study Fig. 1 . The pollutants were checked utilizing well-calibrated ambient air quality observing instrument Envirotech APM 550 and indigenous portable MGR Airpollution mobile monitoring device [10]. The sampling stations and measurements are planned for a Ph.D. research work which is utilized in the study further with builtin analog to digital converter (ADC) embedded in microcontroller@mega328 and solid state gas sensors. During the measurements, the IOT, GIS and GPS technology are utilized for decoding the sensor produced voltage value comparing to the convergence of gas.[11] This is minimal and convenient instrument for completing and observing of air toxins. The collected data is analaysed in ArcGIS 10.6 software using IDW spatial analysis techniques for preparation of GIS map for Particulate matter pollutants and categorized into default ten classes of equal intervals. Further, the Covid Positive cases reported by the official website of the Government of India were overlaid in GIS to analyze data pertinent to surrounding PM levels (pre and during covid). Urban conditions and virus incidence for the study area is further analysed using map overlay techniques to determine the association between PM pollution level and the spread of COVID-19.
Fig. 1.
Study area - Part of Greater Chennai-India.
4. Result and discussion
4.1. Pre-COVID PM2.5 vs. corona positive cases
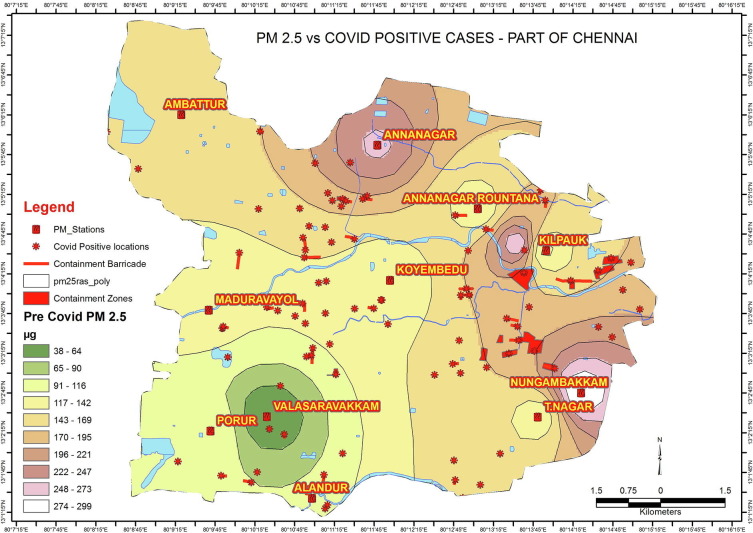
A spatial distribution for pre-COVID PM2.5 and positive corona cases between the 11 stations is geographically heterogeneous, and it is presented in Fig. 2(a) . The contamination levels of PM2.5 during precovid, was found to be extremely high, ranging from 38 µg/m3 (Valasaravakkam) to 299 µg/m3 (Nungambakkam) which is seven times excessive than airpollution standards (NAAQS), ie 40 µg/m3. The map indicates that the areas ranging from (38 to 90 µg/m3) with minimum contamination level (<5 cases) have been reported with fewer positive cases. In comparison, the areas covering above the range of (91 to 195 µg/m3) has a significant influence on the number of positive cases, approximately 91 percent of distribution. In addition to the transmission of various viruses that occur through close communication with infested individuals over direct inhalation of the liquid droplets formed by coughs or exhalations and/or contact with contaminated surfaces [12], the veracity of COVID-19 occurrence (Table 1 ) observed in most of the highly polluted areas with – compared to that of low, also suggested to consider possible route of transmission by airborne route.
Fig. 2a.
Spatial distribution of PreCovid PM 2.5 and Overlay of Covid +ve Spots.
Table 1.
Pre Covid PM 2.5 dispersion in part of Greater Chennai and Present Covid cases.
|
Pre Covid PM 2.5 |
||
|---|---|---|
| Corona +ve incidence | Concentration Range in μg/m3 | % Distribution |
| 2 | 38–64 | 2.30 |
| 2 | 65–90 | 2.30 |
| 13 | 91–116 | 14.94 |
| 18 | 117–142 | 20.69 |
| 26 | 143–169 | 29.89 |
| 22 | 170–195 | 25.29 |
| 2 | 196–221 | 2.30 |
| 3 | 222–247 | 3.45 |
| 0 | 248–273 | 0.00 |
| 0 | 274–299 | 0.00 |
The pre covid particilate matter pollution zones revealed that less polluted areas are indicated with <3 +ve cases with <3.5% of distribution and might be resulted from foreign source and indicating that there is no community spread however while most polluted areas has more than 13 +ve cases and max of 26 +ve cases with 90 percent distribution and started carried away through atmospheric medium by means of particulate suspension.
4.2. During COVID PM2.5 vs. corona positive cases
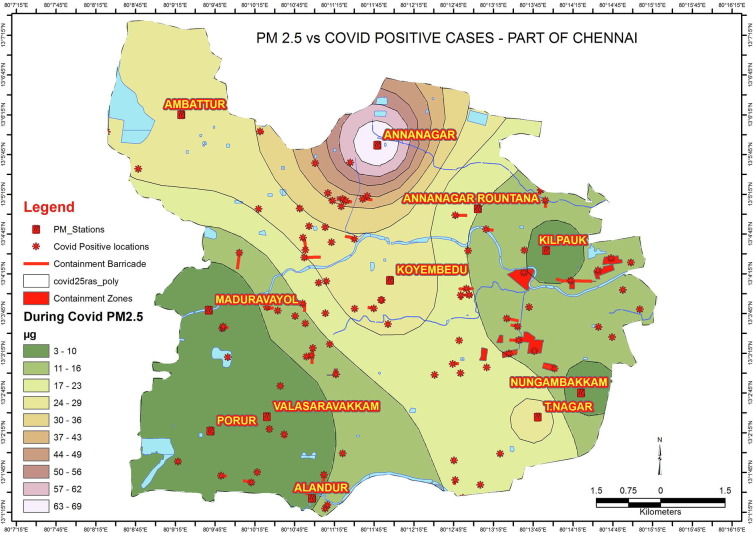
The lockdown brought numerous anthropogenic (human-made) supporters of a halt. Chennai, one of the most critically polluted cities, also reported a significant reduction in air pollution. The contamination levels of PM2.5 during covid was found to be 3 µg/m3 (Valasaravakkam) to 69 µg/m3 (T.Nagar) Though there was merely 80% reduction in levels, the impact of pre covid pollution levels still had a more significant impact on the spread of positive cases. Areas under the range of 3 to 43 µg/m3experienced worst cases as indicated in the Table 2 and represented in Fig. 2(b) .
Table 2.
During Covid PM 2.5 dispersion in part of Greater Chennai and Present Covid cases.
|
During Covid PM 2.5 |
||
|---|---|---|
| Corona +ve incidence | Concentration Range in μg/m3 | % Distribution |
| 12 | 3–10 | 13.79 |
| 33 | 11–16 | 37.93 |
| 17 | 17–23 | 19.54 |
| 15 | 24–29 | 17.24 |
| 2 | 30–36 | 2.30 |
| 7 | 37–43 | 8.05 |
| 0 | 44–49 | 0.00 |
| 0 | 50–56 | 0.00 |
| 1 | 57–62 | 1.15 |
| 0 | 63–69 | 0.00 |
Fig. 2b.
Spatial distribution of Covid PM 2.5 and Overlay of Covid +ve Spots.
However, during covid the particulate matter emission zones reported that less contaminated areas are indicated with 12 to 33 +ve cases with <88.5 percent distribution suggesting that there is a probability of community spread rather than atmospheric PM 2.5 ingestion. Although most contaminated areas have a distribution of <7 +ve cases <10% that could be carried through the atmospheric medium by means of particulate suspension.
4.3. Pre-COVID PM10 vs. corona positive cases
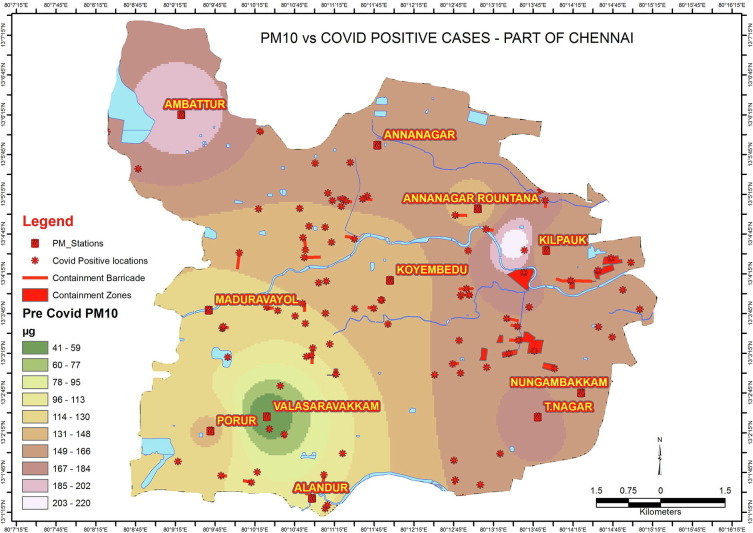
Larger particles (>5 μm) appear to settle on the upper respiratory tract surfaces of nose breathers, and occur with deposition on the upper respiratory tract. Exposure to PM10 is associated with increased bronchiolitis in infants with respiratory syncytial virus hospitalisations [13]. Fig. 2(c) shows the variation of PM10 at all 11 stations. During precovid, the levels range from 41 µg/m3 (Valasaravakkam) to 220 µg/m3 (Alandur). PM10 concentrations (above the daily limit value) 100 µg/m3 might also relate to infection diffusion, high concentrations above the PM10 limit in some stations (area under the range of 78 to 184 µg/m3) may have exerted an inclination to the contagious feast of the epidemic due to unhygienic conditions prevailed leading to unhealthiness, Notably, these contain more number of covid positive cases around 90 percent (Table 3 ).
Fig. 2c.
Spatial distribution of Pre Covid PM 10 and Overlay of Covid +ve Spots.
Table 3.
Pre Covid PM 10 dispersion in part of Greater Chennai and Present Covid cases.
|
Pre Covid PM 10 |
||
|---|---|---|
| Corona +ve incidence | Concentration Range in μg/m3 | % Distribution |
| 2 | 41–59 | 2.27 |
| 1 | 60–77 | 1.14 |
| 0 | 78–95 | 0.00 |
| 9 | 96–113 | 10.23 |
| 13 | 114–130 | 14.77 |
| 19 | 131–148 | 21.59 |
| 38 | 149–166 | 43.18 |
| 5 | 167–184 | 5.68 |
| 0 | 185–202 | 0.00 |
| 1 | 203–220 | 1.14 |
The pre covid particulate matter pollution zones revealed that less polluted areas are indicated with <2 +ve cases with <3% of distribution and might be resulted from foreign source and indicating that there is no community spread however while most polluted areas has more than 9 +ve cases to the maximum of 38 +ve cases with 89.77 percent distribution and might be resulted from transportation of particulate suspension through atmospheric medium.
4.4. During COVID PM10 vs. corona positive case
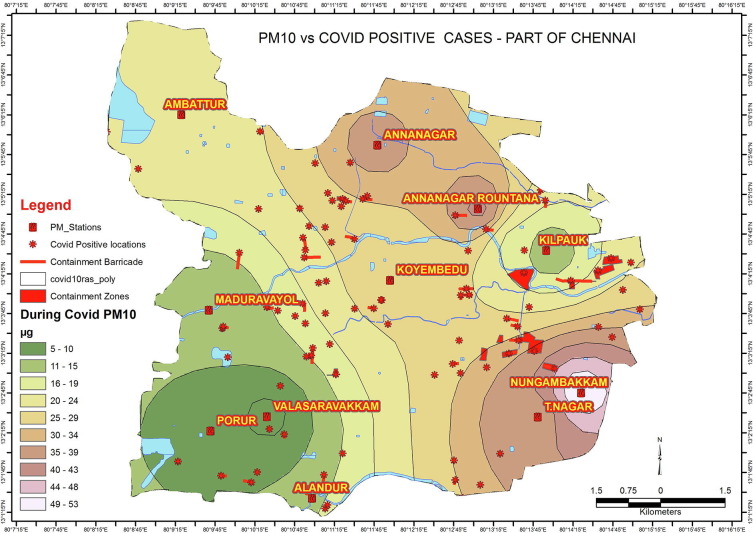
The contamination levels of PM10 has significantly decreased during the lockdown period. There was about 80 to 90% reduction rate. The variation of covid positive cases also showed significant change. From Fig. 2(d) it was observed that areas under the range (5 to 40 µg/m3) has more positive cases (98 percentage) than other areas (Table 4 ).
Fig. 2d.
Spatial distribution of Covid PM 10 and Overlay of Covid +ve Spots.
Table 4.
During Covid PM 10 dispersion in part of Greater Chennai and Present Covid cases.
|
During Covid PM 10 |
||
|---|---|---|
| Corona +ve incidence | Concentration Range in ug/m3 | % Distribution |
| 6 | 5–10 | 6.82 |
| 7 | 11–15 | 7.95 |
| 15 | 16–19 | 17.05 |
| 17 | 20–24 | 19.32 |
| 27 | 25–29 | 30.68 |
| 11 | 30–34 | 12.50 |
| 4 | 35–39 | 4.55 |
| 1 | 40–43 | 1.14 |
| 0 | 44–48 | 0.00 |
| 0 | 49–53 | 0.00 |
During covid particulate matter pollution zones revealed that less polluted areas are indicated with <87 +ve cases with <98% of distribution and might be resulted from community spread or pimary contacts however while most polluted areas has only 1 +ve case with <2 percent distribution and has no significant role in spreading due to atmospheric medium by means of particulate suspension.
5. Conclusion
The air pollution might be clearing in Chennai due to lockdown; however, the harm has just been done to human wellbeing and individuals' capacity to ward off disease. Governments ought to have handled ceaseless air contamination quite a while in the past. However, it has organized the economy over wellbeing. Science articulates epidemics like COVID-19 will occur with increasing rate of recurrence [14]. The published literatures on airborne transmission provides the first fundamental perception of a stable relationship between the quantity of COVID-19 positive cases and PM tops. Which futher make us to carry out more theoretical and experimental studies on this transmission path and the potential work of PM on viral spread and infectivity (in addition to the possibility of considering PM rates as a 'indicator' of the predicted effect of COVID-19 on most contaminated regions). The observations of the materials (+ve cases, PM 10, PM 2.5) collected proved that during precovid regime less polluted areas are indicated now with less than 5 infection cases reflecting the healthy people with less pollution and they are less vulnerable to covid except the few occurrence of foreign source indicating no community spread whereus most polluted spots of precovid regimes are indicated with more than 90% cases and indicated that pollution zones the people are succumbed to get infected quickly. However, during Covid period the lockdown has considerably reduced the particulate suspension and the results revealed that the +ve cases are of the nature of community spreading through primary and secondary contacts as reported from the media. If Covid is a visible, brutally virulent, incredibly contagious pandemic that kills rapidly and mercilessly, air pollution is its unseen evil twin. Under the radar, but even ruthlessly, if Covid and PM paired together lead to murder without delay. This is a non-communicable disease (NCD) slow-motion pandemic, equivalent-if not exceeding-the catastrophic wrath of SARS-CoV-2. The hypothesis could exploit ways to connect atmospheric particulates is a challenging point which we believe deserves more, immediate and in-depth experimental work. It is to be expected that steps to clarify the dynamics involved in the current pandemic will be taken promptly.
Credit authorship contribution statement
S. Laxmipriya: Data curation, Methodology, Writing - original draft. RM. Narayanan: Conceptualization, Methodology, Software, Supervision, Writing - review & editing.
Declaration of Competing Interest
The authors declare that they have no known competing financial interests or personal relationships that could have appeared to influence the work reported in this paper.
Acknowledgements
The authors are thankful to those who helped in placing the airsampler in the prescribed hotspots for obtaining the results during field observations and the technical support rendered by ESRI India ltd in preparation of GIS maps. We also thank the Er A.C.S. Arunkumar President, Dr M.G.R Educational and research Institute for providing the necessary facilities and for their constant motivations to carry out this research study.
References
- 1.T.N.T. Nguyen, D.V. Ha, T.N.N. Do, V.H. Nguye,n X.T. Ngo, V.H. Phan, et al., Air pollution monitoring network using low-cost sensors, a case study in Hanoi, Vietnam. IOP Conf. Ser. Earth Environ. Sci., vol. 266, Institute of Physics Publishing, 2019, doi: 10.1088/1755-1315/266/1/012017.
- 2.Humphrey A.L., Gard L.C., Barnes C.S., Ciaccio C.E. The relationship between indoor particulate matter and home ventilation. J. Allergy Clinical Immunol. 2012;129(2):AB90. doi: 10.1016/j.jaci.2011.12.665. [DOI] [Google Scholar]
- 3.Gonzalez A., Boies A., Swason J., Kittelson D. Field calibration of low-cost air pollution sensors. Atmos Meas Tech Discuss. 2019:1–17. doi: 10.5194/amt-2019-299. [DOI] [Google Scholar]
- 4.Monn C. Particulate matter air-pollution. Allergologie. 1994;17:509–513. [Google Scholar]
- 5.Zhang S., Na J., Zhou W., Liu B., Yang W., Zhou P., et al. A familial cluster of COVID-19 indicating virus can be transmitted by asymptomatic carriers. Bull World Heal Organ. 2020 doi: 10.2471/BLT.20.251561. [DOI] [Google Scholar]
- 6.Zhang J., Tian S., Lou J., Chen Y. Familial cluster of COVID-19 infection from an asymptomatic. Crit. Care. 2020;24(1) doi: 10.1186/s13054-020-2817-7. [DOI] [PMC free article] [PubMed] [Google Scholar]
- 7.Air Pollution: Particulate Matter. Green Atlas A Multimed. Ref. Introd. AIDS Fr. Beijing Smog Chinese Bicycl. Body Power Chernobyl 25 Years Later Mex. Coral Reefs Battling Deforestation Honduras Outbreak Desertif. Chile India’s E-Waste Ecotourism Phil, 2014, doi: 10.4135/9781412995719.n5.
- 8.L. Sanità di Toppi, L. Sanità di Toppi, E. Bellini, Novel coronavirus: how atmospheric particulate affects our environment and health. Challenges 11 (2020) 6, doi: 10.3390/challe11010006.
- 9.Y. Yu, Y.-R. Liu, F.-M. Luo, W.-W. Tu, D.-C. Zhan, G. Yu, et al., COVID-19 Asymptomatic Infection Estimation. MedRxiv 2020:2020.04.19.20068072. https://doi.org/10.1101/2020.04.19.20068072.
- 10.Hien P.D., Men N.T., Tan P.M., Hangartner M. Impact of urban expansion on the air pollution landscape: a case study of Hanoi, Vietnam. Sci. Total Environ. 2020;702:134635. doi: 10.1016/j.scitotenv.2019.134635. [DOI] [PubMed] [Google Scholar]
- 11.Kim H.C., Kim S., Kim B.-U., Jin C.-S., Hong S., Park R., Son S.-W., Bae C., Bae MinAh, Song C.-K., Stein A. Recent increase of surface particulate matter concentrations in the Seoul Metropolitan Area, Korea. Sci. Rep. 2017;7(1) doi: 10.1038/s41598-017-05092-8. [DOI] [PMC free article] [PubMed] [Google Scholar]
- 12.Fisher D., Heymann D. Q&A: The novel coronavirus outbreak causing COVID-19. BMC Med. 2020:18. doi: 10.1186/s12916-020-01533-w. [DOI] [PMC free article] [PubMed] [Google Scholar]
- 13.Zhang Yi, Xu Jiuyang, Li Hui, Cao Bin. A novel coronavirus (COVID-19) outbreak. Chest. 2020;157(4):e99–e101. doi: 10.1016/j.chest.2020.02.014. [DOI] [PMC free article] [PubMed] [Google Scholar]
- 14.J.L. Ravelo, S. Jerving, COVID-19 — a timeline of the coronavirus outbreak. DevexCom 2020.


