Highlights
-
•
The impact of people's behavior during COVID 19 quarantine on energy consumption.
-
•
The study was conducted numerically (using EnergyPlus software) during March 2020.
-
•
The energy and water consumption, CO2 emissions and economic was analysed.
-
•
Protection measures adopted by the Government of the Republic Serbia were considered.
-
•
The energy and environmental indicators were presented for the last three years.
Keywords: COVID-19, People's behavior, Energy consumption, Water consumption, EnergyPlus
Abstract
Humanity is currently confronted with a new, unknown, highly contagious virus, where social isolation and increased personal hygiene seem to be the main means in preventing its spread. The world economy is very threatened by the new situation, which has not bypassed the energy sector either. The mortality rate is relatively high, people are not leaving their homes, which is directly reflected in the increase of the energy consumption in the residential sector. The same is valid for water consumption. For a household located in Kragujevac (Central Serbia), 4 simulation scenarios were analyzed (S1 – reference case, S2 – mild protection measures, S3 – semi-quarantine measures, S4 – complete quarantine) to assess the link between people's behavior (on the one hand) and the consumption of natural gas, electricity and water (on the other hand), in the residential sector, in unforeseen circumstances, such as the COVID-19 virus pandemic. The analysis was conducted numerically for the month of March 2020, using EnergyPlus software packages. In defining the above scenarios, a one-minute time step schedule of people's behavior was used, taking into account the number of family members in the household, their age, occupation, lifestyle, habits (all in accordance with cultural and socio-economic circumstances), as well as the measures taken by the Government of the Republic of Serbia to fight the pandemic. Also, an analysis of energy consumption at the level of the city of Kragujevac for the past three years was made, based on data obtained from public companies – distributors (thermal energy, natural gas, electricity, water). In this paper, an analysis of air quality for the same time period was conducted, which is closely related to energy consumption and limited population movement. The simulatinos show that the consumption of natural gas can increase by 21.26% (S2), electricity by 58.39% (S4), and the consumption of water from the city water supply network by 25.45% (S3) compared to the reference case (S1). On the other hand, based on the invoice for payment of services to distributors, the actual energy consumption that was made on the analyzed house during the month of March 2020 was: natural gas (260.36 Sm3), electricity (1418 kWh), and water (22.5 m3). The conducted economic analysis showed that the largest funds at the level of the entire facility were allocated in S3 (27.33% more than in S1), and that the actual costs were 15.09% higher than in S1, and 16.41% lower than in S2.
Nomenclature
- tA
Average outdoor air temperature, [°C]
- CD
Cardinal directions
- CHS
Central heating system
- CW
Cold water
- tHW
Cold water temperature, [°C]
- IDIFF
Diffuse solar radiation, [W/m2]
- IDIR
Direct solar radiation, [W/m2]
- DHS
District heating system
- tDRY
Dry bulb temperature, [°C]
- ηB-EB
Electric boiler efficiency, [%]
- EDS
Electricity distribution service
- E(B-EE)fin
Final energy consumption for electrical equipment, [kWh]
- E(B-EL)fin
Final energy consumption for lighting, [kWh]
- E(B-GB)fin
Final energy consumption for space heating, [kWh]
- E(B-EB)fin
Final energy consumption for water heating, [kWh]
- QB-GB
Gas boiler power, [W]
- HDD
Heating degree days, [°C·day]
- HW
Hot water
- tHW
Hot water temperature, [°C]
- NGSS
Natural gas supply system
- NRS
Non-residential sector
- U
Overall heat transfer coefficient of the building construction, [W/m2K]
- φ
Relative humidity, [%]
- RS
Residential sector
- R(B-E)pry
Site to source energy conversion factor for electricity, [–]
- R(B-GB)pry
Site to source energy conversion factor for natural gas, [–]
- e(B-E)CO2
Specific CO2 emission for electricity, [kg/kWh]
- e(B-GB)CO2
Specific CO2 emission for natural gas, [kg/kWh]
- SEC
Specific electricity consumption, [kWh/connection]
- SECNRS
Specific electricity consumption in NRS, [kWh/connection]
- SECRS
Specific electricity consumption in RS, [kWh/connection]
- SHEC
Specific heating energy consumption, [kWh/m3]
- SHECNRS
Specific heating energy consumption in NRS, [kWh/m3]
- SHECRS
Specific heating energy consumption in RS, [kWh/m3]
- SNGC
Specific natural gas consumption, [Sm3/connection]
- SNGCNRS
Specific natural gas consumption in NRS, [Sm3/connection]
- SNGCRS
Specific natural gas consumption in RS, [Sm3/connection]
- SWC
Specific water consumption, [m3/connection]
- SWCNRS
Specific water consumption in NRS, [m3/connection]
- SWCRS
Specific water consumption in RS, [m3/connection]
- QE-tot
Total amount of electricity delivered to the users of the EDS, [kWh]
- QDHS-tot
Total amount of thermal energy delivered to the users of the DHS service, [MWh]
- VW-tot
Total amount of water delivered to the users of the WSSS, [m3]
- VW-totNRS
Total amount of water delivered to the users of the WSSS in NRS, [m3]
- VW-totRS
Total amount of water delivered to the users of the WSSS in RS, [m3]
- VNGSS-tot
Total natural gas consumption in the NGSS, [Sm3]
- m(B)CO2
Total CO2 emission, [kg]
- E(B)fin
Total final energy consumption, [kWh]
- NE-tot
Total number of electrical users, [–]
- NDHS-tot
Total number of users of the DHS service, [–]
- NNGSS-tot
Total number of users of the NGSS service, [–]
- NW-tot
Total number of users of the WSSS, [–]
- E(B)pry
Total primary energy consumption, [kWh]
- VDHS-tot
Total volume of heating space in the DHS, [m3]
- VZ-EB
Volume of electric boiler, [L]
- WSSS
Water supply system service
- tWET
Wet bulb temperature, [°C]
- α
Wind direction, [deg]
- c
Wind speed, [m/s]
- AW(D)
Window or door opening area, [m2]
- QZ-EB
Zone electric boiler power, [W]
- QZ-EE
Zone electrical equipment power, [W]
- qZ
Zone infiltration, [h−1]
- QZ-EL
Zone lighting power, [W]
- nZ-MAX
Zone maximum number of people, [–]
- QZ-GB
Zone space heater power, [W]
- ZTC
Zone thermostat control, [°C]
1. Introduction
In the EU-28, the major fraction of energy is used for heating the households (77.18% of the final energy consumption in the residential sector). Only a small fraction of electricity is used for space cooling (0.04%) and lighting and electrical equipment (2%). Hot water heating is in the second place with a share of 14.08%, seem to be where 44% of the required thermal energy originates from oil and petroleum, while food preparation, i.e. cooking (with 6.26%) is in third place [1]. Apart from climatic parameters, final energy consumption in the residential sector significantly depends on the people’s behavior (artificial parameters). In the attempt to minimize the consumption of final energy in the housing sector, a large number of published papers deal with predicting the movement of people, their habits and the way of using thermo-technical systems, applying a variety of available scientific methods [2], [3], [4], [5], [6], [7], [8], [9], [10]. Santin et al. in [11] used the KWR database of the Dutch Ministry of Housing to show that the people’s behavior inside a building affects the final energy consumption for space heating (4.2%), but that it largely depends on the characteristics of the building (42%). The Dutch residental sector was also studied in [12] with the aim of determining the extent to which the use of natural gas and electricity is determined by the technical specifications of the dwelling in relation to the demographic characteristics of the inhabitants in a sample of over 300,000 homes. The results showed that the consumption of natural gas is primarily determined by the characteristics of the building, and that the consumption of electricity directly depends on the composition of the household. In order to more accurately predict energy consumption in buildings, Fabi et al. analyzed the state of the art of modeling resident/inhabitant behavior within energy simulation tools and proposed new concepts to possibly improve the utilization of these tools [13]. In [14], Chen and Cook analyzed the distribution of energy consumption in a home and then presented linear and nonlinear regression learning models for predicting energy consumption taking into account peoples’s behavior. Based on the presented models, a website was developed to provide feedback to end users in order to promote energy efficiency and sustainability of the residential sector. Shan Hu et al. concluded based on a study of 4964 households that China should focus on final energy consumption, while maintaining traditional behavior and lifestyle and promoting energy protection policies [15]. A study conducted in the city of Hangzhou [16] showed a negative correlation between the age of residents and energy consumption in homes, i.e., that older residents show a more favorable pattern of behavior compared to the younger ones. This study also showed that socio-economic factors can explain 28.8% of the variations in energy consumption for heating and cooling. Ren et al. developed a physically based bottom-up model for estimating annual electricity consumption (natural gas and other forms of energy not considered) in the local community residential sector in New South Wales, Australia [17]. A holistic analysis of energy consumption patterns in residential buildings and overall housing needs in urban and rural households in Finland were analyzed in [18]. Energy consumption in the Kuwaiti residential sector in a sample of 30 homes was discussed in [19]. In [20], the influence of three parameters related to human behavior (family size, heating system management, heated space management) on the load of apartment heating in Belgium was investigated. The energy conservation policy in the residential sector in the city of Osaka (Japan) was implemented in [21]. Using data collected by the U.S. Census Bureau, [22] presents a statistical method for modeling household behavior to estimate energy consumption in the residential sector. In [23], a model that connects home and behavioral factors with energy use in the residential sector is presented. This paper lists the determinants of household energy use that include socio-demographic factors, family lifestyle, energy prices, energy-related behavior, efficiency, responsibility, feedback, and more. An empirical study in [24] aimed to determine the relationship between the building technology and the behavior of tenants and their combined effects on energy consumption in the residential sector. The results showed that 42% of technological progress directly contributes to the energy efficiency of the house, suggesting that energy savings also depend on the behavior of tenants. A simulation of the impact of domestic occupancy profiles on the energy performance of an energy-efficient house located in Lithuania was discussed in [25]. The study assessed the impact of residents' characteristics and behavior on energy needs for heating, lighting and ventilation. Four different occupancy profiles were simulated over one year, using a time step of one hour. Four different thermal comfort strategies for different occupancy profiles were also analyzed. The results of the simulation clearly show that when performing energy simulations of buildings, the age, behavior and number of occupants must be taken into account, especially for energy efficient houses. This paper analyzes the impact of the schedules of people’s behavior, use of lighting, electric and water equipment (all defined with a one-minute time step) on the energy and water consumption in the house during emergency and unforeseen circumstances, which has not been done in the previously published literature. In order to gain a better insight into the impact of household behavior on energy and water consumption in the residential sector, this study also assesses the effect of additional parameters such as the number of household members, their age, occupation, lifestyle, and habits. For the study to be as close to reality as possible, people's behavior is defined in accordance with the cultural and socio-economic circumstances in the country, while respecting all measures adopted by the Government of the Republic of Serbia in accordance with the law in the fight against COVID-19 panedemic.
2. Description of the house
2.1. Location parameters
Kragujevac (latitude of 44.02°N, longitude of 20.92°E) is a city in the central part of Serbia, some hundred kilometers south of Belgrade. Kragujevac is situated on the banks of the Lepenica River, at an altitude of 209 m, in the time zone of GMT + 1 h. The climate is moderate continental, with pronounced seasons. The summers are hot and humid, with temperatures reaching +37 °C. On the other hand, the winters are cold (with temperatures going below −12 °C) and with snow [26]. The meteorological data for the city of Kragujevac are shown in Table 1 .
Table 1.
Meteorological data for Kragujevac [26].
| Month | tDRY [°C] | tWET [°C] | IDIFF [W/m2] | IDIR [W/m2] | φ [%] | α [deg] | c [m/s] |
|---|---|---|---|---|---|---|---|
| January | −0.24 | −1.44 | 33.30 | 63.63 | 79.92 | 213.17 | 2.01 |
| February | 0.88 | −0.46 | 49.39 | 86.66 | 79.82 | 210.60 | 2.02 |
| March | 5.57 | 3.29 | 77.08 | 106.12 | 72.06 | 207.98 | 2.35 |
| April | 10.87 | 7.74 | 92.65 | 149.02 | 67.92 | 209.06 | 2.27 |
| May | 16.06 | 12.18 | 113.30 | 176.45 | 66.57 | 210.08 | 1.77 |
| June | 18.85 | 14.99 | 109.50 | 208.94 | 69.42 | 209.51 | 1.69 |
| July | 20.78 | 16.04 | 110.60 | 228.12 | 64.49 | 198.04 | 1.62 |
| August | 20.38 | 15.69 | 96.25 | 215.40 | 64.05 | 211.45 | 1.51 |
| September | 16.68 | 13.30 | 75.54 | 166.92 | 71.21 | 203.79 | 1.68 |
| October | 11.18 | 8.83 | 57.34 | 119.43 | 76.40 | 222.28 | 1.69 |
| November | 6.08 | 4.45 | 39.83 | 64.51 | 79.80 | 210.38 | 2.06 |
| December | 1.13 | 0.09 | 28.66 | 58.86 | 83.51 | 208.33 | 1.87 |
2.2. Building descriptions
In this study, we analyze a three-storey house intended for permanent residence of a six-member family spanning three generations (Fig. 1 ). The first floor houses grandparents (Fig. 2 ), while the second floor houses mom and dad, their son going to primary school, and their daughter, who is a student (Fig. 3 ). The third floor is not functional and represents the attic space (AS).
Fig. 1.

Isometric view of the analyzed house.
Fig. 2.
Layout of rooms on the first floor LR – Living room, K1 – Kitchen 1, BA1 – Bathroom 1, H1 – Hall 1, BR1 – Bedroom 1, H3 – Hall 3, CS – Commercial space.
Fig. 3.
Layout of rooms on the second floor BR2 – Bedroom 2, BR3 – Bedroom 3, BA2 – Bathroom 2, H2 – Hall 2, K2 – Kitchen 2, BR4 – Bedroom 4.
The surface of each floor is the same and amounts to 109 m2, so the total area of the house is 328 m2. The total area of the thermal envelope is 489 m2 (with a 16.16% ratio of windows to walls). The exterior door is oriented to the south (Fig. 2). All the building elements of which the house is made are shown in Fig. 4 , and can be divided into two groups: exterior (Table 2 ) and interior (Table 3 ).
Fig. 4.

Vertical cross section of the analysed house D – Door, W – Window, EW – Exterior wall, GF1 – Floor on the ground 1, GF2 – Floor on the ground 2, RC – Roof construction, IW – Interior wall, IC1 – Intermediate construction 1, IC2 – Intermediate construction 2, IC3 – Intermediate construction 3.
Table 2.
The thermal characteristics of the exterior building elements.
| Construction | Layer |
d [m] |
λ [W/mK] |
ρ [kg/m3] |
cP [J/kgK] |
U [W/m2K] |
|---|---|---|---|---|---|---|
| D | Pine | 0.035 | 0.14 | 550 | 2090 | 4 |
| W | Glass | 0.004 | 0.9 | – | – | 2.72 |
| Air | 0.012 | R = 0.157 m2K/W | – | – | ||
| Glass | 0.004 | 0.9 | – | – | ||
| EW | Styrofoam | 0.05 | 0.041 | 20 | 1260 | 0.55 |
| Clay Block | 0.25 | 0.61 | 1400 | 920 | ||
| Lime mortar | 0.025 | 0.81 | 1600 | 1050 | ||
| FOG1 | Stone | 0.25 | 1.16 | 2000 | 920 | 0.63 |
| Gravel | 0.05 | 0.81 | 1700 | 840 | ||
| Unreinforced Concrete | 0.15 | 0.93 | 1800 | 960 | ||
| Reinforced Concrete | 0.04 | 2.04 | 2400 | 960 | ||
| Waterproofing | 0.001 | 0.19 | 1100 | 1460 | ||
| Extruded Polystyrene Foam | 0.02 | 0.03 | 33 | 1260 | ||
| Unreinforced Concrete | 0.15 | 0.93 | 1800 | 960 | ||
| Cement Screed | 0.04 | 1.4 | 2100 | 1050 | ||
| Ceramic Tiles | 0.015 | 0.87 | 1700 | 920 | ||
| FOG2 | Stone | 0.25 | 1.16 | 2000 | 920 | 0.6 |
| Gravel | 0.05 | 0.81 | 1700 | 840 | ||
| Unreinforced Concrete | 0.15 | 0.93 | 1800 | 960 | ||
| Reinforced Concrete | 0.04 | 2.04 | 2400 | 960 | ||
| Waterproofing | 0.001 | 0.19 | 1100 | 1460 | ||
| Extruded Polystyrene Foam | 0.02 | 0.03 | 33 | 1260 | ||
| Unreinforced Concrete | 0.15 | 0.93 | 1800 | 960 | ||
| Cement Screed | 0.04 | 1.4 | 2100 | 1050 | ||
| Parquet | 0.021 | 0.21 | 700 | 1670 | ||
| RC | Tile | 0.01 | 0.99 | 1900 | 880 | 3.38 |
| Roof Cardboard | 0.001 | 0.19 | 1100 | 1146 | ||
| OBS Panel | 0.011 | 0.12 | 1000 | 1880 | ||
Table 3.
The thermal characteristics of the interior building elements.
| Construction | Layer |
d [m] |
λ [W/mK] |
ρ [kg/m3] |
cP [J/kgK] |
U [W/m2K] |
|---|---|---|---|---|---|---|
| IW | Lime Mortar | 0.025 | 0.81 | 1600 | 1050 | 1.37 |
| Clay Block | 0.25 | 0.61 | 1400 | 920 | ||
| Lime Mortar | 0.025 | 0.81 | 1600 | 1050 | ||
| IC1 | Lime Mortar | 0.025 | 0.81 | 1600 | 1050 | 1.84 |
| Monta | 0.16 | 0.6 | 1200 | 920 | ||
| Cement Screed | 0.04 | 1.4 | 2100 | 1050 | ||
| Reinforced Concrete | 0.04 | 2.04 | 2400 | 960 | ||
| Ceramic Tiles | 0.015 | 0.87 | 1700 | 920 | ||
| IC2 | Lime Mortar | 0.025 | 0.81 | 1600 | 1050 | 1.6 |
| Monta | 0.16 | 0.6 | 1200 | 920 | ||
| Cement Screed | 0.04 | 1.4 | 2100 | 1050 | ||
| Reinforced Concrete | 0.04 | 2.04 | 2400 | 960 | ||
| Parquet | 0.021 | 0.21 | 700 | 1670 | ||
| IC3 | Lime Mortar | 0.025 | 0.81 | 1600 | 1050 | 1.83 |
| Monta | 0.16 | 0.6 | 1200 | 920 | ||
| Cement Screed | 0.04 | 1.4 | 2100 | 1050 | ||
| Reinforced Concrete | 0.04 | 2.04 | 2400 | 960 | ||
2.3. Thermo-technical systems
2.3.1. Space heating system
In this study, we have opted for hot water radiator heating in combination with the gas boiler of thermal power QB-GB = 28 kW as a heat energy generator, since the use of this type of central space heating in Serbia is increasing. Out of 14 zones (each room representing one zone), 12 are thermal zones, as no space heating is foreseen for the commercial space and attic. Depending on its purpose, each thermal zone is equipped with a radiator of an adequate heat output and a zone temperature controller (Table 4 ).
Table 4.
Characteristics of zone space heaters [27].
| Floor | Room | qZ [h−1] | ZTC [°C] | QZ-GB [W] | ||
|---|---|---|---|---|---|---|
| 00:00–06:00 h | 06:00–21:00 h | 21:00–24:00 h | ||||
| 1 | LR | 0.5 | 15 | 20 | 18 | 1843.03 |
| K1 | 1.5 | 15 | 20 | 18 | 2934.11 | |
| BA1 | 1.5 | 15 | 22 | 18 | 926.83 | |
| H1 | 0.5 | 15 | 20 | 18 | 1526.34 | |
| BR1 | 0.5 | 15 | 20 | 18 | 961.63 | |
| H3 | 0.5 | 15 | 20 | 18 | 683.11 | |
| CS | 0.5 | – | – | – | – | |
| 2 | BR2 | 0.5 | 15 | 20 | 18 | 2558.13 |
| BR3 | 0.5 | 15 | 20 | 18 | 2533.95 | |
| BA2 | 1.5 | 15 | 22 | 18 | 1179.88 | |
| H2 | 0.5 | 15 | 20 | 18 | 2142.14 | |
| K2 | 1.5 | 15 | 20 | 18 | 3474.34 | |
| BR4 | 0.5 | 15 | 20 | 18 | 2340.01 | |
| 3 | AS | 2 | – | – | – | – |
2.3.2. People
The maximum number of people per zone depends on the purpose of the zone and is defined in Table 5 .
Table 5.
Zone maximum number of people.
| Floor | 1 |
2 |
3 |
|||||||||||
|---|---|---|---|---|---|---|---|---|---|---|---|---|---|---|
| Room | LR | K1 | BA1 | H1 | BR1 | H3 | LOC | BR2 | BR3 | BA2 | H2 | K2 | BR4 | AS |
| nZ-MAX [–] | 6 | 6 | 1 | 6 | 2 | 1 | – | 1 | 1 | 1 | 4 | 4 | 2 | – |
Depending on the human activity, the amount of heat delivered to the room in the form of heat gains, according to the recommendations in [28] is: sleeping (72 W), sitting (108 W), learning (108 W), standing (126 W), cooking (175 W), walking (207 W) and cleaning (210 W).
2.3.3. Lighting and electrical equipment
Concerning the lighting (Table 6 ), surface mount fluorescent lamps [28] were installed in all zones, with their power being 60 W (BA1, BA2, H1, H2, H3) and 100 W (LR, BR1, BR2, BR3, BR4, K1, K2).
Table 6.
Characteristics of zone lighting and electrical equipment.
| Floor | 1 |
2 |
3 |
|||||||||||
|---|---|---|---|---|---|---|---|---|---|---|---|---|---|---|
| Room | LR | K1 | BA1 | H1 | BR1 | H3 | LOC | BR2 | BR3 | BA2 | H2 | K2 | BR4 | AS |
| QZ-EL [W] | 100 | 100 | 60 | 60 | 100 | 60 | – | 100 | 100 | 60 | 60 | 100 | 100 | – |
| QZ-EE [W] | 100 | 2200 | 1200 | – | – | – | – | 135 | 135 | 1200 | – | 2200 | 100 | – |
Regarding the electrical equipment, the LR is equipped with a television, the K1 is equipped with a 200 W fridge and an electric stove of 2000 W (the same applies to K2), the BA1 is equipped with a 1200 W hair dryer (as well as the BA2). The children's rooms (BR2 and BR3) have laptops, while the BR4 is equipped with a TV (like LR). The house is equipped with 2 irons (2720 W each) and 2 vacuum cleaners (2200 W each). In zones BR1, H1, H2, H3, except for vacuum cleaners, no other electrical equipment is included. The total power of electrical equipment by zone is shown in Table 6.
2.3.4. Water supply network
Water from the city water supply network is delivered to the house via zones BA1 and BA2 located at a common vertical line, from which it is further distributed to the water use equipment on the first floor (Fig. 5 ) and the second floor (Fig. 6 ).
Fig. 5.

Water supply network on the first floor.
Fig. 6.

Water supply network on the second floor.
As can be seen in Fig. 5, Fig. 6, both the first and second floors of the analyzed house have the same water use equipment. In the kitchens (K1, K2), the kitchen sink uses HW for dishwashing and CW for drinks and food storage. In the bathrooms (BA1, BA2), HW is used for showering, facial care (bathroom sink) and washing machine, while CW is used for the toilet. There are 2 electric water heaters in BA1 and BA2 used for HW preparation (Table 7 ).
Table 7.
Characteristics of zone water use equipment [29].
| Floor | Room | Electric boiler |
Type of end-use |
||||
|---|---|---|---|---|---|---|---|
| VZ-EB [L] | QZ-EB [W] | HW | tHW [°C] | CW | tCW [°C] | ||
| 1 | K1 | – | – | Kitchen sink | 40 | Kitchen sink | 10 |
| B1 | 80 | 2000 | Shower | 38 | Toilet | 10 | |
| Bathroom sink | 35 | ||||||
| Washing machine | 60 | ||||||
| 2 | K2 | – | – | Kitchen sink | 40 | Kitchen sink | 10 |
| B2 | 80 | 2000 | Shower | 38 | Toilet | 10 | |
| Bathroom sink | 35 | ||||||
| Washing machine | 60 | ||||||
2.3.5. Final and primary energy consumption and carbon dioxide emissions
The total final energy consumption in house E(B)fin [kWh] is the sum of the final energy consumption for the space heating E(B-GB)fin, the operation of lighting E(B-EL)fin, the operation of electrical equipment E(B-EE)fin and the HW preparation E(B-EB)fin. It is calculated using Eq. (1) [27]:
| (1) |
The final energy consumption is directly calculated by the software EnergyPlus [28] and their values are used for further calculation of primary energy consumption and carbon dioxide emissions.
The total primary energy consumption in house E(B)pry [kWh] is the sum of the primary energy consumption for the space heating E(B-GB)pry, the operation of lighting E(B-EL)pry, the operation of electrical equipment E(B-EE)pry and the HW preparation E(B-EB)pry. It is calculated using Eqs. (2) and (3) [27]:
| (2) |
| (3) |
By analogy with the determination of the total final and primary energy consumption in the house, the total carbon dioxide emission m(B)CO2 [kg] can be determined using Eq. (4) and Eq. (5) [27]:
| (4) |
| (5) |
3. Software
To simulate thermal behavior of the house design, EnergyPlus software was used. This software is a very useful tool for modeling energy and environmental behavior of buildings. The software runs dynamic analysis on hourly or smaller time steps. The program was initially developed by Lawrence Berkeley National Laboratory, U.S. Army Construction Engineering Laboratory, and the University of Illinois [30]. The software can also take into account how people use a building during its space air conditioning. This allows for the complex schedules of HVAC systems to be defined together with the schedules for the use of lighting, internal energy devices and occupancy in the building.
4. Simulation scenarios
In general, each country affected by the COVID-19 virus has implemented special measures to prevent the further spread of the epidemic. The adopted measures depend on when the first infected person (a zero patient) emerged, the current state of the health system, the burden on the health system, the way the state leadership viewed and experienced the whole situation, the consciousness of citizens, the socio-economic situation in the country, political opportunities, and a number of other influential factors. The first case of infection in the Republic of Serbia was recorded on 6 March 2020. From that moment on, the governement took a number of measures to slow down the spread of the epidemic, which included the inclusion of some very difficult and rigorous measures to protect the health of the citizens of Serbia (Table 8 ).
Table 8.
Measures put in place by the Government of the Republic of Serbia in the fight against the COVID-19 virus during the month of March 2020 [31].
| Date | Description |
|---|---|
| 10.03 | Excursions and study trips have been postponed |
| Flights from Nis Airport have been canceled | |
| 11.03 | The number of people indoors is limited to max 100 |
| Scheduled celebrations have been canceled | |
| A global pandemic by the WHO has been declared | |
| 12.03 | Self-isolation for Serbian nationals coming from affected areas for 14 and 28 days has been introduced |
| 13.03 | 44 smaller border crossings have been closed for foreign nationals (except for Serbian ones) |
| 15.03 | Persons older than 65 years are recommended not to leave homes |
| It is recommended that personal hygiene be maintained at the highest possible level | |
| Declared state of emergency in Serbia | |
| 16.03 | All border crossings for foreign nationals have been closed |
| 17.03 | The number of people indoors is limited to 1 person per 4 m2 |
| Persons older than 65 are prohibited from moving between 10:00 and 24:00 h | |
| Curfew was introduced between 20:00 and 05:00 h | |
| 19.03 | Flights from Belgrade airport have been canceled |
| Border crossings for passenger traffic have been closed | |
| 20.03 | Intercity traffic have been suspended |
| 21.03 | Catering facilities have been closed |
| Public transit has been suspended | |
| The number of people indoors is limited to max 5 | |
| Gatherings in parks have been prohibited | |
| Curfew was introduced from 17:00 to 05:00 h | |
In this paper, all the protection measures (Table 8) were first sorted into four large categories, on the basis of which 4 simulation scenarios analyzing the consumption of natural gas, electricity and water were elaborated.
4.1. Scenario S1
The first scenario is based on the behavior of house residents in normal conditions before the COVID-19 outbreak. In this reference scenario, the grandparants are in charge of all household chores (grocery shopping, preparation of meals, cleaning, ironing, etc.) The parents are at work until 16:00. As not all of the members of the household are present in the house in this period of time, and considering that one child studies at a university in another city, the house is not used in its entirety. Therefore, the radiators in the kitchen K2 and the bedroom BR2 are turned off in this period, to reduce the heating costs. In order to compute the final and primary energy consumption and the related CO2 emission as accurate as possible, three typical time-schedules for using the different house zones with respect to the occupancy, lighting and electrical equipment are considered (each one with a one-minute time step): Weekday, Saturday, and Sunday.
4.1.1. Weekday
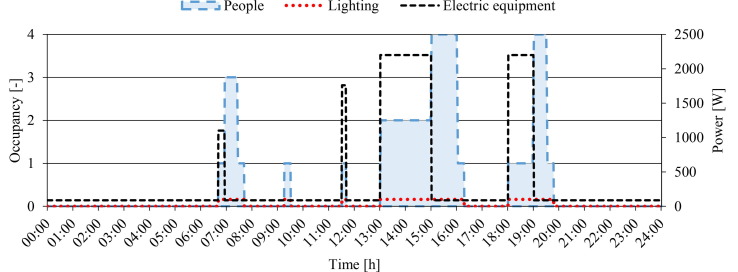
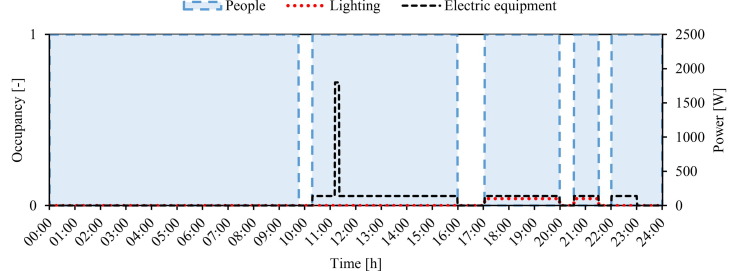
On weekdays, mom and dad are at work from 08:00 to 16:00 h, while the son is at school from 08:00 to 14:00 h. Grandpa purchases daily groceries from 10:00 to 11:00 h. Grandma spends 15 min daily preparing breakfast (06:45–07:00 h), 2 h preparing lunch (14:30–16:30 h) and 1 h preparing dinner (19:00–20:00 h). Breakfast is from 07:00 to 07:30 h, lunch from 16:30 to 17:30 h, and dinner from 20:00 to 20:30 h (Fig. 7 ). Bathrooms (BA1, BA2) are used on a daily basis as follows: 15 min per person in the morning, 1–5 min per person during the day (depending on need) and 30 min per person in the evening (8 min are scheduled for showering, 15 min for hair drying and 7 min for washing, brushing, etc.). The time-schedule of using the bathroom BA2 during the working day is shown in (Fig. 8 ).
Fig. 7.
Schedule for using the kitchen K1 during the weekdays for Scenario S1.
Fig. 8.
Schedule for using the bathroom BA2 during the weekdays for Scenario S1.
4.1.2. Saturday
Saturday is the first non-working day, which means everyone in the house sleeps longer than usual (until 08:00 h). After breakfast (09:00–09:30 h), the grandparents go to the market (10:00–13:00 h), the son is also outside (10:00–15:00 h), while the mother uses this time for cleaning and vacuuming of all rooms in the house (10:00–12:00 h). Lunch starts earlier in the day (15:00 h), after which the time is used to rest and study (16:00–19:00 h). The family traditionally goes out for dinner on Saturdays, so there is no one at home from 19:00 to 21:30 h (Fig. 9 ). This period of absence is used for laundry in the bathrooms BA1 and BA2 (Fig. 10 ).
Fig. 9.
Schedule for using the kitchen K1 during Saturday for Scenario S1.
Fig. 10.
Schedule for using the bathroom BA2 during Saturday for Scenario S1.
4.1.3. Sunday
Sunday is the day when all family members spend time together (on a Sunday service in the local church, a picnic in the park, or a walk in the nature) (09:00–11:30), which means that breakfast starts at 08:00 h. Before going to the family gathering, the washing machines (BA1, BA2) are put into operation to complete the washing cycle before the family returns home (Fig. 11 ). Once at home, the grandmother and mother set aside about 90 min for weekly ironing. Sunday lunch runs from 15:00 to 16:00 h, and dinner from 20:00 to 20:30 h (Fig. 12 ). This day is generally reserved for rest, study, meeting family members and preparing for the new workweek (Fig. 13 ).
Fig. 11.
Schedule for using the bathroom BA2 during Sunday for Scenario S1.
Fig. 12.
Schedule for using the kitchen K1 during Sunday for Scenario S1.
Fig. 13.
Schedule for using the living room LR during Sunday for Scenario S1.
4.2. Scenario S2
Due to the global pandemic, the daughter returned home from college. The government has put in place a number of measures (Table 8) which include recommendations that the elderly should not leave their homes and avoid contacts with other members of the household, as they are the most endangered category. Greater hand hygiene and room ventilation are also recommended. Due to all of the above, the laundry is washed and ironed 3 times a week, the house is cleaned and vacuumed daily, and the ventilation of each room is done several times a day (Table 9 ). Curfew in this scenario starts from 17:00 h and ends until 05:00 h the next day, so the mother and father continue to go to work and the son goes to school. The daughter (since she has no major commitments in college) is most involved in housework, which includes going to the store, preparing lunch, cleaning the upper floor, etc. As a ban on Saturday and Sunday was introduced, one schedule is considered for the first floor for each day during the week, while for the second floor two schedules are considered: weekdays and weekends.
Table 9.
Zone ventilation schedule for weekdays during the month of March 2020.
| Floor | Room | AW(D) [m2] | CD | Ventilation [h] |
||
|---|---|---|---|---|---|---|
| I | II | III | ||||
| 1 | LR | 1.76 | S | 10:20–10:25 | 16:00–16:05 | 19:30–19:35 |
| K1 | 1.68 | E | 10:30–10:35 | 16:00–16:05 | 19:30–19:35 | |
| BA1 | 0.36 | N | 10:10–10:15 | 16:00–16:05 | 19:30–19:35 | |
| H1 | 2.94 | S | 10:40–10:45 | 16:00–16:05 | 19:30–19:35 | |
| BR1 | 1.68 | N | 10:00–10:05 | 16:00–16:05 | 19:30–19:35 | |
| H3 | 0.96 | W | 10:50–10:55 | 16:00–16:05 | 19:30–19:35 | |
| LOC | – | – | – | – | – | |
| 2 | BR2 | 1.76 | S | 11:05–11:10 | 17:32–17:37 | 19:32–19:37 |
| BR3 | 1.76 | N | 11:10–11:15 | 17:32–17:37 | 19:32–19:37 | |
| BA2 | 0.36 | N | 11:20–11:25 | 17:32–17:37 | 19:32–19:37 | |
| H2 | 3.26 | N | 11:50–11:55 | 17:32–17:37 | 19:32–19:37 | |
| K2 | 1.76 | N | 11:30–11:35 | 17:32–17:37 | 19:32–19:37 | |
| BR4 | 1.76 | S | 11:40–11:45 | 17:32–17:37 | 19:32–19:37 | |
| 3 | AS | – | – | – | – | – |
4.2.1. Weekday
Grandparents on the first floor get up at 08:00 h. Breakfast is from 08:30 to 09:00 h, lunch is from 15:00 to 16:00 h, while dinner is from 19:00 to 19:30 h (Fig. 14 ). By 09:30 h they spend time in the living room LR, after which they get ready for bed (Fig. 15 ). This means that they are in bedroom BR1 from 10:30 h. Grandparents generally spend time together, except when grandma washes laundry, irons, or cleans the first floor rooms.
Fig. 14.
Schedule for using the kitchen K1 during all days for Scenario S2.
Fig. 15.
Schedule for using the bathroom BA1 during all days for Scenario S2.
For the family members on the second floor, mom, dad and son keep the responsibilities from the scenario S1. The daughter sleeps a little longer (Fig. 16 ), and later devotes herself to housework while mom and dad are at work and their son is at school. Lunch time is 16:30 h and dinner is 19:00 h (Fig. 17 ). The time between meals is generally spent by everyone in their rooms.
Fig. 16.
Schedule for using the bedroom BR2 during weekdays for Scenario S2.
Fig. 17.
Schedule for using the kitchen K2 during weekdays for Scenario S2.
4.2.2. Weekend
On weekends, mother and father have breakfast from 08:30 to 09:00 h. Children sleep longer (until 09:45 h) so that they have breakfast separately from their parents from 10:15 to 10:45 (Fig. 18 ). They all have lunch from 16:00 to 17:00 h, and dinner from 20:00 to 20:30 h. As mentioned above, a restraining order was introduced on weekends, so all family members spend time at home in various ways (resting, talking, reading, studying), but with less socializing.
Fig. 18.
Schedule for using the kitchen K2 during weekends for Scenario S2.
4.3. Scenario S3
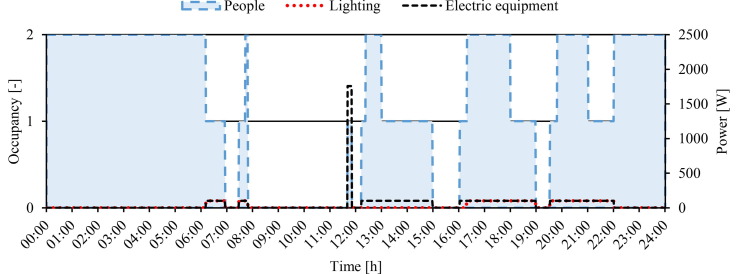
In this case, even more drastic measures were taken by the state, which included the closure of kindergartens, schools and colleges, while part-time or four-hour working hours were foreseen for persons in employment. After 13:00 h, the ban on moving and leaving homes that applies to everyone comes into force. On weekends, as in the previous scenario, a one-day travel ban applies. It is easy to conclude that in this scenario the first floor schedule is the same as in the previous scenario, whereas the changes in behavior occur only on the second floor, i.e. in the part of the house where the younger family members live. Fig. 19, Fig. 20, Fig. 21 show schedules for the kitchen K2 and for the bedrooms BR2 and BR4 valid on weekdays.
Fig. 19.
Schedule for using the kitchen K2 during weekdays for Scenario S3.
Fig. 20.
Schedule for using the bedroom BR2 during weekdays for Scenario S3.
Fig. 21.
Schedule for using the bedroom BR4 during weekdays for Scenario S3.
4.4. Scenario S4
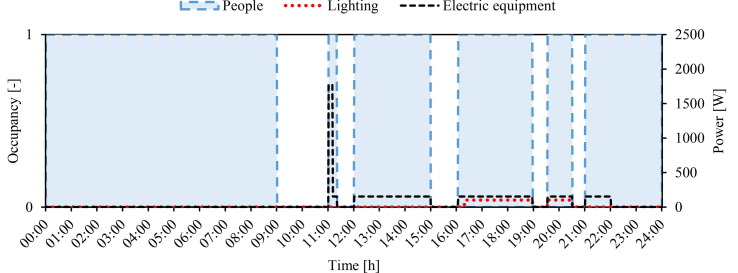
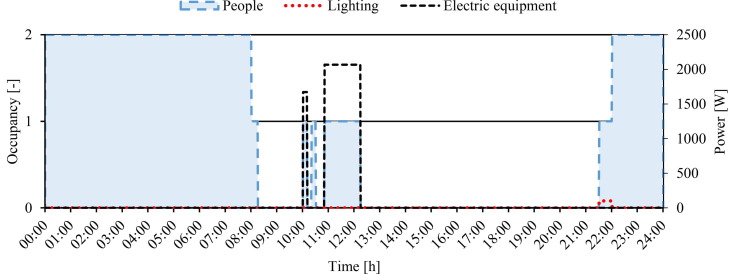
This scenario involves a total ban on movement, which is put in place in the most drastic and most dangerous situations for human health. In this case, only one person is allowed to leave the house once a week for a period of 2 h to go to the store (Thursday is assumed in this scenario). Hygiene is still very important, as is ventilation. Inhabitants try to spend as little time together as possible. Schools and colleges do not work. The same applies to other companies and institutions. The days are monotonous, so the family spends a lot of time reading, watching TV and in other leisure activites. Fig. 22, Fig. 23 show schedules for the bedrooms BR1 and BR3, which are now valid throughout the week.
Fig. 22.
Schedule for using the bedroom BR1 during all days for Scenario S4..
Fig. 23.
Schedule for using the bedroom BR3 during all days for Scenario S4..
5. Results and discussion
5.1. Energy-ecological indicators of the city of Kragujevac
5.1.1. District heating system
The characteristics of the city district heating system during the month of March for the last three years (2018–2020) are presented in Tables 10 , while Table 11 shows energy consumption corresponding to the delivered quantities of thermal energy to user (housing sector – RS, non-residential sector – NRS) during the same period.
Table 10.
Characteristics of the district heating system during the month of March on the territory of the city of Kragujevac [32], [33].
| Month | Year | tA [°C] | HDD [°C·day] |
NDHS-tot [–] |
VDHS-tot [m3] |
QDHS-tot [MWh] |
|||
|---|---|---|---|---|---|---|---|---|---|
| RS | NRS* | RS | NRS | RS | NRS | ||||
| March | 2018 | 6.6 | 415 | 20,327 | 1125 | 2,762,942 | 1,233,372 | 22,853 | 11,329 |
| 2019 | 9.1 | 338 | 20,478 | 1123 | 2,778,745 | 1,174,907 | 19,834 | 8,698 | |
| 2020 | 7.6 | 384 | 20,560 | 1103 | 2,757,433 | 1,179,292 | 23,709 | 10,067 | |
Public buildings (schools, kindergartens, social and health institutions, shopping-malls, theatres, cinemas, museums, etc.), industrial facilities, etc.
Table 11.
Monthly energy consumption of the district heating system on the territory of the city of Kragujevac [32].
| Month | Year | Natural gas [Sm3] | Coal [t] | Fuel oil [kg] | Electricity [kWh] |
|---|---|---|---|---|---|
| March | 2018 | 537,932 | 14,125 | 1,212,460 | 2,221,870 |
| 2019 | 538,744 | 10,122 | 840,400 | 1,871,489 | |
| 2020 | 907,230 | 12,903 | 723,380 | 2,121,321 |
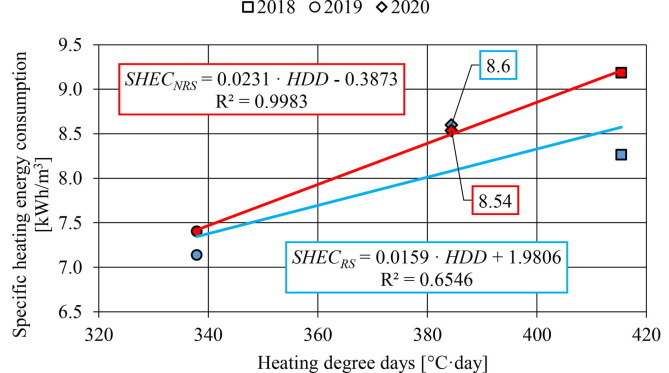
Functional dependence between specific heat consumption (QDHS-tot/VDHS-tot ratio) and the degree of the heating day (blue line – RS, red line – NRS) in the district heating system in the city of Kragujevac during March for the last three years (2018–2020) is shown in Fig. 24 .
Fig. 24.
Monthly consumption of thermal energy depending on the heating degree days and the type of user on the territory of the city of Kragujevac.
In Fig. 24. it can be noticed that the monthly specific consumption of thermal energy in the non-residential sector is higher than the monthly specific consumption of thermal energy in the residential sector: 2018 (for 0.92 kWh/m3 of heated space), 2019 (for 0.27 kWh/m3 of heated space). Unlike previous years, in March 2020 there was a discontinuity in the specific heat consumption (as evidenced by the coefficient of determination for the equation describing the specific heat consumption in the residential sector R 2 = 0.6546, i.e. heat consumption in the residential sector was much higher than anticipated), precisely because of the COVID-19 virus pandemic and the implemented precautionary measures (Table 8), due to which the monthly specific heat consumption in the residential sector was 60 Wh/m3 of heated space higher than in the non-residential sector.
5.1.2. The natural gas supply system
Consumption of the natural gas during the month of March in the past three years (2018–2020) according to the type of user is shown in Table 12 .
Table 12.
Monthly consumption of natural gas according to the type of user on the territory of the city of Kragujevac [34].
| Month | Year |
NNGSS-tot [–] |
VNGSS-tot [Sm3] |
||
|---|---|---|---|---|---|
| RS | NRS | RS | NRS | ||
| March | 2018 | 9405 | 287 | 1,751,239 | 498,344 |
| 2019 | 9821 | 309 | 1,225,597 | 336,131 | |
| 2020 | 10,280 | * | 1,506,298 | * | |
Data were unavailable at the time of their collection due to technical problems with distributors.
The specific consumption of natural gas in the residential sector during March 2018 was 186.2 Sm3/connection. In 2019, this value was 124.79 Sm3/connection, and during the epidemic in March 2020, 146.53 Sm3/connection. The specific consumption of natural gas in the non-residential sector during the same period was: 2018 (1736 Sm3/connection), 2019 (1087.8 Sm3/connection), while for 2020 these data were not available at the time of their collection (Table 12). If the consumption of natural gas in the housing sector during of March 2020 is compared with the same periods from 2019 and 2018, it can be concluded that in the first case it was higher by 12.79%, and in the second lower by 27.08%. This phenomenon can be explained by a significant difference in the mean daily temperature during the month of March in the analyzed period (tA).
5.1.3. Power distribution system
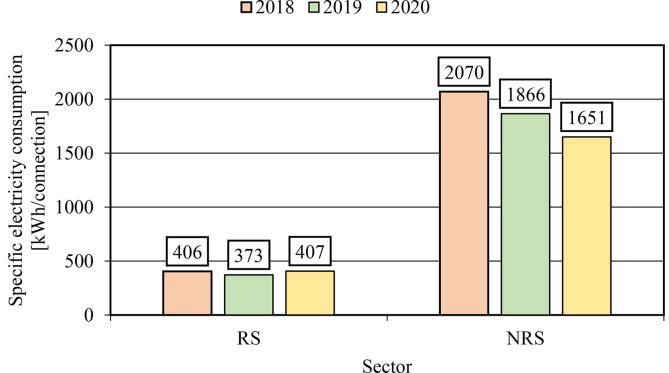
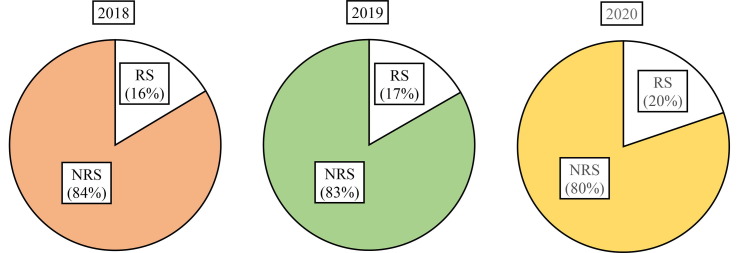
Considering that people during the pandemic spent most of their time in their homes during of March 2020 (Table 8), the specific consumption of electricity in the housing sector (Table 13 ) was higher compared to the same period in 2018 (for 1.62 kWh/connection), and 2019 (by 33.91 kWh/connection), which is, in percentage terms, higher by 0.25% compared to 2018 and 8.34% compared to 2019. Specific electricity consumption in the non-residential sector (Table 13) during March 2020 was lower compared to the same period in 2018 (by 419 kWh/connection, i.e. by 25.38%) and in 2019 (by 214.75 kWh/connection, i.e. by 13.03%). If we look at the total specific electricity consumption at the level of the entire city, it can be concluded that in March 2020 it was the lowest, and amounted to 2058.14 kWh/connection (Fig. 25 ), which can be attributed to a large share of the non-residential sector in electricity consumption. Due to all the above, the percentage share of RS in the total electricity consumption on the territory of the city of Kragujevac, during the mentioned period, increased from year to year (Fig. 26 ).
Table 13.
Monthly electricity consumption according to the type of user on the territory of the city of Kragujevac [35].
| Month | Year |
NE-tot [–] |
QE-tot [kWh] |
||
|---|---|---|---|---|---|
| RS | NRS | RS | NRS | ||
| March | 2018 | 74,755 | 9034 | 30,327,222 | 18,698,822 |
| 2019 | 75,044 | 9229 | 28,021,417 | 17,217,409 | |
| 2020 | 75322 | 9502 | 30,679,385 | 15,68,6146 | |
Fig. 25.
Monthly specific electricity consumption according to the type of user on the territory of the city of Kragujevac.
Fig. 26.
The Percentage share of RS in the total electricity consumption during March in the territory of the city of Kragujevac for the period 2018–2020.
5.1.4. Water supply system
Water consumption on the territory of the city of Kragujevac according to the type of user is shown in Table 14 .
Table 14.
Monthly water consumption according to the type of user on the territory of the city of Kragujevac [36].
| Month | Year |
NW-tot [–] |
VW-tot [m3] |
||
|---|---|---|---|---|---|
| RS* | NRS* | RS | NRS | ||
| March | 2018 | * | * | 612898 | 207,131 |
| 2019 | * | * | 627071 | 185,072 | |
| 2020 | 64000 | 1080 | 653,476 | 188,089 | |
Data were unavailable at the time of their collection due to technical problems with distributors.
The total water consumption on the territory of the city of Kragujevac in March 2018 was 820,029 m3. In March 2019 total water consumption at the city level was 812,143 m3, while in March 2020 during the COVID-19 virus pandemic it was 841,565 m3. Specific water consumption in March 2010 in the residential sector was 10.21 m3/connection, and in the same period in the non-residential sector 174.16 m3/connection. The rise in water consumption during March 2020 can be attributed to the increased presence of people in their households.
5.1.5. Quality of air
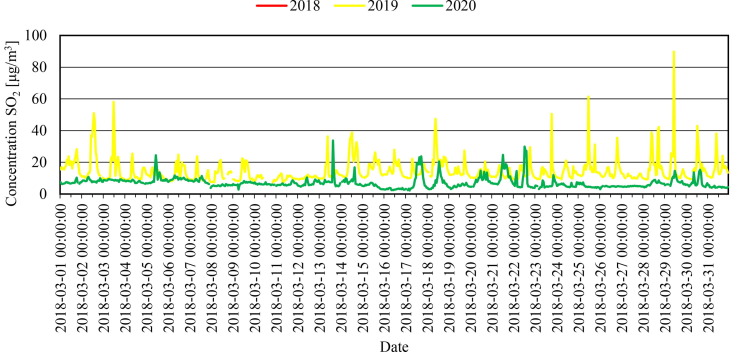
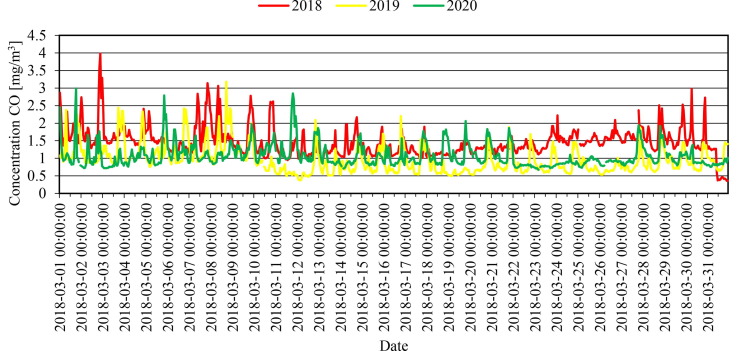
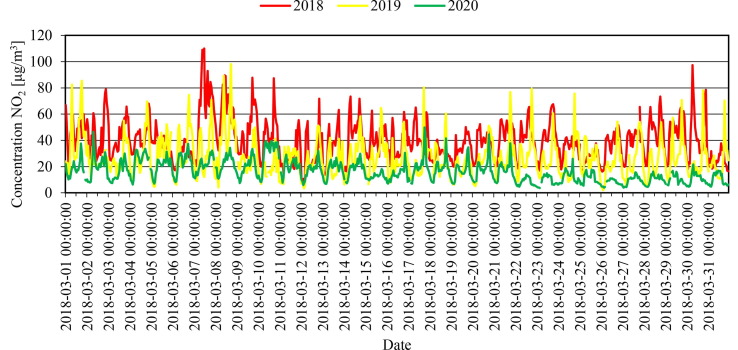
Due to the protection measures adopted by the Government of the Republic of Serbia in March 2020 (Table 8), which affected energy consumption and traffic intensity, as well as the fact that in March 2019, the average daily temperature was higher than the same period in 2018 and 2020 (Table 10), air quality on the territory of the city of Kragujevac in March 2019 and 2020 it significantly improved compared to March 2018, as evidenced by the diagrams of concentrations of SO2 (Fig. 27 ), CO (Fig. 28 ) and NO2 (Fig. 29 ).
Fig. 27.
Hourly SO2 concentrations during March [37]. * Due to the malfunction of the equipment, the concentration of SO2 was not measured during March 2018.
Fig. 28.
Hourly CO concentrations during March [37].
Fig. 29.
Hourly NO2 concentrations during March [37].
5.2. The numerical model of a case study
5.2.1. Final and primary energy consumption and carbon dioxide emissions
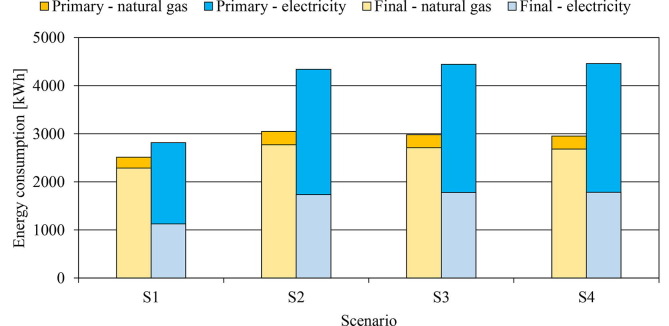
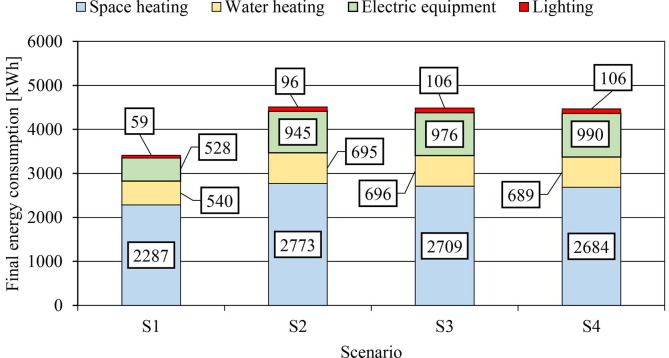
Fig. 30 shows the final and primary energy consumption in the analyzed house during the month of March 2020 for all 4 scenarios examined. The energy needed for space heating (thermal energy) originates from natural gas, while electricity is used for heating water, operating electrical equipment and lighting. The final (thermal) energy consumption for space heating is the lowest in S1 (2287 kWh), which is understandable, since the presence of the house residents is lower compared to the other analyzed scenarios Moreover, the radiators in BR2 and K2 are switched off. With the introduction of mild measures in S2 (social distancing of the elderly, the daughter returning from the college, additional ventilation, hygiene measures, etc.), the consumption of thermal energy is increased to 2773 kWh (by 21%). S3 shows a slight decrease compared to S2 (by 64 kWh). The reason lies in the greater involvement of the electrical equipment due to the ban on movement of people after 13:00 h, which further leads to an increase of thermal gains coming from the electrical equipment. It is easy to conclude that the thermal gains are highest in S4, when a complete ban on movement is introduced, which directly affects the final energy consumption for heating, which in this case is the smallest and amounts to 2684 kWh, consuming 281 Sm3 of natural gas [34].
Fig. 30.
Monthly final and primary energy consumption in the analyzed house.
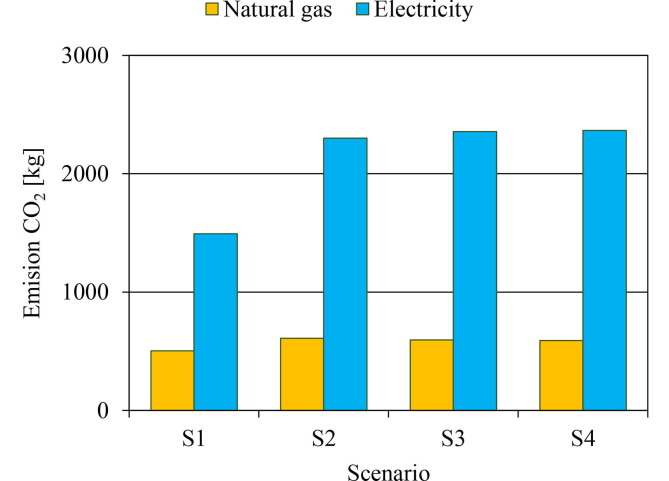
In terms of electricity consumption, it is steadily increasing with the introduction of new measures, and is equal to 1127 kWh (S1), 1736 kWh (S2), 1778 kWh (S3), and 1785 kWh (S4). If, according to the recommendations in [27], it is assumed that R(B-GB)pry = 1.1 and R(BE)pry = 2.5, it can be concluded that the primary energy consumption for space heating is the highest in S2 (3051 kWh), and for operation of electrical appliances in S4 (4463 kWh). In addition to the final and primary energy consumption, CO2 emissions are also a very important energy and environmental indicator of the sustainability of the housing sector. If it is adopted that e(B-GB)CO2 = 0.2 kg/kWh and e(B-E)CO2 = 0.53 kg/kWh [27], the highest CO2 emission is in S4, i.e., 2956 kg (Fig. 31 ).
Fig. 31.
Monthly CO2 emission from the analyzed house.
In the total final energy consumption balance, the electricity accounts for 33% (lighting 2%, electrical equipment 15%, hot water preparation 16%), and the heating originating in natural gas for 67% (S1). Although the thermal energy consumption is higher by 486 kWh in S2, its share is 62%, because, on the other hand, electricity consumption jumped by 54%, mainly due to the operation of electrical equipment, which now has a share of 21% (945 kWh). Domestic hot water consumption increased by 155 kWh due to more family members being present in the house at the same time, but its share decreased by 1% due to a smaller growth gradient. The final energy consumption of S3 and S4 is the same in the percentage terms, with the consumption of thermal energy decreasing and the consumption of electricity increasing (Fig. 30, Fig. 32 ).
Fig. 32.
Monthly final energy consumption in the analyzed house by type of end-user.
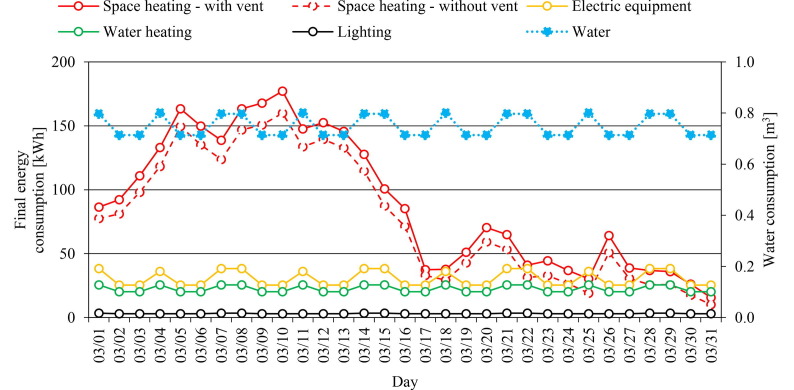
Fig. 33 shows the daily final energy consumption (as well as water consumption from city water supply in the S2 analyzed house during the month of March 2020. The energy consumption in the second half of March diminishes due to the higher outdoor temperatures.
Fig. 33.
Daily consumption of final energy and water in the S2 analyzed house.
5.2.2. Space heating system
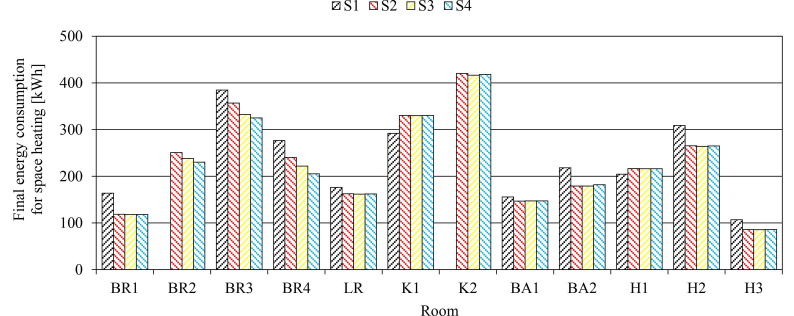
Fig. 34 shows the consumption of heat by the premises during March in the analyzed house. As already mentioned, heating of BR2 and K2 is not included in S1, so the thermal energy consumption is the highest in the adjacent rooms: BR3 (358 kWh), H2 (309 kWh) and BR4 (277 kWh). The thermal energy consumption in K1 is 292 kWh due to the large air change (Table 4). The S2 brings with it a change in work habits. The grandparents were isolated from the rest of the family, and the daughter returned home from college. The first floor and the second floor function independently of each other. Heat consumption is highest in the following zones: K2 (420 kWh), BR3 (357 kWh), and K1 (330 kWh). The thermal energy consumption in BR2 is 251 kWh.
Fig. 34.
Monthly thermal energy consumption at the premises in the analyzed house.
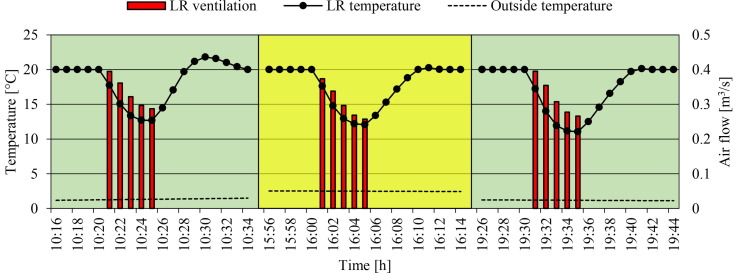
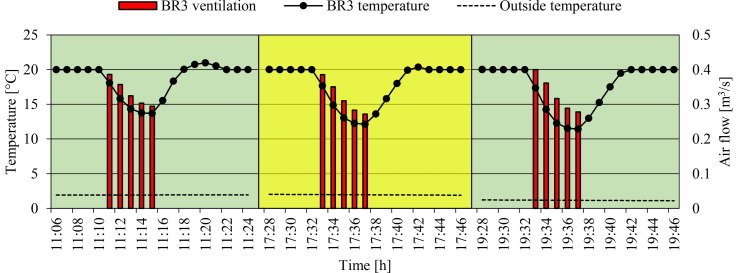
In the diagram of Fig. 34 it can be observed (when S1 is compared with S2) that the heat consumption in BR1 is reduced by 45 kWh. The same applies to the following rooms: BR3 (from 385 kWh to 357 kWh), BR4 (from 277 kWh to 240 kWh), LR (from 176 kWh to 162 kWh), BA1 (from 156 kWh to 147 kWh), BA2 (with 218 kWh at 179 kWh), H2 (from 309 kWh at 265 kWh) and H3 (from 107 kWh to 86 kWh). The reason for this is precisely the heating of rooms BR2 and K2, which is why the internal temperatures in the adjacent rooms are now much higher (looking from rooms adjacent to BR2 and K2), and that is in line with the results presented in [38]. Fig. 34 also shows that heat consumption in K1 and H1 increased by 38 kWh and 12 kWh, respectively. Namely, in K1 there are now only two people (Fig. 14), so the thermal gains from people, lighting and operation of electrical equipment are now smaller, and they have to be offset by the additional work of heaters. The same applies to the H1, because there is almost no retention in that room. The consumption of thermal energy in the premises is greatly influenced by the additional ventilation that is performed daily, according to the schedule determined in Table 9. Due to the above measure proposed by the health authorities of the Republic of Serbia, the final energy consumption in S2 is higher by 15%. Fig. 35 shows the change in internal temperature in the LR during its ventilation on March 5, whereas Fig. 36 shows the change in internal temperature in BR3 during its ventilation on the same day. After the introduction of the measures from S3, the thermal energy consumption in the rooms is (see Fig. 34): BR1 (118 kWh), BR2 (238 kWh), BR3 (332 kWh), BR4 (222 kWh), LR (162 kWh), K1 (330 kWh), K2 (416 kWh), BA1 (147 kWh), BA2 (179 kWh), H1 (216 kWh), H2 (264 kWh), H3 (86 kWh). If we compare S3 with S2, in terms of percentages, the average energy savings per room is about 2%. If there was no additional ventilation, this savings would be as high as 18%. In the most rigorous measures (S4), thermal energy consumption would further decline in BR1 (from 238 kWh to 230 kWh), BR2 (332 kWh to 325 kWh), BR3 (from 221 kWh to 205 kWh). On the other hand, heat consumption increases in K2 (from 416 kWh to 418 kWh) and in BA2 (from 179 kWh to 182 kWh). Looking at Fig. 19, it can be seen that 2 people are involved in preparing lunch (mother and daughter together), whereas in S4 this is not the case (only one person allowed in the kitchen when preparing a meal). As S4 implies a total movement ban, less attention is paid tohand hygiene, resulting in less frequent use of the upstairs BA2. Compared to S1, heat consumption in S4 increased about 15%. Compared to S2, a savings of 3% is achieved, and compared to S3, this savings is 1%.
Fig. 35.
Indoor temperature variations in the living room LR during its ventilation (S2, March 5).
Fig. 36.
Indoor temperature variations in the bedroom BR3 during its ventilation (S2, March 5).
5.2.3. Electrical equipment
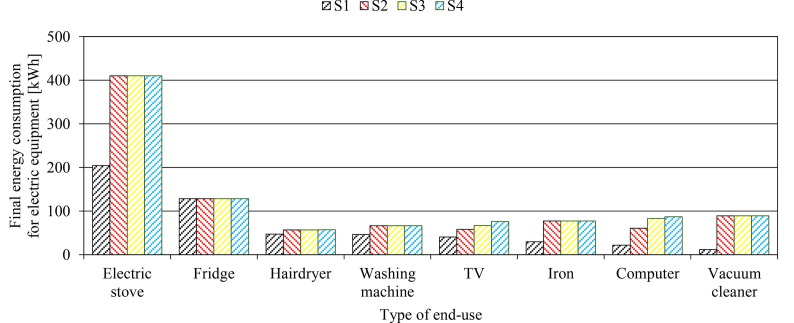
The results showed that in all the scenarios analyzed, the electric stoves consume the most electricity (Fig. 37 ). Only one electric stove is used in S1, the one on the first floor, which is why this electrical equipment consumes 204 kWh per month. In S2, S3, S4 both electric stoves are engaged, so their total consumption is 410 kWh per month. The hairdryer in S1 consumes 47 kWh, this consumption being further increased by about 10 kWh due to the larger number of people in S2, S3 and S4. Washing machine (46 kWh), ironing (30 kWh) and vacuum cleaner (11 kWh) make up 16% of S1′s electricity consumption. In this scenario, washing machine is used twice a week (Saturday and Sunday), and ironing and vacuuming is done once a week. In S2, S3 and S4, washing machine is used 3 times a week (66 kWh), the same applies for ironing (77 kWh), while vacuum cleaning is performed daily (89 kWh). Depending on the scenario analyzed, televisions and computers together contribute to this consumption as follows: S1 (62 kWh), S2 (118 kWh), S3 (149 kWh), S4 (162 kWh).
Fig. 37.
Monthly electricity consumption for operation of electrical equipment in the analyzed house by type of end-user.
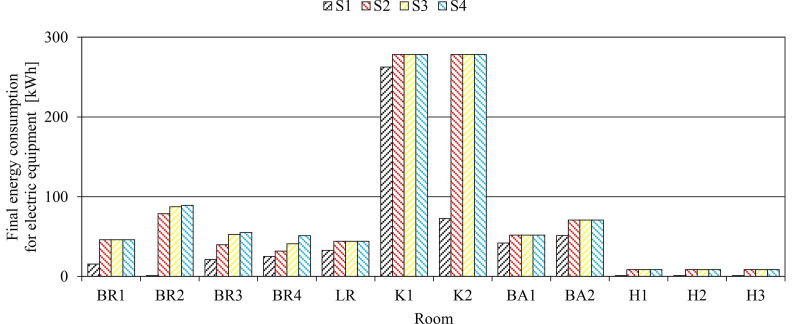
The consumption of electricity for the operation of electrical equipment in the premises of the analyzed house is shown in Fig. 38 . Taking into account Fig. 37, it can be easily concluded that K1 and K2 contribute most to this consumption. Their share in S1 is 64%, while in the following scenarios it decreases as the usage of other electrical equipment in other premises is increasing. So their share in S2 is 59%, in S3 is 57%, while in S4 it is the smallest (56%). Next to K1 and K2 is BR2 with the consumption of electricity in the S4 amouting to 89 kWh. These are followed by bathrooms with the following consumption in S4: BA1 (52 kWh), BA2 (71 kWh). Fig. 38 shows that since the other electrical equipment is not used in the corridors, except for the vacuum cleaners, the consumption of electricity in these rooms is reasonably minimal.
Fig. 38.
Monthly electricity consumption for the operation of electrical equipment at the premises in the analyzed house.
5.2.4. Water supply network
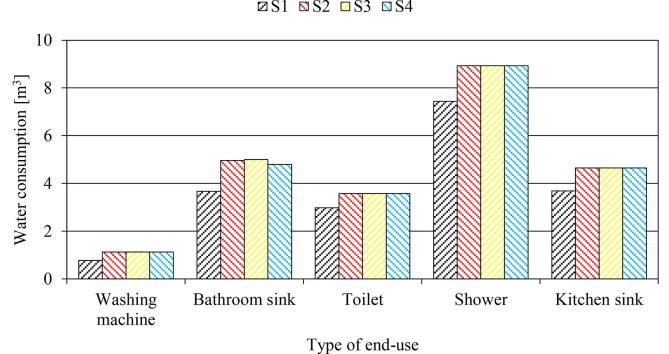
The water in the analyzed house is consumed according to the needs of the households defined in Table 7. Monthly water consumption varies depending on the analyzed scenario as follows: S1 (18.55 m3), S2 (23.23 m3), S3 (23.27 m3) and S4 (23.07 m3). In other words, the average monthly consumption of water per household member is: S1 (3.71 m3), S2 (3.87 m3), S3 (3.88 m3) and S4 (3.84 m3). Fig. 39 shows the water consumption according to the type of end-user.
Fig. 39.
Monthly water consumption in the analyzed house by type of end-user.
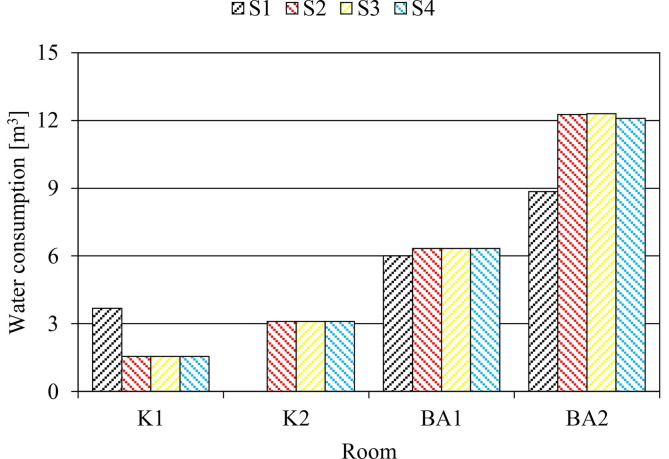
For the operation of washing machines in BA1 and BA2 (S1), 780 L of water is consumed per month, or 44.33 L per cycle. For one cycle with prewashing with the washing machine it takes 2.5 h, with a water temperature of 60 °C (Table 7). For drinking and storing food, the monthly consumption of water is 3.68 m3, which means that one person daily consumes on average 23.74 L. The highest amount of water per month is consumed for eight-minute showers (7.44 m3). Bathrom sinks in BA1 and BA2 contribute to this consumption with a share of 3.67 m3 per month. Finally, using the toilet, the monthly consumption is 2.98 m3 higher. As the S2 washing machine is used 3 times a week, the monthly water consumption increases by 350 L compared to S1. This trend persists in the scenarios S3 and S4. Shower cabins (8.93 m3), toilets (3.57 m3) and sinks (4.65 m3) in S2 require more consumption due to the presence of an additional family member, which means that in S2 water is consumed in the same amounts as in S3 and S4. The highest fluctuations in water consumption are observed when using the washbasins in BA1 and BA2, mainly due to the maintenance of hand hygiene. The daily consumption of water per person in S1, S2 and S3 is 23.67 L, 26.68 L, 26.89 L, respectively. The consumption increases and this is due to longer hand washing than usual. On the other hand, in S4 it can be noticed that there is a discontinuity in consumption and that the daily water consumption per person is 25.8 L, which is less than in S2 and S3. The reason for the reduced water consumption is reflected in the introduced ban on the movement of people, which means that there is no washing of hands when entering the house from outside. Fig. 40 shows the monthly water consumption by the premises in the analyzed house. If a parallel is drawn with Fig. 39, it is easy to deduce why the water consumption in BA2 is the highest and with the highest oscillations. Fig. 40 shows that water consumption in K1 is higher in S1 (3.7 m3) than in other scenarios (1.5 m3), which is explained by the non-use of K2 in S1.
Fig. 40.
Monthly water consumption at the premises in the analyzed house.
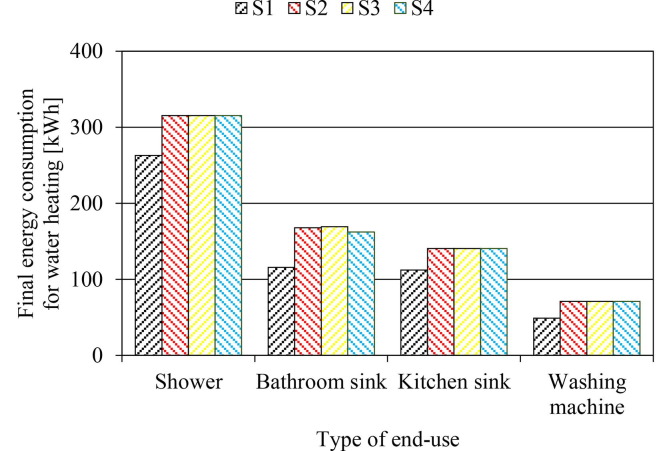
The monthly consumption of electricity for the preparation of hot water (Table 7) in the analyzed house according to the type of end-user is shown in Fig. 40. Fig. 41 shows the monthly consumption of electricity for the preparation of hot water in the premises in the analyzed house.
Fig. 41.
Monthly electricity consumption for preparation of hot water at the premises in the analyzed house.
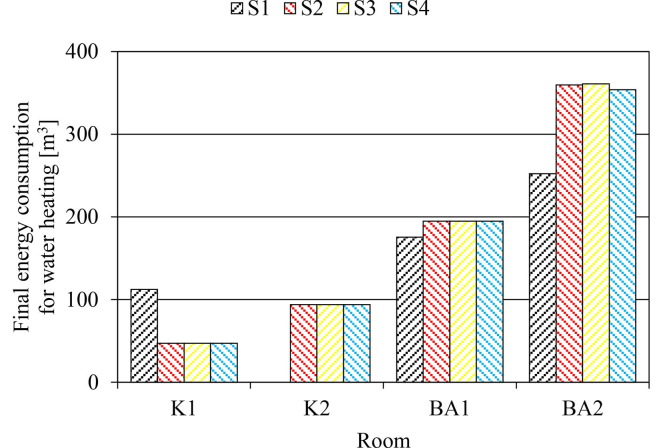
The consumption of electricity for hot water preparation follows the consumption of water itself, which is why there is a similarity between Fig. 39, Fig. 41, and between Fig. 40, Fig. 42 . Monthly electricity consumption when using shower cabins in BA1 and BA2 is the lowest in S1 (263 kWh), while in S2, S3 and S4 it is 315 kWh. The use of washbasins in BA1 and BA2 contributes with 116 kWh (S1), 168 kWh (S2), 169 kWh (S3) and 162 kWh (S4) to this consumption. The trend that applies to the use of shower cabins, also applies to the use of sinks (K1, K2) and washing machines (BA1, BA2). Therefore, the sink in K1 (S1) consumes 112 kWh of electricity, whereas the sinks in K1 and K2 together consume 141 kWh in S2, S3 and S4. Washing machines in BA1 and BA2 together consume 49 kWh in S1 and 71 kWh in S2, S3 and S4, respectively. Viewed by premises (Fig. 42), the consumption of electricity for the preparation of hot water is the highest in BA2: 252 kWh (S1), 360 kWh (S2), 361 kWh (S3) and 354 kWh (S4). Then follows the consumption in BA2, while the least amount of electricity is consumed for the preparation of hot water in K1: 112 kWh (S1), 47 kWh (S2, S3, S4).
Fig. 42.
Monthly electricity consumption for preparation of hot water in the premises of the analyzed house.
5.2.5. Validation of results and economic analysis
Table 15 shows the specific consumption of natural gas, electricity and water (per person), as well as CO2 emissions, during March 2020. The same table shows the actual consumption of these energy sources obtained on the basis of paid invoices.
Table 15.
Validation of energy consumption in the analyzed house during March.
| Parameter | Unit | S1 | S2 | S3 | S4 | Actual consumption |
|---|---|---|---|---|---|---|
| Building occupancy | [–] | 5 | 6 | 6 | 6 | 6 |
| Natural gas | [Sm3/person] | 47.82 | 48.33 | 47.22 | 46.77 | 43.36 |
| Electricity | [kWh/person] | 225.37 | 289.35 | 296.37 | 297.51 | 236.22 |
| Water | [m3/person] | 3.71 | 3.87 | 3.88 | 3.84 | 3.75 |
| CO2 | [kg/person] | 399.23 | 485.08 | 492.04 | 492.61 | – |
Based on Table 15, Table 16 and 16 it can be seen that the actual consumption of natural gas is lower than predicted from S1 (by 4.46 Sm3/person). Actual electricity consumption per person is higher than electricity consumption from S1 (by 4.59%) and lower than consumption from S2 (by 22.49%). There are also differences between actual and projected water consumption, with actual water consumption being 1.07% higher than projected consumption in S1 (3.71 m3/person) and 3.2% lower than projected in S2 (3.87 m3/person) in analyzed house.
Table 16.
Percentage differences between actual and projected energy consumption in the analyzed house during March.
| Parameter | Unit | S1 | S2 | S3 | S4 | Actual consumption |
|---|---|---|---|---|---|---|
| Natural gas | [Sm3/person] | +10.29% | +11.46% | +8.9% | +7.86% | 43.36 |
| Electricity | [kWh/person] | −4.59% | +22.49% | +25.47% | +25.95% | 236.22 |
| Water | [m3/person] | −1.07% | +3.2% | +3.47% | +2.4% | 3.75 |
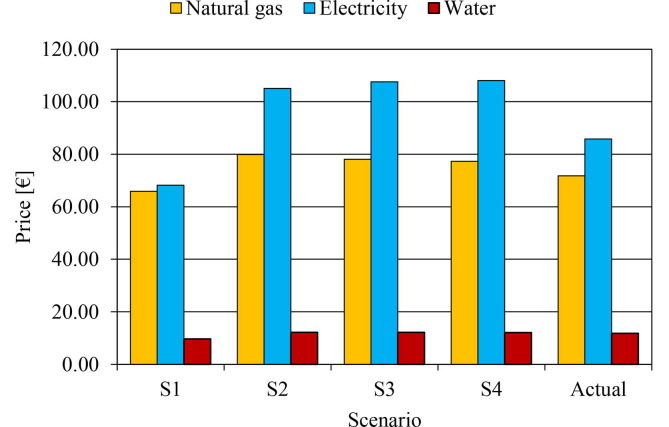
Fig. 43 shows that the largest funds are allocated in S3 (total 197.84 €). It is followed by: S4 (197.41 €), S2 (197.11 €) and S1 (143.77 €) [34], [35], [36], [40]. The costs of natural gas are the most expensive in S2 (65.88 €), electricity in S4 (108.03 €), and water in S3 (12.16 €). As a percentage compared to scenario S1, in scenario S2 27.07% more money is allocated, in scenario S3 27.33% more money is allocated, while in scenario S4 27.17% more money is allocated. Actual cash costs in March 2020 according to the respective distributors are in order: natural gas (71.74 €), electricity (85.82 €) and water (11.76 €). As a percentage, total monetary costs to distributors of relevant services are 15.09% higher than in S1 and 16.41% lower than in S2.
Fig. 43.
Monthly energy costs depending on the examined scenario in the analyzed house.
6. Conclusion
The goal of this study was to investigate the impact of changes in human behavior caused by the COVID-19 outbreak on the energy consumption in a household. The study assessed real-life scenarios reflecting the measures put in place in March 2020 by the government of the Republic of Serbia. A typical Serbian household was analyzed. The results showed a significant impact of the behavior of the household residents on the final energy consumption during the analyzed period. The final energy consumption for heating in normal conditions before declaring the state of emergency (the reference scenario S1) was 3414 kWh. Because of the measures put in place and analyzed in scenarios S2, S3, and S4, the final energy consumption increased to 4509 kWh, 4487 kWh i 4465 kWh, respectively. The measures taken during the state of emergency had as a result an increased presence of residents in their households, which further lead to an increase of energy consumption used for heating. On the other hand, this increased presence of the residents led to an increased usage of electrical equipment, which in turn significantly increased the thermal gains. This is the reason for a diminished energy consumption used for heating in Scenario S3. This effect would be more considerable in case the scenario was analyzed during the summer. Moreover, a repeated state of emergency in colder months of the year (December and January) would also lead to a higher energy consumption used for heating than in the observed period of time. The consumption of natural gas in the analyzed house during March, depending on the examined scenario, was in order: S1 (2287 kWh), S2 (2773 kWh), S3 (2710 kWh), S4 (2684 kWh). The electricity consumption in normal conditions, before declaring the state of emergency (the reference scenario S1) was 1127 kWh. Because of the measures put in place and analyzed in scenarios S2, S3, and S4, the electricity consumption increased to 1736 kWh, 1778 kWh and 1785 kWh, respectively. This increase was in proportion to the presence of the household residents. The first set of measures led to the most significant increase in consumption (54.04%), whereas with the followup measures the consumption additionally increased by 3.73% (S3 with respect to S2) and by 0.62% (S4 with respect to S3). A similar situation can be observed in the consumption of hot water because of the increased hygiene measures. The first set of measures led to the highest increase in the hot water consumption (25.23%) in the scenario S2, whereas the fluctuations in the hot water consumption were significantly smaller in the other scenarios (about 1%). On the other hand, the actual energy consumption in the analyzed house (at the level of the entire building) during the month of March 2020 was in order: natural gas (260.36 Sm3, 11.38% less than in S3), electricity (1418 kWh, 20.53% more than in S1, i.e., by 22.43% less than in S2) and water (22.5 m3, by 17.56% more than in S1, by 3.24% less than in S2). The economic analysis showed that the largest funds were allocated in S3 (197.84 €, or 27.33% more than in S1). Total actual costs according to the respective distributions were higher by 15.09% in relation to S1, i.e. by 16.41% lower than in S2. The measures taken during the state of emergency had as a result an increased presence of residents in their households, which further lead to an increase of energy consumption used for heating. On the other hand, this increased presence of the residents led to an increased usage of electrical equipment, which in turn significantly increased the thermal gains. This is the reason for a diminished energy consumption used for heating in scenarios S3 and S4. This effect would be more considerable in case the scenario was analyzed during the winter. Moreover, a repeated state of emergency in colder months of the year (December and January) would also lead to a higher energy consumption used for heating than in the observed period of time.
CRediT authorship contribution statement
Dragan Cvetković: Conceptualization, Methodology, Supervision. Aleksandar Nešović: Writing - original draft, Software. Ivana Terzić: .
Declaration of Competing Interest
The authors declare that they have no known competing financial interests or personal relationships that could have appeared to influence the work reported in this paper.
Acknowledgment
This work was created thanks to public companies that submitted data related to heat consumption (ENERGETIKA DOO – operational distribution centre in Kragujevac), natural gas consumption (SRBIJAGAS – operational distribution centre in Kragujevac), electricity consumption (EPS – operational distribution centre in Kragujevac) and water consumption (WATER SUPPLY AND SEWERAGE – operational distribution centre in Kragujevac). We would also like to thank the SERBIAN NATIONAL NETWORK OF AUTOMATIC STATIONS FOR AIR QUALITY MONITORING for the submitted data concerning air quality in the territory of the city of Kragujevac in the analyzed period.
Footnotes
Supplementary data to this article can be found online at https://doi.org/10.1016/j.enbuild.2020.110532.
Appendix A. Supplementary data
The following are the Supplementary data to this article:
References
- 1.EUROSTAT, Final energy consumption by sector, <https://ec.europa.eu>.
- 2.Swan Lukas G., Ismet Ugursal V., Beausoleil-Morrison Ian. Occupant related household energy consumption in Canada: estimation using a bottom-up neural-network technique. Energy Build. 2011;43(2–3):326–337. [Google Scholar]
- 3.Zhun Y.u., Fung B.C.M., Haghighat F., Yoshino H., Morofsky E. A systematic procedure to study the influence of occupant behavior on building energy consumption. Energy Build. 2011;43(6):1409–1417. [Google Scholar]
- 4.Hong Tianzhen, Taylor-Lange Sarah C., D’Oca Simona, Yan Da, Corgnati Stefano P. Advances in research and applications of energy-related occupant behavior in buildings. Energy Build. 2016;116:694–702. [Google Scholar]
- 5.Nelson Fumo M.A., Biswas Rafe. Regression analysis for prediction of residential energy consumption. Renewable Sustainable Energy Rev. 2015;47:332–343. [Google Scholar]
- 6.Aydinalp Merih, Ismet Ugursal V., Fung Alan S. Modeling of the space and domestic hot-water heating energy-consumption in the residential sector using neural networks. Appl. Energy. 2004;79(2):159–178. [Google Scholar]
- 7.Aitken C.K., Mcmahon T.A., Wearing A.J., Finlayson B.L. Residential water use: predicting and reducing consumption. J. Appl. Soc. Psychol. 1994;24(2):136–158. [Google Scholar]
- 8.Ren Zhengen, Chan Wan Yee, Wang Xiaoming, Anticev Julia, Cook Stephen, Chen Dong. An integrated approach to modelling end-use energy and water consumption of Australian households. Sustainable Cities Soc. 2016;26:344–353. [Google Scholar]
- 9.Diao L., Sun Y., Chen Z., Chen J. Modeling energy consumption in residential buildings: a bottom-up analysis based on occupant behavior pattern clustering and stochastic simulation. Energy Build. 2017;147(15):47–66. [Google Scholar]
- 10.Beccali M., Cellura M., Lo Brano V., Marvuglia A. Short-term prediction of household electricity consumption: assessing weather sensitivity in a Mediterranean area. Renewable Sustainable Energy Rev. 2008;12(8):2040–2065. [Google Scholar]
- 11.Santin Olivia Guerra, Itard Laure, Visscher Henk. The effect of occupancy and building characteristics on energy use for space and water heating in Dutch residential stock. Energy Build. 2009;41(11):1223–1232. [Google Scholar]
- 12.Brounen D., Kok N., Quigley J.M. Residential energy use and conservation: economics and demographics. Eur. Econ. Rev. 2012;56(5):931–945. [Google Scholar]
- 13.Valentina Fabi, Rune Vinther Andersen, Stefano Paolo Corgnati, Bjarne W. Olesen, Marco Filippi, Description of occupant behavior in building energy simulation: State-of-art and concepts for improvements, in: Proceedings of Building Simulation 2011, 12th Conference of International Building Performance Simulation Association, Sydney, 14-16 November.
- 14.C. Chen and D. J. Cook, Behavior-based home energy prediction, in: 2012 Eighth International Conference on Intelligent Environments, Guanajuato, 2012, pp. 57–63, 10.1109/IE.2012.44. [DOI]
- 15.Shan H.u., Yan D.a., Guo S., Cui Y., Dong B. A survey on energy consumption and energy usage behavior of households and residential building in urban China. Energy Build. 2017;148:366–378. [Google Scholar]
- 16.Chen J., Wang X., Steemers K. A statistical analysis of a residential energy consumption survey study in Hangzhou, China. Energy Build. 2013;66:193–202. [Google Scholar]
- 17.Ren Z., Paevere P., Mc Namara Cheryl. A local-community-level, physically-based model of end-use energy consumption by Australian housing stock. Energy Policy. 2012;49:586–596. [Google Scholar]
- 18.Heinonen J., Junnila S. Residential energy consumption patterns and the overall housing energy requirements of urban and rural households in Finland. Energy Build. 2014;76:295–303. [Google Scholar]
- 19.Al-Mumin A., Khattab O., Sridhar G. Occupants’ behavior and activity patterns influencing the energy consumption in the Kuwaiti residences. Energy Build. 2003;35(6):549–559. [Google Scholar]
- 20.de Meester T., Marique A.-F., De Herde A., Reiter S. Impacts of occupant behaviours on residential heating consumption for detached houses in a temperate climate in the northern part of Europe. Energy Build. 2013;57:313–323. [Google Scholar]
- 21.Shimoda Y., Asahi T., Taniguchi A., Mizuno M. Evaluation of city-scale impact of residential energy conservation measures using the detailed end-use simulation model. Energy. 2007;32(9):1617–1633. [Google Scholar]
- 22.B.J. Johnson, M.R. Starke, O.A. Abdelaziz, R.K. Jackson, L.M. Tolbert, A method for modeling household occupant behavior to simulate residential energy consumption. ISGT 2014, Washington, DC, 2014, pp. 1–5, 10.1109/ISGT.2014.6816483. [DOI]
- 23.Fred Van Raaij W., Verhallen Theo M.M. A behavioral model of residential energy use. J. Econ. Psychol. 1983;3(1):39–63. [Google Scholar]
- 24.Zhao Dong, McCoy Andrew P., Jing Du., Agee Philip, Yujie Lu. Interaction effects of building technology and resident behavior on energy consumption in residential buildings. Energy Build. 2017;134:223–233. [Google Scholar]
- 25.Motuziene Violeta, Vilutiene Tatjana. Modelling the effect of the domestic occupancy profiles on predicted energy demand of the energy efficient house. Procedia Eng. 2013;57:798–807. [Google Scholar]
- 26.Lawrence Berkeley National Laboratory Simulation Research Group, <http://simulationresearch.lbl.gov> Date: May 24, 2012.
- 27.Пpaвилник o eнepгeтcкoj eфикacнocти згpaдa, Зaкoн o плaниpaњy и изгpaдњи Peпyбликe Cpбиje 2011 (Rulebook on energy efficiency of buildings, Law on Planning and Construction of the Republic of Serbia 2011), <http://www.ingkomora.org.rs/strucniispiti/download/ee/PRAVILNIK_O_EEZ_za%20obuku.pdf> (accessed on Jun. 2019).
- 28.EnergyPlus, Intup Output Reference.
- 29.M. Raonic, Vodovod i kanalizacija u zgradama – obnovljeno izdanje (Water supply and sewerage in buildings), Croatiaknjiga, Zagreb, 2003.
- 30.Crawley D., Lawrie L., Pedersen C., Winkelmann F. EnergyPlus: energy simulation program. ASHRAE J. Online. 2000;42:49–56. [Google Scholar]
- 31.Governement of the Republic of Serbia, <https://www.srbija.gov.rs>.
- 32.Energetika DOO Kragujevac, <http://www.energetika-kragujevac.com>.
- 33.Republic Hydrometeorogical Service of Serbia, <http://www.hidmet.gov.rs/index_eng.php>.
- 34.Srbijagas, <http://www.srbijagas.com>.
- 35.Serbian electric power – electrical distribution, <http://www.epsdistribucija.rs>.
- 36.Public utility company water supply and sewerage kragujevac, <http://jkpvik-kg.com>.
- 37.Serbian National Network of Automatic Stations for Air Quality Monitoring, <http://www.amskv.sepa.gov.rs>.
- 38.Lukić N., Nikolić N., Timotijević S., Tasić S. Influence of an unheated apartment on the heating consumption of residential building considering current regulations – Case of Serbia. Energy Build. 2017;155:16–24. [Google Scholar]
- 40.Exchange rate list of the National Bank of the Republic of Serbia, <https://www.nbs.rs>.
Associated Data
This section collects any data citations, data availability statements, or supplementary materials included in this article.


