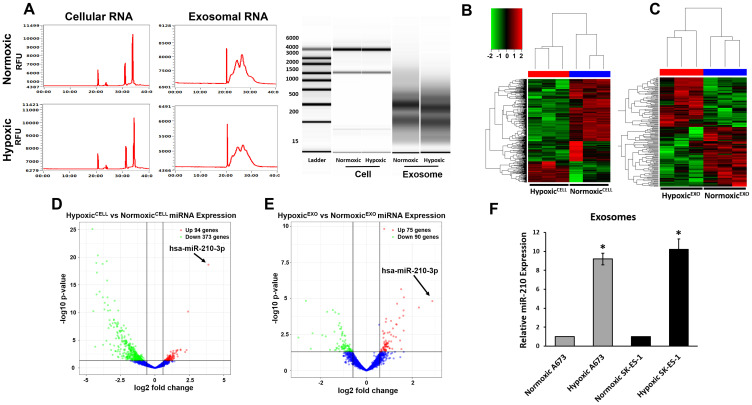
Figure 2. EWS HypoxicEXO carry specific hypoxia regulated miRNA.
(A) Representative electropherogram profile of total RNA in normoxic and hypoxic SK-ES-1 cells and exosomes. Ribosomal subunits 28S and 18S were observed in cellular RNA profiles and were absent in exosomal RNA. Unsupervised cluster analysis of SK-ES-1 miRNAs in (B) normoxic and hypoxic cells and (C) NormoxicEXO and HypoxicEXO. Each column represents a biological replicate and every row denotes an individual miRNA. The Z-score color scale indicates high expression represented by red ranging to low expression denoted by green. Volcano plot of miRNA differentially expressed (≥ 1.5 fold threshold) in SK-ES-1 (D) normoxic compared to hypoxic cells and (E) HypoxicEXO compared to NormoxicEXO. Significance (-log10 p-value) was plotted versus fold change (log2 fold change) along the y and x axis, respectively. (F) Validation of hypoxia regulated miRNAs miR-210 A673 and SK-ES-1 NormoxicEXO and HypoxicEXO using qRT-PCR (Mean ± SEM, n = 3, * P ≤ 0.05). miR-16 was used as a control to normalize miRNA expression.

