Abstract
Sheep milk and related products have been growing in popularity around the world in recent years. However, the sheep milk industry is limited by low milk yield, and the molecular regulators of ovine lactation remain largely unknown. To investigate the transcriptomic basis of sheep lactation, RNA-Sequencing was used to explore the expression profiles of lncRNA and mRNA of the mammary gland in Hu sheep at three key time points during the lactation stage: 5 days before the expected date of parturition perinatal period (PP), 6 days after parturition early lactation (EL), and 25 days after parturition peak lactation (PL). A total of 1111, 688, and 54 differentially expressed (DE) lncRNAs as well as 1360, 660, and 17 DE mRNAs were detected in the EL vs PP, PL vs PP, and PL vs EL comparisons, respectively. Several prominent mRNAs (e.g., CSN1S1, CSN1S2, PAEP, CSN2, CSN3, and COL3A1) and lncRNAs (e.g., LNC_018483, LNC_005678, LNC_012936, and LNC_004856) were identified. Functional enrichment analysis revealed that several DE mRNAs and target genes of DE lncRNAs were involved in lactation-related pathways, such as MAPK, PPAR, and ECM–receptor interaction. This study enhances our understanding of how transcriptomic profiles change during the lactation period and pave the way for future studies examining sheep lactation.
Keywords: sheep, lactation, lncRNA, mRNA, RNA-Seq
Introduction
Given that one of the major challenges of the milk industry is dietary structure and nutritional diversity, there is a constant need for milk producers to improve milk products to meet the diverse demands of consumers. These demands have included milk with higher nutritional content in addition to sheep milk and related products, as sheep milk is richer in fat, protein, lactose, vitamins, and trace elements compared with cow and goat milk (Suarez-Vega et al., 2017; Balthazar et al., 2019). However, the sheep milk industry is limited by the low milk yield of sheep. The production of milk is a complex trait regulated by several biological processes and shows moderate heritability (Marti et al., 2013; Banos et al., 2019); therefore, the use of genomic selection to improve the selection of milk traits has become increasingly important for the sheep milk industry.
With the rapid growth in RNA-Sequencing (RNA-Seq) technologies, transcriptomic approaches have become widely used to understand complex traits, such as reproductive traits (Zhang et al., 2019), milk traits (Billa et al., 2019), and muscle growth (Xiang et al., 2018), and have increased our understanding of non-coding RNAs (ncRNAs). Among ncRNAs, long non-coding RNAs (lncRNAs), which were previously considered junk RNAs, have been found to be involved in individual neurodevelopment (Zhang et al., 2020), cell cycle regulation (Luo et al., 2020), and cancer (Wang et al., 2018; Chen et al., 2019). For example, Yoon et al. (2012) found that lincRNA p21 can directly inhibit the translation of Jun B and CTNNB1. lncRNA SNHG6 can regulate cell proliferation by participating in the translation and splicing of microRNAs (miRNAs) in cancer (Meng et al., 2019).
In addition, lncRNAs can act as competitive endogenous RNAs (ceRNAs) to affect the expression of mRNAs (Xu et al., 2020). Growing evidence has revealed that lncRNAs can both directly and indirectly regulate mRNAs. Hence, the role of lncRNAs and mRNAs in various important biological processes has received increased attention by researchers. For example, Ma et al. (2018) profiled mRNA and lncRNA expression in sheep that differed in the deposition of fat in their tails and identified several DE mRNAs and lncRNAs, suggesting that they may play crucial roles in the deposition of tail fat. Ji et al. (2020) characterized the mRNA and lncRNA expression profiles in dairy goats from different lactation periods and found that the expression of lncRNAs was tied to mammary gland development and lactation. However, little comparative research of the lncRNAs and mRNAs in sheep lactation has been conducted. In addition, how lncRNAs and mRNAs interact during sheep lactation has not been characterized.
Hu sheep, a Chinese native sheep breed, have drawn much attention for their excellent lactation performance and high prolificacy (two births per year, 2–3 lambs per birth, Lv et al., 2019); therefore, Hu sheep provide an ideal animal model for dairy sheep breeding. However, the molecular mechanism underlying lactation in sheep is largely unknown, yet elucidating this molecular mechanism is important for increasing our knowledge of sheep lactation. Considering the essential role that mammary glands play in lactation (Azagra-Boronat et al., 2020; Hooper et al., 2020), we extracted mammary gland biopsies from Hu sheep during three key time points of lactation (PP, EL, and PL) and used RNA-Seq to study the expression profiles of lncRNAs and mRNAs. Our study improves our understanding of the potential roles of lncRNAs and mRNAs during lactation and promises to aid more in-depth studies on the breeding of dairy sheep.
Materials and Methods
Sample Collection
All experimental sheep were kept under similar conditions and fed at Zhenjiang Wan Shan Hong Bian Agricultural Co., Ltd. (Zhenjiang, Jiangsu Province, China) with detailed litter records. A total of 10 first-time pregnant ewes close to their pregnancy date were selected for sampling. Approximately 1.5-g mammary gland parenchyma biopsies were extracted from each ewe by surgical biopsy at three key points during the lactation period: 5 days before the expected date of parturition PP, 6 days after parturition (EL), and 25 days after parturition (PL) according to the lactation curve of Hu sheep (Li et al., 2015). Mammary gland biopsies were snap-frozen in liquid nitrogen and stored at −80°C. Mammary gland biopsies of three ewes with the same litter size were then selected for RNA extraction.
All of the aforementioned experimental procedures were approved by the Experimental Animal Welfare and Ethics Institute of Animal Science, Yangzhou University. Generally, all efforts were taken to minimize pain and discomfort to animals while conducting these experiments.
RNA Extraction and Transcriptome Sequencing
RNA was extracted from the mammary gland biopsies with TRIzol reagent per the manufacturer’s instructions. The quality of isolated RNA was examined using an RNA Nano 6000 Assay Kit, and RNA integrity Number (RIN) was checked by Agilent 2100 bioanalyzer as the threshold of RIN ≥ 8.0.
An Epicenter Ribo-ZeroTM Kit was used to remove rRNA, and the lncRNA library was constructed using the NEBNext® UltraTM RNA Library Prep Kit for Illumina® per the manufacturer’s instructions, followed by dilution of the lncRNA library to a concentration of 1 ng/μL. For mRNA sequencing, total RNA was firstly poly-A-selected followed by fragmentation of RNA into small pieces. The cleaved RNA fragments were reverse transcribed to cDNA and ligated with Illumina adapters using the NEBNext® UltraTM RNA Library Prep Kit for Illumina® per the manufacturer’s instructions. The libraries were then fractionated on agarose gel; short fragments (approximately 200 bp in length) were excised and amplified by PCR. Finally, the RNA libraries were sequenced on PE150 strategy (pair end 150 bp) using Illumina HiSeqTM 2500 by Beijing Novogene Technology Co., Ltd.
Processing of Reads
Raw reads were obtained in the FASTQ format. They were arranged according to the number of reads, base amount, and Q30/20 (the proportion of read bases whose error rate is less than 0.1/1%). Among the raw reads that were generated by sequencing, low-quality reads that included adapters, reads that contained N (wherein the proportion of bases that could not be identified >10%), and low-quality reads (base with sQ ≤ 5 accounts for more than 50% of the entire reads, those with quality scores < Q20) were removed. Clean reads were then obtained and mapped to the Ovis aries reference genome (Oar_v4.0) using HISAT2 (Kim et al., 2015); StringTie (Pertea et al., 2015) was used to assemble the transcripts of mRNAs.
Coding and non-coding RNA candidates from the transcripts were distinguished with Coding-Non-Coding-Index (CNCI, Sun et al., 2013), coded potential calculator-2 (CPC2, Kong et al., 2007), and Pfam-scan (PFAM, El-Gebali et al., 2019) software after transcriptome assembly. Non-coding RNA candidates with lengths >200 nt, and exon numbers ≥2 were identified as candidate lncRNAs.
Analyses of Differential Expression
The expected number of Fragments Per Kilobase of transcript sequence per Million fragments sequenced (FPKM, Trapnell et al., 2010) was used to estimate the expression levels of candidate lncRNA and mRNA transcripts; transcripts were used for the subsequent analysis as the threshold of FPKM ≥ 0.5. Multiple comparisons were conducted to identify differentially expressed (DE) lncRNAs and DE mRNAs among the PP, EL, and PL groups using DEseq (Wang et al., 2010). lncRNAs and mRNAs were considered significantly DE as the threshold of | log2Foldchange| >1 and q-value (p-values adjusted by Benjamini and Hochberg’s approach) <0.05.
Target Gene Prediction and DE Interaction Network Analysis
To better understand lncRNA function, we identified predicted cis- and trans-target genes. Coding genes located 100 kb upstream and downstream of the corresponding lncRNAs were considered cis-target genes. In addition, we calculated Pearson correlation coefficients between the expression level of coding genes and corresponding lncRNAs. Coding genes were considered trans-target genes if the | correlation| ≥ 0.95.
Based on the target gene prediction, the interactions between DE lncRNAs and DE mRNAs were used to construct the DE interaction network using Cytoscape v3.7.2 software (Shannon et al., 2003).
Gene Ontology (GO) and Kyoto Encyclopedia of Genes and Genomes (KEGG) Enrichment
Genes were functionally annotated using the DE mRNAs and target genes of the DE lncRNAs based on the results of the DE analysis and the predicted target genes. GOseq R library (Young et al., 2010) and KOBAS (KO-Based Annotation System, Xie et al., 2011) programs were used for GO enrichment and KEGG pathway enrichment analyses, respectively. The number of genes enriched in GO and KEGG was determined, followed by a Fisher’s exact test with a false discovery rate (FDR) multiple test correction to assess statistical significance (P < 0.05).
Validation of Sequencing Data
Six DE mRNAs and six DE lncRNAs were randomly selected. The housekeeping gene RPL-19 was selected as the reference gene, the sequences of the selected lncRNAs are shown in Supplementary Table S1, and the primers were designed using Primer Premier 5 software (Supplementary Table S1).
Total RNA was extracted from the mammary gland biopsies from three ewes processed for RNA-Seq using a total RNA extraction kit for animal tissue. TRIzol was used to dissolve the mammary gland biopsies. The quantity and quality of total RNA were monitored using 1.5% agarose gel electrophoresis (U = 150 V;10 min) and ultraviolet spectrophotometry, respectively. The A260/280 ratios (1.8–2.0) of the RNA samples were all 1.9 to 2.0, which showed that the extracted total RNA was of acceptable purity with no contamination or degradation. Therefore, the RNA preparations were deemed fit for use in the follow-up experiments, and so were stored at -80°C until use.
The first strand of cDNA was prepared using a PrimeScriptTM RT Reagent Kit per the manufacturer’s instructions. The PCR thermocycler program was as follows: 37°C for 15 min, followed by 85°C for 5 s. The reaction mixture contained 1.0 μL PrimeScript RT Enzyme, 1.0 μL random 6-mers, 4.0 μL 5 × PrimeScript Buffer (for Real Time), 1.0 μL total RNA, and 13 μL RNase-free ddH2O (total volume, 20 μL). Prior to storage at -80°C, the standard working concentration of cDNA was 200 ng/μL. The quality of cDNA was evaluated by housekeeping gene amplification, and cDNA were stored at -20°C until use.
Real-time quantitative polymerase chain reaction (RT-qPCR) was performed with cDNA in triplicate to validate the reliability of sequencing data following the SYBR Green I method. RT-qPCR conditions were as follows: 1 cycle of 95°C for 15 min, followed by 40 cycles of 95°C for 10 s and 60°C for 30 s. The dissociation curve was analyzed after amplification. The melting temperature (Tm) peak observed at 65–95°C on the dissociation curve was used to determine the specificity of the PCR amplification.
The 2–Δ Δ Ct method (Livak and Schmittgen, 2001) was used to calculate the relative expression level. The results were shown as the fold change of relative expression level (mean ± standard error of the mean) using GraphPad Prism 6 software.
Results
Overview of the Sequencing Data
The average numbers of raw reads of each group were 119,203,825 (PP), 103,187,784 (EL), and 103,117,901 (PL); the average numbers of clean reads of each group were 116,442,803 (PP), 100,365,485 (EL), and 99,916,856 (PL); and the average mapping rates of PP, EL, and PL were 81.71, 83.23, and 80.03%, respectively. Details are shown in Table 1.
TABLE 1.
Summary of the sequencing data.
| Sample name | Raw reads | Clean reads | Clean bases | Error rate (%) | Q20 (%) | Q30 (%) | GC content (%) |
| EL1 | 85,892,976 | 83,397,464 | 12.51G | 0.02 | 98.21 | 94.87 | 54.23 |
| EL2 | 122,553,262 | 119,604,884 | 17.94G | 0.02 | 97.62 | 93.42 | 54.86 |
| EL3 | 101,117,114 | 98,094,108 | 14.71G | 0.02 | 97.75 | 93.45 | 52.16 |
| PL1 | 81,546,644 | 79,336,108 | 11.9G | 0.02 | 98.09 | 94.62 | 55.07 |
| PL2 | 93,928,750 | 91,352,292 | 13.7G | 0.02 | 97.8 | 93.7 | 54.9 |
| PL3 | 133,878,310 | 129,062,170 | 19.36G | 0.02 | 95.43 | 89.94 | 53.57 |
| PP1 | 123,985,202 | 121,100,554 | 18.17G | 0.02 | 97.63 | 93.63 | 53.62 |
| PP2 | 127,128,826 | 124,208,970 | 18.63G | 0.02 | 98.41 | 95.14 | 54.89 |
| PP3 | 106,497,448 | 104,018,886 | 15.6G | 0.02 | 97.44 | 93.14 | 52.96 |
EL, PL, and PP represent early lactation, peak lactation, and perinatal period, respectively. Error rate% represents average error rate of sequencing of the single base.
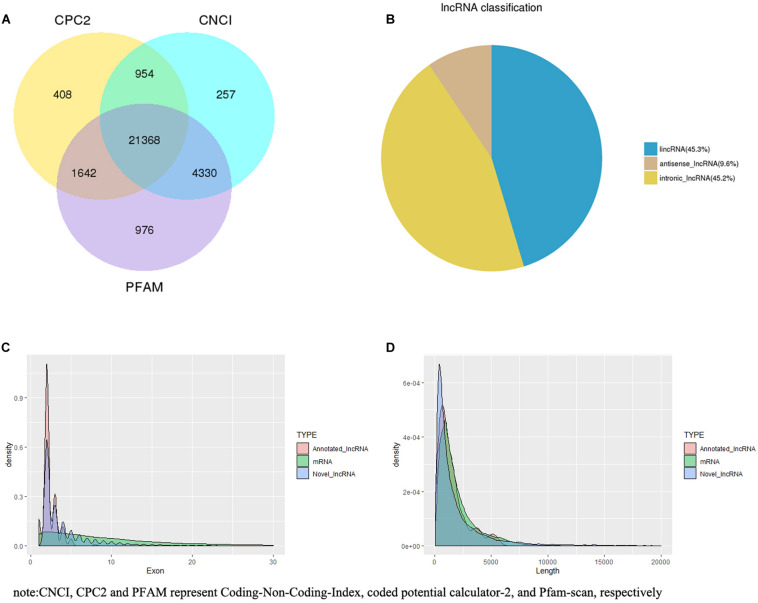
Based on CPC2, CNCI, and PFAM, 21,368 novel lncRNAs were identified (Figure 1A), within which 45.27, 45.18, and 9.55% were identified as lincRNA, intronic lncRNA, and antisense lncRNA, respectively (Figure 1B). Additionally, 240 annotated lncRNAs and 22,823 mRNAs were detected. Overall, 21,608 lncRNAs (21,368 novel lncRNAs and 240 annotated lncRNAs) and 22,823 mRNAs were screened for in-depth analyses.
FIGURE 1.
lncRNA filter/classification and exon/length distribution of identified lncRNAs and mRNAs. (A) Filter of identified lncRNAs. (B) Classification of identified lncRNAs. (C) Exon number distribution of identified lncRNAs and mRNAs. (D) Length distribution of identified lncRNAs and mRNAs.
Most of the lncRNAs had two or three exons (2.32 on average), which was markedly fewer than the number of exons in mRNAs (10.06 on average) (Figure 1C). The length of the lncRNAs was primarily between 200 and 1,000 nt, and the average length was 2,164.41 nt. The length of mRNAs was primarily distributed within the range of 500–3,000 bp, and the average length was 1,992.07 bp (Figure 1D).
Expression Profiles of lncRNAs and mRNAs
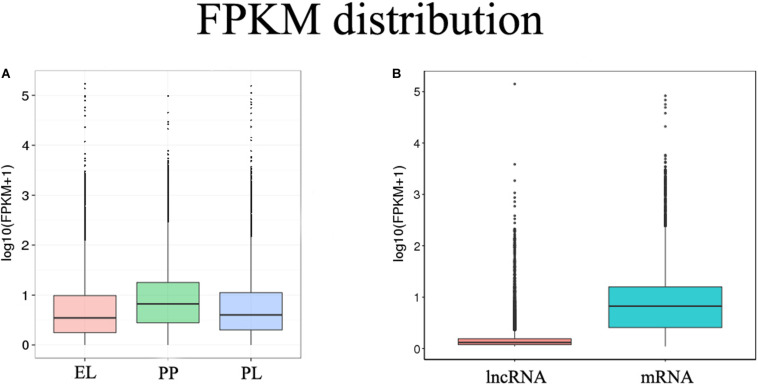
FPKM was performed to estimate the expression levels of lncRNAs and mRNAs. mRNA had a significantly higher expression level than lncRNA (q < 0.01), and the expression of mRNA was higher during the PP than during the EL and PL (Figure 2).
FIGURE 2.
FPKM distribution. (A) FPKM distribution of different groups. (B) FPKM distribution of identified lncRNAs and mRNAs.
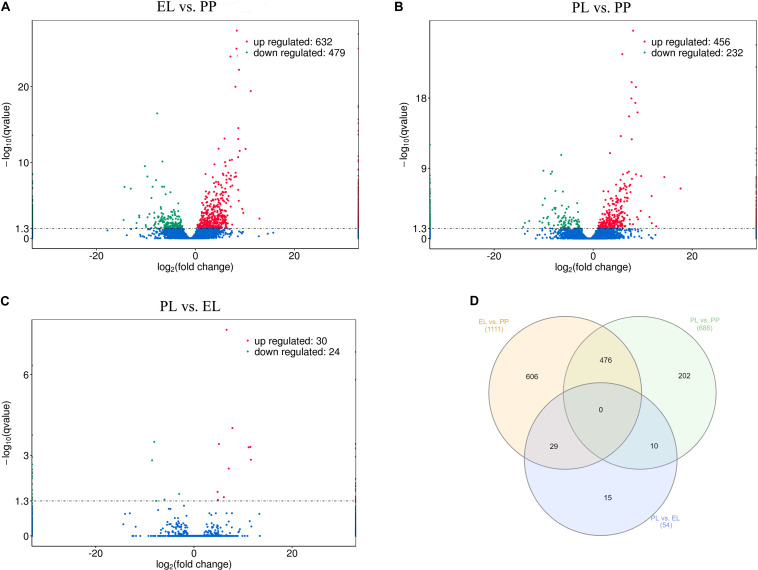
DEseq was conducted based on FPKM to study DE lncRNAs and DE mRNAs. A total of 1111, 688, and 54 DE lncRNAs were detected in EL vs PP (Figure 3A), PL vs PP (Figure 3B), and PL vs EL (Figure 3C), respectively. The Venn diagrams of the DE lncRNAs between different comparison groups are shown in Figure 3D. Details are provided in Supplementary Table S2.
FIGURE 3.
Differentially expressed (DE) lncRNAs. (A) Volcano plot of differentially expressed lncRNAs in early lactation (EL) vs perinatal period (PP), where red and green represent upregulation or downregulation, respectively, same below. (B) Volcano plot of DE lncRNAs in peak lactation (PL) vs PP. (C) Volcano plot of DE lncRNAs in PL vs EL. (D) Venn diagram of DE lncRNAs, where orange, green, and blue represent EL vs PP, PL vs PP, and PL vs EL, respectively.
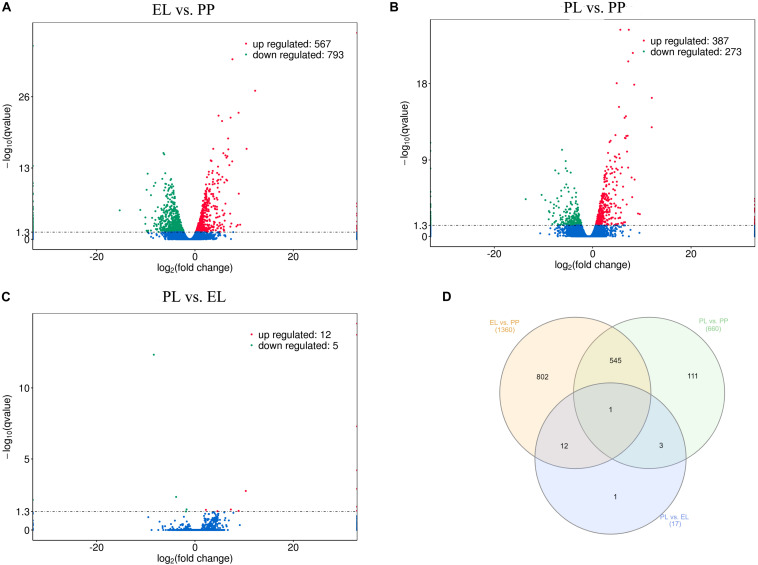
A total of 1360, 660, and 17 DE mRNAs were detected in EL vs PP (Figure 4A), PL vs PP (Figure 4B), and PL vs EL (Figure 4C), respectively. The Venn diagrams of the DE mRNAs between different comparison groups are shown in Figure 4D. COL3A1 (ENSOART00000017961) was DE in all three comparisons. Details are provided in Supplementary Table S2.
FIGURE 4.
Differentially expressed (DE) mRNAs. (A) Volcano plot of DE mRNAs in early lactation (EL) vs perinatal period (PP). (B) Volcano plot of DE mRNAs in peak lactation (PL) vs PP. (C) Volcano plot of DE mRNAs in PL vs EL. (D) Venn diagram of DE mRNAs.
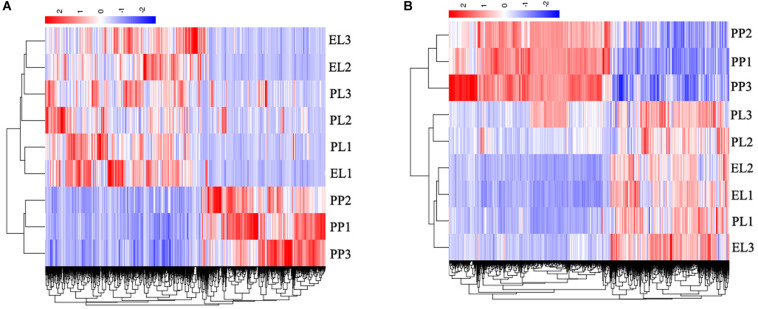
The heat maps of DE lncRNAs (Figure 5A) and DE mRNAs (Figure 5B) revealed different expression patterns between PP and lactation period (EL and PL); however, the difference between EL and PL was not significant.
FIGURE 5.
Heatmap of differentially expressed (DE) lncRNAs (A) and DE mRNAs (B).
Target Gene Prediction and DE Interaction Network Analysis
Overall, 19, 153 cis-target genes of 19,129 corresponding lncRNAs and 15, 462 trans-target genes of 5,443 corresponding lncRNAs were predicted. Based on the DE analysis and the mRNA transcripts of genes, a total of 546 DE lncRNAs were found to cis-regulate 430 DE mRNAs, and 290 DE lncRNAs were found to trans-regulate 1,105 DE mRNAs (Supplementary Table S3). The DE interaction network was built on DE lncRNA–DE mRNA interactions. Furthermore, the number of connections of each candidate was quantified. Among DE lncRNAs, the top three most connected (lncRNA with the highest number of connections between corresponding mRNA) were LNC_005678 (212), LNC_012936 (201), and LNC_004856 (197); among DE mRNAs, the top three most connected (mRNA with the highest number of connections between corresponding lncRNA) were ENSOART00000000850 (CRABP1, 23), ENSOART00000018937 (22), and ENSOART00000017132 (DCN, 21). The high-resolution DE interaction network is shown in Supplementary Figure S1.
GO and KEGG Enrichment Analyses
GO and KEGG enrichment analyses were conducted using the DE mRNAs and target genes of the DE lncRNAs.
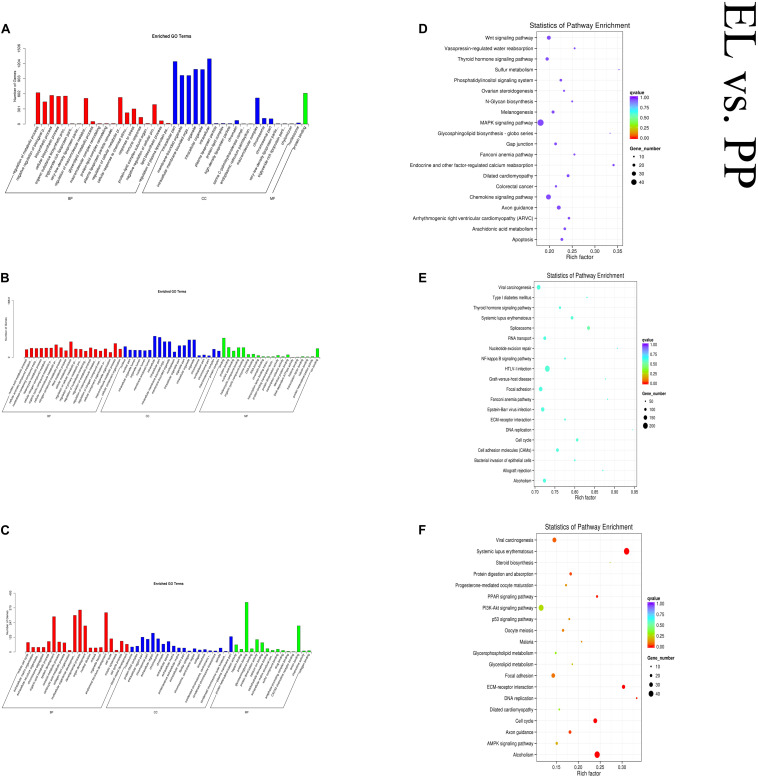
In the EL vs PP comparison, DE mRNAs were significantly enriched in 166 GO terms. The top enriched GO terms were mitotic cell cycle (GO:0000278), nucleosome (GO:0000786), and protein heterodimerization activity (GO:0046982) in biological process (BP), cellular component (CC), and molecular function (MF), respectively. The cis-target genes of the DE lncRNAs were significantly enriched in 56 GO terms. The top enriched GO terms were regulation of metabolic process (GO:0019222), intracellular part (GO:0044424), and protein binding (GO:0005515) in BP, CC, and MF, respectively. The trans-target genes of the DE lncRNAs were significantly enriched in 762 GO terms. The top enriched GO terms were nucleic acid metabolic process (GO:0090304), nucleus (GO:0005634), and binding (GO:0005488) in BP, CC, and MF, respectively. DE mRNAs were significantly enriched in 31 KEGG pathways. The cis-target genes of the DE lncRNAs were significantly enriched in 15 KEGG pathways. The trans-target genes of the DE lncRNAs were significantly enriched in 22 KEGG pathways, within which pathways related to lactation were enriched, such as cell cycle (oas04110) and PPAR (oas03320). Figure 6 shows some of the top enriched GO terms and KEGG pathways, and the details are provided in Supplementary Table S4.
FIGURE 6.
Top annotated GO terms of cis-target genes (A) and trans-target genes (B) of differentially expressed (DE) lncRNAs and DE mRNAs (C) and top enriched KEGG pathways of cis-target genes (D) and trans-target genes (E) of DE lncRNAs and DE mRNAs (F) in the early lactation (EL) vs perinatal period (PP).
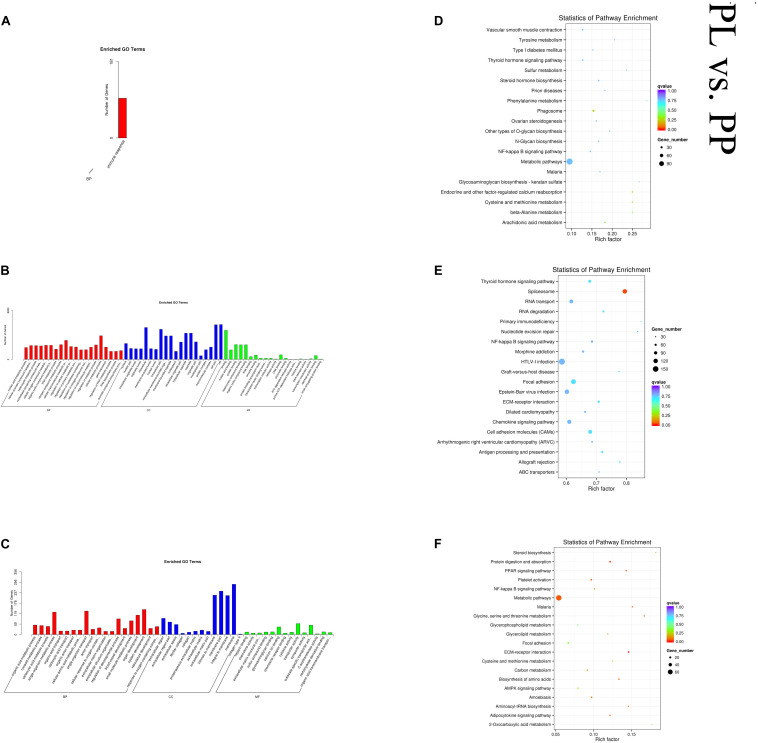
In the PL vs PP comparison, DE mRNAs were significantly enriched in 64 GO terms. The top enriched GO terms were organic acid metabolic process (GO:0006082), extracellular region (GO:0005576), and heparin binding (GO:0008201) in BP, CC, and MF, respectively. The cis-target genes of the DE lncRNAs were significantly enriched in only one GO term: immune response (GO:0006955). The trans-target genes of the DE lncRNAs were significantly enriched in 576 GO terms. The top enriched GO terms were nucleic acid metabolic process (GO:0090304), nucleus (GO:0005634), and binding (GO:0005488) in BP, CC, and MF, respectively. DE mRNAs were significantly enriched in 23 KEGG pathways. The cis-target genes of the DE lncRNAs were significantly enriched in 15 KEGG pathways, and the trans-target genes of the DE lncRNAs were significantly enriched in 11 KEGG pathways, within which pathways related to lactation were enriched, such as cell adhesion molecules (oas04514), metabolic (oas01100), and several metabolism-related pathways. Figure 7 shows some of the top enriched GO terms and KEGG pathways, and the details are provided in Supplementary Table S4.
FIGURE 7.
Top annotated GO terms of cis-target genes (A) and trans-target genes (B) of differentially expressed (DE) lncRNAs and DE mRNAs (C) and top enriched KEGG pathways of cis-target genes (D), and trans-target genes (E) of DE lncRNAs and DE mRNAs (F) in peak lactation (PL) vs perinatal period (PP).
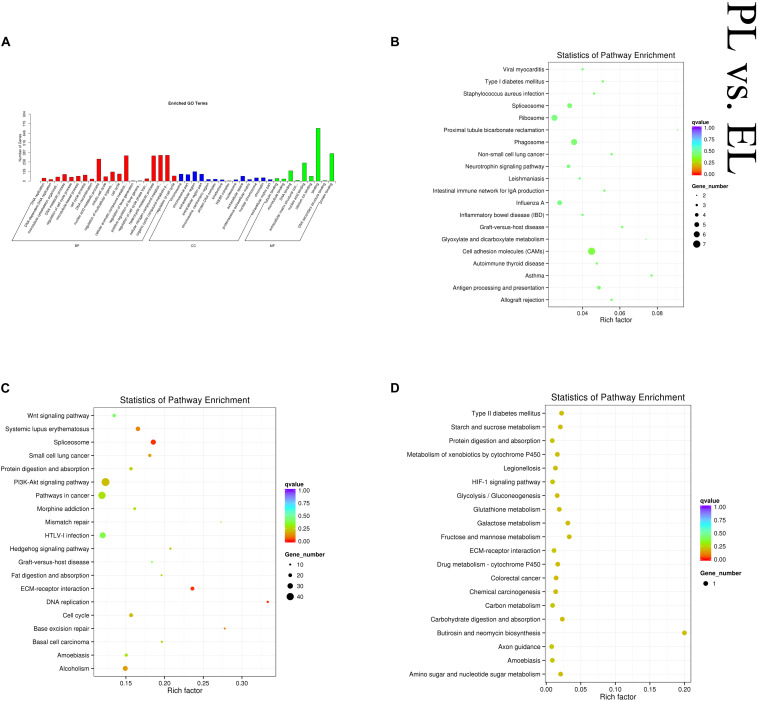
In the PL vs EL comparison, DE mRNAs and cis-target genes of the DE lncRNAs were found to be significantly enriched in no GO terms, and trans-target genes of the DE lncRNAs were significantly enriched in 59 GO terms. The top enriched GO terms were DNA replication (GO:0006260), chromosome (GO:0005694), and tubulin binding (GO:0015631) in BP, CC, and MF, respectively. DE mRNAs were significantly enriched in three KEGG pathways. The cis-target genes of the DE lncRNAs were significantly enriched in 14 KEGG pathways, and the trans-target genes of the DE lncRNAs were significantly enriched in 24 KEGG pathways, within which pathways related to lactation were enriched, such as cell cycle (oas04110) and ECM–receptor interaction (oas04512). Figure 8 shows some of the top enriched GO terms and KEGG pathways, and the details are provided in Supplementary Table S4.
FIGURE 8.
Top annotated GO terms of trans-target genes of differentially expressed (DE) lncRNAs (A) and top enriched KEGG pathways of cis-target genes (B) and trans-target genes (C) of DE lncRNAs and DE mRNAs (D) in peak lactation (PL) vs early lactation (EL).
Validation of Sequencing Data
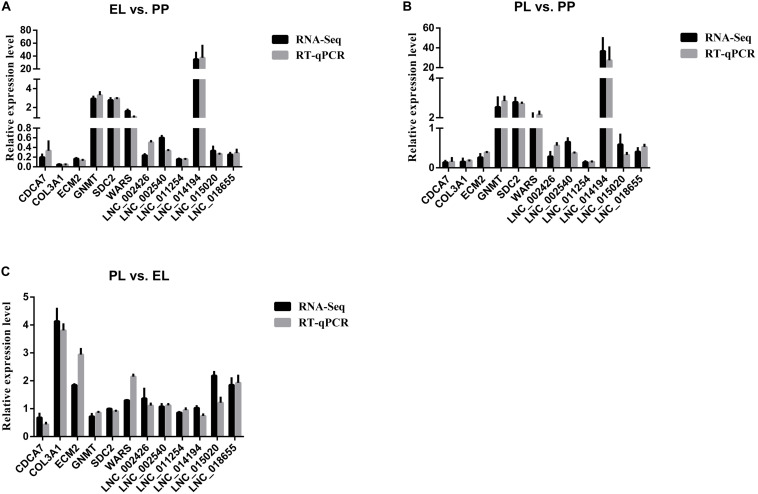
The melting curve chart and melting peak chart of RT-qPCR are shown in Supplementary Table S2, which indicated the accuracy and repeatability of our RT-qPCR data. The comparison of the expression level of DE lncRNAs and DE mRNAs selected for verification of the accuracy of sequencing between RNA-Seq and RT-qPCR are shown in Figure 9. The results indicated that selected lncRNAs and mRNAs showed similar expression patterns between RNA-Seq and RT-qPCR, suggesting the reliability of our sequencing data.
FIGURE 9.
Comparisons of the results of the RNA-seq and RT-qPCR analyses of DE lncRNAs and mRNAs in early lactation (EL) vs perinatal period (PP) (A), peak lactation (PL) vs PP (B), and PL vs EL (C).
Discussion
The mammary gland is a key organ related to lactation in mammals, and the milk yield is largely controlled by the mammary epithelial cells (MECs). During pregnancy and the lactation period, MECs go through three stages: proliferation, differentiation, and apoptosis (Tsugami et al., 2020; Zhou et al., 2020). From the beginning of pregnancy to the end of the PP, the mammary gland is further developed and rapid proliferation of the MECs takes place. After parturition, the MECs differentiate into secretory cells, regulate lactation, and remain stable during lactation. During PL to late lactation, the milk yield begins to decrease, and the apoptosis of MECs begins (Rios et al., 2016). Hence, we selected three key time points in the development of MECs to study the molecular mechanisms underlying sheep lactation: PP (proliferation), EL (differentiation), and PL (beginning of apoptosis). Numerous studies have found an association between birth size, parity, and milk yield in cows (Kamal et al., 2014; Pinedo et al., 2020), goats (Zumbach et al., 2008), and sheep (David et al., 2008; Dettori et al., 2018): specifically, the milk yield tends to increase with birth size and parity. To enhance the reliability of the sequencing data, mammary gland biopsies from first-time pregnant ewes with the same litter size were selected for the final sequencing.
Transcriptomic Profiles
The average mapping rate in our study was 81.66%, and 21,608 lncRNAs and 22,823 mRNAs were identified. 1111, 688 DE lncRNAs and 1360, 660 DE mRNAs were detected in the EL vs PP and PL vs PP comparisons, respectively, indicating a clear difference in the expression profiles of lncRNAs and mRNAs between the perinatal and lactation periods. In PL vs EL, 54 DE lncRNAs and 17 DE mRNAs were identified. The numbers of DE lncRNAs and mRNAs in this comparison were far fewer than those observed in other comparison groups (EL vs PP and PL vs PP). Our results are consistent with previous studies in dairy goats (Guan et al., 2020) and cows (Lin et al., 2019), implying that the transcriptomic state in the mammary gland during lactation may be a widespread characteristic of livestock.
COL3A1 was found to be DE in all three comparisons. Specifically, the expression level of COL3A1 rapidly decreased from PP to the lactation period and then remained steady. Previous studies of cancer have demonstrated the role that COL3A1 can play in the proliferation of cancer cells (Qiu et al., 2015; Xu et al., 2018), Furthermore, the overexpression of COL3A1 can lead to a significant decrease in the phosphorylation of the AKT/mTOR pathway (Kuivaniemi and Tromp, 2019), a pathway that is important for lactation (Wang et al., 2014). This evidence suggests that COL3A1 may play an important role in the sheep MEC cycle and would make a prime candidate for future research.
Among the DE mRNAs, the top five with the highest expression levels were CSN1S1, CSN1S2, PAEP, CSN2, and CSN3 (according to the average FPKM values) and showed similar expression profiles (increasing sharply then decreasing slightly during the three stages). Four tightly linked casein genes, CSN1S1, CSN1S2, CSN2, and CSN3 (Bovenhuis and Weller, 1994), were particularly noteworthy. Among livestock, sheep are the least studied with respect to the effect of these four casein genes on lactation. No association was revealed between polymorphisms at the CSN3 loci and milk yield in East Friesian sheep (Staiger et al., 2010). However, several studies have revealed that these genes play key roles in determining milk-related traits, such as protein rate, fat rate, and milk yield in dairy cows (Rodney et al., 2016) and goats (Cardona et al., 2016). One potential explanation for these inconsistencies is that the animal models differ in their properties. Nevertheless, given their critical roles in lactation, it is likely that CSN1S1, CSN1S2, CSN2, and CSN3 play a role in sheep lactation; however, additional work is needed to confirm this possibility. One of the DE lncRNAs, LNC_018483, whose cis-target genes were CSN1S1, CSN1S2, and CSN2, also showed a similar expression pattern to these genes. Consequently, future work should determine whether LNC_018483 mediates the effects of casein genes on sheep lactation. Consistent with previous studies in cattle (Yang et al., 2016) and sheep (Suarez-Vega et al., 2015), PAEP, which encodes the major milk whey β-lactoglobulin protein, showed a higher expression level in the lactation period than in the non-lactation period. PAEP is essential for lactation and could potentially explain the transcriptomic features of sheep milk protein.
Higher expression levels of DGAT2, STAT1, STAT2, and STAT5A, candidate genes that regulate milk fat and protein (Arun et al., 2015; Liu et al., 2020), were detected in the PP. Our results are inconsistent with previous studies in dairy cows (Bionaz and Loor, 2011; Karlengen et al., 2012; Bovenhuis et al., 2016) that revealed a positive correlation between the expression level of these genes and milk yield. Instead, our results demonstrated that DGAT2, STAT1, STAT2, and STAT5A may be negatively related to milk fat and lactose in sheep; however, additional research is needed to test this hypothesis. No significant changes in the expression of DGAT1, STAT3, STAT6, and STAT5B genes were detected. Little research has been conducted on these genes in sheep; thus, whether these genes play a role in sheep lactation remains unclear.
We also compared the expression level of several classic cell cycle-related transcriptional regulators during different periods, including members of the CDK, CCK, PPAR, Blc-2, and DR families. A rapid downregulation in expression was observed in most members of the CDK (CDK1, CDKL1, and CDKN3), CCN (CCNA2, CCNB2, CCNE2, CCNF, CCNY, and CCNYL1), and PPAR families (PPARG) in the lactation period compared with the non-lactation period. Several studies have demonstrated that these genes can inhibit the proliferation of cancer cells, muscle cells, and MECs (Small et al., 2014; Yeger and Perbal, 2016; Sarek et al., 2019). The proliferation of MECs during the lactation period and their expression profiles suggest that they may inhibit the proliferation of MECs in sheep. A sharp increase (from PP to EL) followed by a slight decrease (from EL to PL) during the three periods was detected in the expression level of apoptosis-related genes, such as DR1 and several members of the SLC family (SLC26A2, SLC35C2). Given the critical role of these genes in the apoptosis of cells (Morioka et al., 2018; Qiu et al., 2018; Scalise et al., 2018), we hypothesize that the decline in lactation may begin during PL in sheep. Furthermore, members of the CDK and CCN families (Yeger and Perbal, 2016; Sarek et al., 2019) also showed non-significant up-regulation in PL vs EL, which also is consistent with our hypothesis.
Most of the top DE lncRNAs (according to fold change) of the three comparisons were predicted to be target members of the FAM family, such as LNC_012374 (1st in EL vs PP, cis-target FAM160B1), LNC_008239 (2nd in EL vs PP, trans-target FAM124A), and LNC_001741 (3rd in EL vs PP, trans-target FAM167B), LNC_020336 (2nd in PL vs PP, trans-target FAM184A), LNC_001741 (1st in EL vs PL, trans-target FAM167B), and LNC_008239 (2nd in EL vs PL, trans-target FAM124A). FAM, novel regulators in the caspase family, have been overwhelmingly confirmed to play a critical role in the intracellular regulation of cell apoptosis in cancer (Mannherz et al., 2006). Despite the tremendous interest in FAM in cancer cells, little research has been conducted to assess the influence of FAM on the MEC cycle. Our new data and findings contribute to our understanding of the molecular mechanisms underlying the sheep MEC cycle.
Functional Enrichment of DE mRNAs and lncRNAs
In all three comparisons, GO annotation showed that the target genes of DE lncRNAs and DE mRNAs were primarily involved in the extracellular region, metabolism, and cell cycle. These results suggest that DE mRNAs and lncRNAs contribute, both directly and indirectly, to diverse lactation-related processes, highlighting the complex metabolic and extracellular changes that the mammary gland undergoes throughout sheep lactation.
The KEGG pathway enrichment analysis of target genes of the DE lncRNAs revealed that the cell cycle and MAPK signaling pathway were significantly enriched for both the EL vs PP and PL vs PP comparisons (lactation vs non-lactation). In dairy cows, the MAPK signaling pathway can downregulate the expression of IGF-β protein in bovine MECs; in addition, the expression of IGF-β protein is closely related to the apoptosis of bovine MECs (Fleming et al., 2007; Yu et al., 2012). We thus hypothesized that a regulatory relationship between lncRNA, the MAPK signaling pathway, and MECs may also exist in sheep.
The KEGG pathway enrichment analysis of DE mRNAs revealed that two crucial lactation-related pathways—the PPAR and ECM-receptor interaction signaling pathways—were significantly enriched. The PPAR signaling pathway has been reported to be associated with the vitality and proliferation of MECs in goats (Shi et al., 2013). Similarly, considerable evidence has shown that the ECM can directly or indirectly contribute to cell differentiation, proliferation, and apoptosis (Zhang et al., 2016). Hence, from our perspective, PPAR and ECM–receptor interaction signaling pathways may also affect the cycle of MECs in sheep. However, several key pathways in lactation, such as mTOR and PI3K-AKT, were not significantly enriched in our study. Thus, our findings suggest that proteins related to lactation are synthesized by other pathways during the sheep lactation period.
DE Interaction Network
To further understand the functions of lncRNAs and mRNAs in sheep lactation, we constructed a DE lncRNA–DE mRNA interaction network that contained 79 DE lncRNAs and 1,214 DE mRNAs. LNC_005678, LNC_012936, and LNC_004856 had the highest numbers of connections in the network and targeted 27, 29, and 16 members of the SLC family, respectively. All of these lncRNAs were predicted to target COL3A1, which was DE in all three comparisons. The top DE mRNA with the highest number of connections in the network was ENSOART00000017132 (DCN). A core component of proteoglycan, DCN can regulate many important cellular biological processes, including cell proliferation, differentiation, apoptosis, and carcinogenesis (Xu et al., 2016). There is a high probability that these lncRNAs and mRNAs interact closely and thus act as key regulators in MECs; thus, future work should focus on the potential roles that these RNAs play in sheep lactation.
Conclusion
RNA-Seq data from mammary gland biopsies extracted during the perinatal, EL and PL periods were used to gain insight into the expression profiles of lncRNAs and mRNAs during lactation in sheep. Several potential candidate DE mRNAs (e.g., CSN1S1, CSN1S2, PAEP, CSN2, COL3A1, CDK, CCN, FAM, and SLC), lncRNAs (e.g., LNC_012374, LNC_008239, and LNC_001741), and mRNA–lncRNA pairs (e.g., CSN1S1, CSN1S2, CSN2-LNC_018483, COL3A1-LNC_005678, LNC_012936, and LNC_004856) were detected. Functional enrichment analysis revealed that several DE mRNAs and target genes of DE lncRNAs were involved in lactation-related pathways, such as MAPK, PPAR, and ECM–receptor interaction. Our findings can path the way for future studies of lncRNAs and mRNAs involved in lactation as well as help elucidate the molecular mechanisms underlying lactation in sheep.
Data Availability Statement
The datasets presented in this study can be found in online repositories. The names of the repository/repositories and accession number(s) can be found below: https://www.ncbi.nlm.nih.gov/, PRJNA634610.
Ethics Statement
The animal study was reviewed and approved by Experimental Animal Welfare and Ethical of Institute of Animal Science, Yangzhou University. Written informed consent was obtained from the owners for the participation of their animals in this study.
Author Contributions
WS, WC, YW, XL, XZ, SW, and LC designed the research. WC, YW, XL, XZ, ZH, and RS collected the data. WC analyzed the data and drafted the manuscript. WS and SW revised the final manuscript. All authors read and approved the final manuscript.
Conflict of Interest
RS was employed by company employed by company Suzhou Taihu Dongshang Sheep Industry Development Co., Ltd., China. The remaining authors declare that the research was conducted in the absence of any commercial or financial relationships that could be construed as a potential conflict of interest.
Footnotes
Funding. This work was supported by the National Natural Science Foundation of China (31872333), The Projects of Domesticated Animals Platform of the Ministry of Science, Key Research and Development Plan (modern agriculture) in Jiangsu Province (BE2018354), major new varieties of agricultural projects in Jiangsu Province (PZCZ201739), Jiangsu Agricultural Science and Technology Innovation Fund (CX (18)2003), the project funded by the Priority Academic Program Development of Jiangsu Higher Education Institutions, and major projects of Natural Science Research of colleges and universities in Jiangsu Province (17KJA230001).
Supplementary Material
The Supplementary Material for this article can be found online at: https://www.frontiersin.org/articles/10.3389/fgene.2020.00946/full#supplementary-material
High-resolution differentially expressed mRNA–differentially expressed lncRNA interaction network.
Melting curve chart and melting peak chart of RT-qPCR.
Primer information of RT-qPCR and sequences of the selected lncRNAs for sequencing validation.
Differentially expressed mRNAs and lncRNAs for three comparisons between different time points of the lactation stage.
Details of the differentially expressed mRNAs–differentially expressed lncRNAs interaction network.
Functional enrichment of differentially expressed mRNAs and target genes of differentially expressed lncRNAs for three comparisons between different time points of the lactation stage (early lactation vs perinatal period; peak lactation vs perinatal period; and peak lactation vs early lactation).
References
- Arun S. J., Thomson P. C., Sheehy P. A., Khatkar M. S., Raadsma H. W., Williamson P. (2015). Targeted analysis reveals an important role of JAK-STAT-SOCS genes for milk production traits in australian dairy cattle. Front. Genet. 6:342. 10.3389/fgene.2015.00342 [DOI] [PMC free article] [PubMed] [Google Scholar]
- Azagra-Boronat I., Tres A., Massot-Cladera M., Franch A., Castell M., Guardiola F., et al. (2020). Lactobacillus fermentum CECT5716 supplementation in rats during pregnancy and lactation affects mammary milk composition. J. Dairy Sci. 103 2982–2992. 10.3168/jds.2019-17384 [DOI] [PubMed] [Google Scholar]
- Balthazar C. F., Santillo A., Guimaraes J. T., Capozzi V., Russo P., Caroprese M., et al. (2019). Novel milk-juice beverage with fermented sheep milk and strawberry (Fragaria x ananassa): nutritional and functional characterization. J. Dairy Sci. 102 10724–10736. 10.3168/jds.2019-16909 [DOI] [PubMed] [Google Scholar]
- Banos G., Clark E. L., Bush S. J., Dutta P., Bramis G., Arsenos G., et al. (2019). Genetic and genomic analyses underpin the feasibility of concomitant genetic improvement of milk yield and mastitis resistance in dairy sheep. PLoS One 14:e214346. 10.1371/journal.pone.0214346 [DOI] [PMC free article] [PubMed] [Google Scholar]
- Billa P. A., Faulconnier Y., Ye T., Chervet M., Le Provost F., Pires J. A. A., et al. (2019). Deep RNA-Seq reveals miRNome differences in mammary tissue of lactating Holstein and Montbeliarde cows. BMC Genomics 20:621. 10.1186/s12864-019-5987-4 [DOI] [PMC free article] [PubMed] [Google Scholar]
- Bionaz M., Loor J. J. (2011). Gene networks driving bovine mammary protein synthesis during the lactation cycle. Bioinform. Biol. Insights 5 83–98. 10.4137/BBI.S7003 [DOI] [PMC free article] [PubMed] [Google Scholar]
- Bovenhuis H., Visker M., Poulsen N. A., Sehested J., van Valenberg H. J. F., van Arendonk J. A. M., et al. (2016). Effects of the diacylglycerol o-acyltransferase 1 (DGAT1) K232A polymorphism on fatty acid, protein, and mineral composition of dairy cattle milk. J. Dairy Sci. 99 3113–3123. 10.3168/jds.2015-10462 [DOI] [PubMed] [Google Scholar]
- Bovenhuis H., Weller J. I. (1994). Mapping and analysis of dairy cattle quantitative trait loci by maximum likelihood methodology using milk protein genes as genetic markers. Genetics 137 267–280. [DOI] [PMC free article] [PubMed] [Google Scholar]
- Cardona S., Cadavid H. C., Corrales J. D., Munilla S., Cantet R. J. C., Rogberg-Muñoz A. (2016). Longitudinal data analysis of polymorphisms in the kappa-casein and beta-lactoglobulin genes shows differential effects along the trajectory of the lactation curve in tropical dairy goats. J. Dairy Sci. 99 7299–7307. 10.3168/jds.2016-10954 [DOI] [PubMed] [Google Scholar]
- Chen L., Yang H., Yi Z., Jiang L., Li Y., Han Q., et al. (2019). LncRNA GAS5 regulates redox balance and dysregulates the cell cycle and apoptosis in malignant melanoma cells. J. Cancer Res. Clin. Oncol. 145 637–652. 10.1007/s00432-018-2820-4 [DOI] [PMC free article] [PubMed] [Google Scholar]
- David I., Astruc J. M., Lagriffoul G., Manfredi E., Robert-Granie C., Bodin L. (2008). Genetic correlation between female fertility and milk yield in Lacaune sheep. J. Dairy Sci. 91 4047–4052. 10.3168/jds.2008-1113 [DOI] [PubMed] [Google Scholar]
- Dettori M. L., Pazzola M., Paschino P., Amills M., Vacca G. M. (2018). Association between the GHR, GHRHR, and IGF1 gene polymorphisms and milk yield and quality traits in Sarda sheep. J. Dairy Sci. 101 9978–9986. 10.3168/jds.2018-14914 [DOI] [PubMed] [Google Scholar]
- El-Gebali S., Mistry J., Bateman A., Eddy S. R., Luciani A., Potter S. C., et al. (2019). The Pfam protein families database in 2019. Nucleic Acids Res. 47 427–432. 10.1093/nar/gky995 [DOI] [PMC free article] [PubMed] [Google Scholar]
- Fleming J. M., Brandimarto J. A., Cohick W. S. (2007). The mitogen-activated protein kinase pathway tonically inhibits both basal and IGF-I-stimulated IGF-binding protein-5 production in mammary epithelial cells. J. Endocrinol. 194 349–359. 10.1677/JOE-06-0121 [DOI] [PubMed] [Google Scholar]
- Guan D., Landi V., Luigi-Sierra M. G., Delgado J. V., Such X., Castelló A., et al. (2020). Analyzing the genomic and transcriptomic architecture of milk traits in Murciano-Granadina goats. J Anim. Sci. Biotechnol. 11:35. 10.1186/s40104-020-00435-4 [DOI] [PMC free article] [PubMed] [Google Scholar]
- Hooper H. B., Silva P., de Oliveira S. A., Meringhe G., Lacasse P., Negrão J. A. (2020). Effect of heat stress in late gestation on subsequent lactation performance and mammary cell gene expression of Saanen goats. J. Dairy Sci. 103 1982–1992. 10.3168/jds.2019-16734 [DOI] [PubMed] [Google Scholar]
- Ji Z., Chao T., Liu Z., Hou L., Wang J., Wang A., et al. (2020). Genomewide integrated analysis demonstrates widespread functions of lncRNAs in mammary gland development and lactation in dairy goats. BMC Genomics 21:254. 10.1186/s12864-020-6656-3 [DOI] [PMC free article] [PubMed] [Google Scholar]
- Kamal M. M., Van Eetvelde M., Depreester E., Hostens M., Vandaele L., Opsomer G. (2014). Age at calving in heifers and level of milk production during gestation in cows are associated with the birth size of Holstein calves. J. Dairy Sci. 97 5448–5458. 10.3168/jds.2014-7898 [DOI] [PubMed] [Google Scholar]
- Karlengen I. J., Harstad O. M., Taugbol O., Berget I., Aastveit A. H., Våge D. I. (2012). The effect of excess cobalt on milk fatty acid profiles and transcriptional regulation of SCD, FASN, DGAT1 and DGAT2 in the mammary gland of lactating dairy cows. J. Anim. Physiol. Anim. Nutr. 96 1065–1073. 10.1111/j.1439-0396.2011.01221.x [DOI] [PubMed] [Google Scholar]
- Kim D., Langmead B., Salzberg S. L. (2015). HISAT: a fast spliced aligner with low memory requirements. Nat. Methods 12 357–360. 10.1038/nmeth.3317 [DOI] [PMC free article] [PubMed] [Google Scholar]
- Kong L., Zhang Y., Ye Z. Q., Liu X. Q., Zhao S. Q., Wei L., et al. (2007). CPC: assess the protein-coding potential of transcripts using sequence features and support vector machine. Nucleic Acids Res. 35 W345–W349. 10.1093/nar/gkm391 [DOI] [PMC free article] [PubMed] [Google Scholar]
- Kuivaniemi H., Tromp G. (2019). Type III collagen (COL3A1): gene and protein structure, tissue distribution, and associated diseases. Gene 707 151–171. 10.1016/j.gene.2019.05.003 [DOI] [PMC free article] [PubMed] [Google Scholar]
- Li X., Niu Z., Li L., Shi H. (2015). Measurement and analysis of lactation of Hu sheep. Jiangsu Agric. Sci. 43 249–252. 10.15889/j.issn.1002-1302.2015.09.083 [DOI] [Google Scholar]
- Lin Y., Lv H., Jiang M., Zhou J., Song S., Hou X. (2019). Functional analysis of the dairy cow mammary transcriptome between early lactation and mid-dry period. J. Dairy Res. 86 63–67. 10.1017/S0022029919000049 [DOI] [PubMed] [Google Scholar]
- Liu J., Wang Z., Li J., Li H., Yang L. (2020). Genome-wide identification of Diacylglycerol Acyltransferases (DGAT) family genes influencing Milk production in Buffalo. BMC Genet. 21:26. 10.1186/s12863-020-0832-y [DOI] [PMC free article] [PubMed] [Google Scholar]
- Livak K. J., Schmittgen T. D. (2001). Analysis of relative gene expression data using real-time quantitative PCR and the 2(-Delta Delta C(T)) Method. Methods 25 402–408. 10.1006/meth.2001.1262 [DOI] [PubMed] [Google Scholar]
- Luo Y., Lin J., Zhang Y., Dai G., Li A., Liu X. (2020). LncRNA PCAT6 predicts poor prognosis in hepatocellular carcinoma and promotes proliferation through the regulation of cell cycle arrest and apoptosis. Cell Biochem. Funct. 10.1002/cbf.3510 Online ahead of print [DOI] [PubMed] [Google Scholar]
- Lv X., Sun W., Zou S., Chen L., Mwacharo J. M., Wang J. (2019). Characteristics of the BMP7 promoter in hu sheep. Animals 9:874. 10.3390/ani9110874 [DOI] [PMC free article] [PubMed] [Google Scholar]
- Ma L., Zhang M., Jin Y., Erdenee S., Hu L., Chen H. (2018). Comparative transcriptome profiling of mRNA and lncRNA related to tail adipose tissues of sheep. Front. Genet. 9:365. 10.3389/fgene.2018.00365 [DOI] [PMC free article] [PubMed] [Google Scholar]
- Mannherz O., Mertens D., Hahn M., Lichter P. (2006). Functional screening for proapoptotic genes by reverse transfection cell array technology. Genomics 87 665–672. 10.1016/j.ygeno.2005.12.009 [DOI] [PubMed] [Google Scholar]
- Marti D. O. A., Diaz J. R., Molina M. P., Peris C. (2013). Quantification of milk yield and composition changes as affected by subclinical mastitis during the current lactation in sheep. J. Dairy Sci. 96 7698–7708. 10.3168/jds.2013-6998 [DOI] [PubMed] [Google Scholar]
- Meng S., Jian Z., Yan X., Li J., Zhang R. (2019). LncRNA SNHG6 inhibits cell proliferation and metastasis by targeting ETS1 via the PI3K/AKT/mTOR pathway in colorectal cancer. Mol. Med. Rep. 20 2541–2548. 10.3892/mmr.2019.10510 [DOI] [PMC free article] [PubMed] [Google Scholar]
- Morioka S., Perry J., Raymond M. H., Medina C. B., Zhu Y., Zhao L., et al. (2018). Efferocytosis induces a novel SLC program to promote glucose uptake and lactate release. Nature 563 714–718. 10.1038/s41586-018-0735-5 [DOI] [PMC free article] [PubMed] [Google Scholar]
- Pertea M., Pertea G. M., Antonescu C. M., Chang T. C., Mendell J. T., Salzberg S. L. (2015). StringTie enables improved reconstruction of a transcriptome from RNA-seq reads. Nat. Biotechnol. 33 290–295. 10.1038/nbt.3122 [DOI] [PMC free article] [PubMed] [Google Scholar]
- Pinedo P., Santos J., Chebel R. C., Galvao K. N., Schuenemann G. M., Bicalho R. C., et al. (2020). Associations of reproductive indices with fertility outcomes, milk yield, and survival in Holstein cows. J. Dairy Sci. 103 6647–6660. 10.3168/jds.2019-17867 [DOI] [PubMed] [Google Scholar]
- Qiu F., Sun R., Deng N., Guo T., Cao Y., Yu Y., et al. (2015). MiR-29a/b enhances cell migration and invasion in nasopharyngeal carcinoma progression by regulating SPARC and COL3A1 gene expression. PLoS One 10:e120969. 10.1371/journal.pone.0120969 [DOI] [PMC free article] [PubMed] [Google Scholar]
- Qiu L., Yu Q., Zhou Y., Zheng S., Tao J., Jiang Q., et al. (2018). Functionally impaired follicular helper T cells induce regulatory B cells and CD14(+) human leukocyte antigen-DR(-) cell differentiation in non-small cell lung cancer. Cancer Sci. 109 3751–3761. 10.1111/cas.13836 [DOI] [PMC free article] [PubMed] [Google Scholar]
- Rios A. C., Fu N. Y., Jamieson P. R., Pal B., Whitehead L., Nicholas K. R., et al. (2016). Essential role for a novel population of binucleated mammary epithelial cells in lactation. Nat. Commun. 7:11400. 10.1038/ncomms11400 [DOI] [PMC free article] [PubMed] [Google Scholar]
- Rodney R. M., Hall J. K., Westwood C. T., Celi P., Lean I. J. (2016). Precalving and early lactation factors that predict milk casein and fertility in the transition dairy cow. J. Dairy Sci. 99 7554–7567. 10.3168/jds.2015-10275 [DOI] [PubMed] [Google Scholar]
- Sarek G., Kotsantis P., Ruis P., Van Ly D., Margalef P., Borel V., et al. (2019). CDK phosphorylation of TRF2 controls t-loop dynamics during the cell cycle. Nature 575 523–527. 10.1038/s41586-019-1744-8 [DOI] [PMC free article] [PubMed] [Google Scholar]
- Scalise M., Pochini L., Console L., Losso M. A., Indiveri C. (2018). The human SLC1A5 (ASCT2) amino acid transporter: from function to structure and role in cell biology. Front. Cell Dev. Biol 6:96. 10.3389/fcell.2018.00096 [DOI] [PMC free article] [PubMed] [Google Scholar]
- Shannon P., Markiel A., Ozier O., Baliga N. S., Wang J. T., Ramage D., et al. (2003). Cytoscape: a software environment for integrated models of biomolecular interaction networks. Genome Res. 13 2498–2504. 10.1101/gr.1239303 [DOI] [PMC free article] [PubMed] [Google Scholar]
- Shi H., Luo J., Zhu J., Li J., Sun Y., Lin X., et al. (2013). PPAR gamma regulates genes involved in triacylglycerol synthesis and secretion in mammary gland epithelial cells of dairy goats. PPAR Res. 2013:310948. 10.1155/2013/310948 [DOI] [PMC free article] [PubMed] [Google Scholar]
- Small D. M., Morais C., Coombes J. S., Bennett N. C., Johnson D. W., Gobe G. C. (2014). Oxidative stress-induced alterations in PPAR-gamma and associated mitochondrial destabilization contribute to kidney cell apoptosis. Am. J. Physiol. Renal. Physiol. 307 F814–F822. 10.1152/ajprenal.00205.2014 [DOI] [PubMed] [Google Scholar]
- Staiger E. A., Thonney M. L., Buchanan J. W., Rogers E. R., Oltenacu P. A., Mateescu R. G. (2010). Effect of prolactin, beta-lactoglobulin, and kappa-casein genotype on milk yield in East Friesian sheep. J. Dairy Sci. 93 1736–1742. 10.3168/jds.2009-2630 [DOI] [PubMed] [Google Scholar]
- Suarez-Vega A., Gutierrez-Gil B., Klopp C., Robert-Granie C., Tosser-Klopp G., Arranz J. J. (2015). Characterization and comparative analysis of the milk transcriptome in two dairy sheep breeds using RNA sequencing. Sci. Rep. 5:18399. 10.1038/srep18399 [DOI] [PMC free article] [PubMed] [Google Scholar]
- Suarez-Vega A., Gutierrez-Gil B., Klopp C., Tosser-Klopp G., Arranz J. J. (2017). Variant discovery in the sheep milk transcriptome using RNA sequencing. BMC Genomics 18:170. 10.1186/s12864-017-3581-1 [DOI] [PMC free article] [PubMed] [Google Scholar]
- Sun L., Luo H., Bu D., Zhao G., Yu K., Zhang C., et al. (2013). Utilizing sequence intrinsic composition to classify protein-coding and long non-coding transcripts. Nucleic Acids Res. 41:e166. 10.1093/nar/gkt646 [DOI] [PMC free article] [PubMed] [Google Scholar]
- Trapnell C., Williams B. A., Pertea G., Mortazavi A., Kwan G., van Baren M. J., et al. (2010). Transcript assembly and quantification by RNA-Seq reveals unannotated transcripts and isoform switching during cell differentiation. Nat. Biotechnol. 28 511–515. 10.1038/nbt.1621 [DOI] [PMC free article] [PubMed] [Google Scholar]
- Tsugami Y., Suzuki N., Kawahara M., Suzuki T., Nishimura T., Kobayashi K. (2020). Establishment of an in vitro culture model to study milk production and the blood-milk barrier with bovine mammary epithelial cells. Anim. Sci. J. 91:e13355. 10.1111/asj.13355 [DOI] [PubMed] [Google Scholar]
- Wang L., Feng Z., Wang X., Wang X., Zhang X. (2010). DEGseq: an R package for identifying differentially expressed genes from RNA-seq data. Bioinformatics 26 136–138. 10.1093/bioinformatics/btp612 [DOI] [PubMed] [Google Scholar]
- Wang L., Lin Y., Bian Y., Liu L., Shao L., Lin L., et al. (2014). Leucyl-tRNA synthetase regulates lactation and cell proliferation via mTOR signaling in dairy cow mammary epithelial cells. Int. J. Mol. Sci. 15 5952–5969. 10.3390/ijms15045952 [DOI] [PMC free article] [PubMed] [Google Scholar]
- Wang Z., Yang B., Zhang M., Guo W., Wu Z., Wang Y., et al. (2018). LncRNA epigenetic landscape analysis identifies EPIC1 as an oncogenic lncRNA that interacts with MYC and promotes Cell-Cycle progression in cancer. Cancer Cell 33 706–720. 10.1016/j.ccell.2018.03.006 [DOI] [PMC free article] [PubMed] [Google Scholar]
- Xiang R., McNally J., Bond J., Tucker D., Cameron M., Donaldson A. J., et al. (2018). Across-Experiment transcriptomics of sheep rumen identifies expression of Lipid/Oxo-Acid metabolism and muscle cell junction genes associated with variation in methane-related phenotypes. Front. Genet. 9:330. 10.3389/fgene.2018.00330 [DOI] [PMC free article] [PubMed] [Google Scholar]
- Xie C., Mao X., Huang J., Ding Y., Wu J., Dong S., et al. (2011). KOBAS 2.0: a web server for annotation and identification of enriched pathways and diseases. Nucleic Acids Res. 39 W316–W322. 10.1093/nar/gkr483 [DOI] [PMC free article] [PubMed] [Google Scholar]
- Xu H., Jiang Y., Xu X., Su X., Liu Y., Ma Y., et al. (2020). Author Correction: inducible degradation of lncRNA Sros1 promotes IFN-γ-mediated activation of innate immune responses by stabilizing Stat1 mRNA. Nat. Immunol. 21 477–478. 10.1038/s41590-020-0630-8 [DOI] [PubMed] [Google Scholar]
- Xu W., Li Z., Zhu X., Xu R., Xu Y. (2018). MiR-29 family inhibits resistance to methotrexate and promotes cell apoptosis by targeting COL3A1 and MCL1 in osteosarcoma. Med. Sci. Monit. 24 8812–8821. 10.12659/MSM.911972 [DOI] [PMC free article] [PubMed] [Google Scholar]
- Xu Y., Xia Q., Rao Q., Shi S., Shi Q., Ma H., et al. (2016). DCN deficiency promotes renal cell carcinoma growth and metastasis through downregulation of P21 and E-cadherin. Tumour. Biol. 37 5171–5183. 10.1007/s13277-015-4160-1 [DOI] [PubMed] [Google Scholar]
- Yang J., Jiang J., Liu X., Wang H., Guo G., Zhang Q., et al. (2016). Differential expression of genes in milk of dairy cattle during lactation. Anim. Genet. 47 174–180. 10.1111/age.12394 [DOI] [PMC free article] [PubMed] [Google Scholar]
- Yeger H., Perbal B. (2016). CCN family of proteins: critical modulators of the tumor cell microenvironment. J. Cell Commun. Signal. 10 229–240. 10.1007/s12079-016-0346-6 [DOI] [PMC free article] [PubMed] [Google Scholar]
- Yoon J. H., Abdelmohsen K., Srikantan S., Yang X., Martindale J. L., De S., et al. (2012). LincRNA-p21 suppresses target mRNA translation. Mol. Cell 47 648–655. 10.1016/j.molcel.2012.06.027 [DOI] [PMC free article] [PubMed] [Google Scholar]
- Young M. D., Wakefield M. J., Smyth G. K., Oshlack A. (2010). Gene ontology analysis for RNA-seq: accounting for selection bias. Genome Biol. 11:R14. 10.1186/gb-2010-11-2-r14 [DOI] [PMC free article] [PubMed] [Google Scholar]
- Yu T. C., Chen S. E., Ho T. H., Peh H. C., Liu W. B., Tiantong A., et al. (2012). Involvement of TNF-alpha and MAPK pathway in the intramammary MMP-9 release via degranulation of cow neutrophils during acute mammary gland involution. Vet. Immunol. Immunopathol. 147 161–169. 10.1016/j.vetimm.2012.04.011 [DOI] [PubMed] [Google Scholar]
- Zhang H. J., Tao J., Sheng L., Hu X., Rong R. M., Xu M., et al. (2016). RETRACTED: twist2 promotes kidney cancer cell proliferation and invasion via regulating ITGA6 and CD44 expression in the ECM-receptor-interaction pathway. Biomed. Pharmacother. 81 453–459. 10.1016/j.biopha.2016.02.042 [DOI] [PubMed] [Google Scholar]
- Zhang X., Chen M., Liu X., Zhang L., Ding X., Guo Y., et al. (2020). A novel lncRNA, lnc403, involved in bovine skeletal muscle moygenesis by mediating KRAS/Myf6. Gene 51:144706. 10.1016/j.gene.2020.144706 [DOI] [PubMed] [Google Scholar]
- Zhang Z., Tang J., He X., Zhu M., Gan S., Guo X., et al. (2019). Comparative transcriptomics identify key hypothalamic circular RNAs that participate in sheep (Ovis aries) reproduction. Animals 9:557. 10.3390/ani9080557 [DOI] [PMC free article] [PubMed] [Google Scholar]
- Zhou J., Jiang M., Shi Y., Song S., Hou X., Lin Y. (2020). Prolactin regulates LAT1 expression via STAT5 (signal transducer and activator of transcription 5) signaling in mammary epithelial cells of dairy cows. J. Dairy Sci. 103 6627–6634. 10.3168/jds.2019-17945 [DOI] [PubMed] [Google Scholar]
- Zumbach B., Tsuruta S., Misztal I., Peters K. J. (2008). Use of a test day model for dairy goat milk yield across lactations in Germany. J. Anim. Breed. Genet. 125 160–167. 10.1111/j.1439-0388.2007.00718.x [DOI] [PubMed] [Google Scholar]
Associated Data
This section collects any data citations, data availability statements, or supplementary materials included in this article.
Supplementary Materials
High-resolution differentially expressed mRNA–differentially expressed lncRNA interaction network.
Melting curve chart and melting peak chart of RT-qPCR.
Primer information of RT-qPCR and sequences of the selected lncRNAs for sequencing validation.
Differentially expressed mRNAs and lncRNAs for three comparisons between different time points of the lactation stage.
Details of the differentially expressed mRNAs–differentially expressed lncRNAs interaction network.
Functional enrichment of differentially expressed mRNAs and target genes of differentially expressed lncRNAs for three comparisons between different time points of the lactation stage (early lactation vs perinatal period; peak lactation vs perinatal period; and peak lactation vs early lactation).
Data Availability Statement
The datasets presented in this study can be found in online repositories. The names of the repository/repositories and accession number(s) can be found below: https://www.ncbi.nlm.nih.gov/, PRJNA634610.


