

Abstract
Background
The gold standard for COVID-19 diagnosis is detection of viral RNA through PCR. Due to global limitations in testing capacity, effective prioritization of individuals for testing is essential.
Methods
We devised a model estimating the probability of an individual to test positive for COVID-19 based on answers to 9 simple questions that have been associated with SARS-CoV-2 infection. Our model was devised from a subsample of a national symptom survey that was answered over 2 million times in Israel in its first 2 months and a targeted survey distributed to all residents of several cities in Israel. Overall, 43,752 adults were included, from which 498 self-reported as being COVID-19 positive.
Findings
Our model was validated on a held-out set of individuals from Israel where it achieved an auROC of 0.737 (CI: 0.712–0.759) and auPR of 0.144 (CI: 0.119–0.177) and demonstrated its applicability outside of Israel in an independently collected symptom survey dataset from the US, UK, and Sweden. Our analyses revealed interactions between several symptoms and age, suggesting variation in the clinical manifestation of the disease in different age groups.
Conclusions
Our tool can be used online and without exposure to suspected patients, thus suggesting worldwide utility in combating COVID-19 by better directing the limited testing resources through prioritization of individuals for testing, thereby increasing the rate at which positive individuals can be identified. Moreover, individuals at high risk for a positive test result can be isolated prior to testing.
Funding
E.S. is supported by the Crown Human Genome Center, Larson Charitable Foundation New Scientist Fund, Else Kroener Fresenius Foundation, White Rose International Foundation, Ben B. and Joyce E. Eisenberg Foundation, Nissenbaum Family, Marcos Pinheiro de Andrade and Vanessa Buchheim, Lady Michelle Michels, and Aliza Moussaieff and grants funded by the Minerva foundation with funding from the Federal German Ministry for Education and Research and by the European Research Council and the Israel Science Foundation. H.R. is supported by the Israeli Council for Higher Education (CHE) via the Weizmann Data Science Research Center and by a research grant from Madame Olga Klein – Astrachan.
Keywords: COVID-19, SARS-CoV-2, Artificial Intelligence, Machine Learning, Health Policies, Diagnosis
Graphical Abstract
Context and Significance
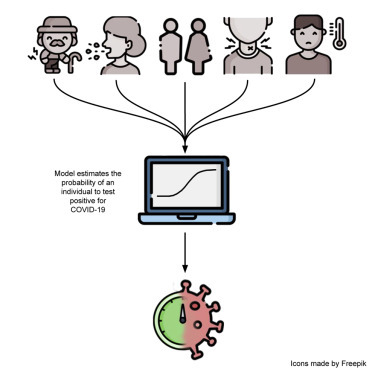
Finding a way to prioritize people more likely to test positive for SARS-CoV-2 infection is essential due to limitations in testing capacity. Researchers from the Weizmann Institute of Science in Israel developed a model that assesses the probability of an individual to be infected by SARS-CoV-2 based on 9 simple questions that can be easily answered online and without the need for health professionals to be exposed to suspected patients. The model may help prioritize testing resources and increase the rate at which positive individuals can be identified and isolated.
Shoer et al. developed a model that assesses the probability of an individual to be infected by SARS-CoV-2 based on 9 simple questions. The model may help in prioritizing testing resources and increase the rate at which positive individuals can be identified and isolated.
Introduction
The rapid and global spread of COVID-19 led the World Health Organization (WHO) to declare it a pandemic on March 11, 2020. One major factor that contributes to the spread of the virus is the apparently large number of undiagnosed infected individuals. This knowledge gap facilitates the silent propagation of the virus, delays the response of public health officials, and results in an explosion in the number of cases.1 , 2
One reason for this knowledge gap is insufficient testing. While the current gold standard for COVID-19 diagnosis is detection of viral RNA in a reverse transcription PCR test, the number of tests is limited by financial and logistic constraints. Moreover, if tested too early or due to technical errors like faulty shipping conditions, false-negative results can be obtained leading to undiagnosed infected individuals in the population that continue to spread the virus and risk others.3 As an alternative, the Food and Drug Administration (FDA) approved a diagnosis method that is based on antigen tests that provides results faster than the molecular-based method, but this method has an even higher false positive rate.4 Other methods, such as CRISPR-based diagnosis tools, have recently been approved by the FDA but are not widely used at this point.5 In a time when almost all countries are faced with the same health challenge, resources are scarce. This creates the need for a prioritization mechanism to allocate tests and resources more efficiently toward individuals who are more likely to test positive, leading to earlier identification of COVID-19 patients, social isolation, and reduced spread of the virus. Despite this need, most countries still employ a dichotomic and simplistic testing strategy based on the display of symptoms associated with the disease and close epidemiological contact with a confirmed COVID-19 case, and are struggling to choose whether to focus more resources on detecting clusters or detecting individuals affected by the virus.6 In practice, these strategies lead to a relatively small fraction of positive tests among those tested and thus to inefficient use of the precious testing resources.
Here, we present a model that provides estimates of the probability of an individual to test positive for SARS-CoV-2 infection in a PCR test, based on a national symptom survey that we distributed in Israel. Notably, while most studies describing the clinical characteristics of COVID-19 cases were based on symptoms of hospitalized patients,7, 8, 9, 10 our survey data allowed us to also study symptoms of milder cases and reveal which symptoms hold the highest predictive power for COVID-19 diagnosis. Using our model, the risk for a positive COVID-19 test can be evaluated in less than a minute and without added costs or risk of exposure to a suspected patient. Our approach can thus be used globally to make more efficient use of available testing capacities, by significantly increasing the fraction of positive tests obtained, and by rapidly identifying individuals that should be isolated until definitive test results are obtained.
Results
National Symptoms Survey
In this study, we utilized data that originates from two versions of a 1-min survey that was developed and deployed by our research group in the early stages of the COVID-19 spread in Israel.11 The online version of the survey includes questions relating to age, gender, prior medical conditions, smoking habits, self-reported symptoms, and geographical location and has been collected since March 14, 2020 (STAR Methods). As the number of COVID-19-diagnosed individuals in Israel rose, in some cities more than others, a shortened version of the survey was deployed using an interactive voice response (IVR) platform. This version of the survey included information on respondents’ age group, gender, presence of prior medical conditions, general feeling, and a partial list of symptoms, including fever, cough, shortness of breath, sore throat, and loss of taste or smell (STAR Methods). Since April 5, 2020, cities were targeted to participate in the IVR version of the survey according to the number of diagnosed patients and an increased concern for COVID-19 outbreaks (Table S1).
Overall, 695,586 and 66,447 responses were collected up until April 26, 2020, from the online and IVR versions of the survey, respectively. After a quality-control and spam-filtration process (Figure 1 ; STAR Methods), a total of 131,166 and 33,737 responses were eventually included in the analysis from the online and IVR versions of the survey, respectively. Since IVR-surveyed cities were at relatively high risk (Table S1), the prevalence of COVID-19-diagnosed responders in the IVR data was 1.14%, which is 6 times higher than the national prevalence at the time of 0.18%.6 These cities also had very high response rates, between 6% to 16% of the cities’ population (Table S1), while, in the online version of the survey, 0.09% reported a positive COVID-19 diagnosis, which is closer to the national prevalence at the time of 0.18%.6
Figure 1.
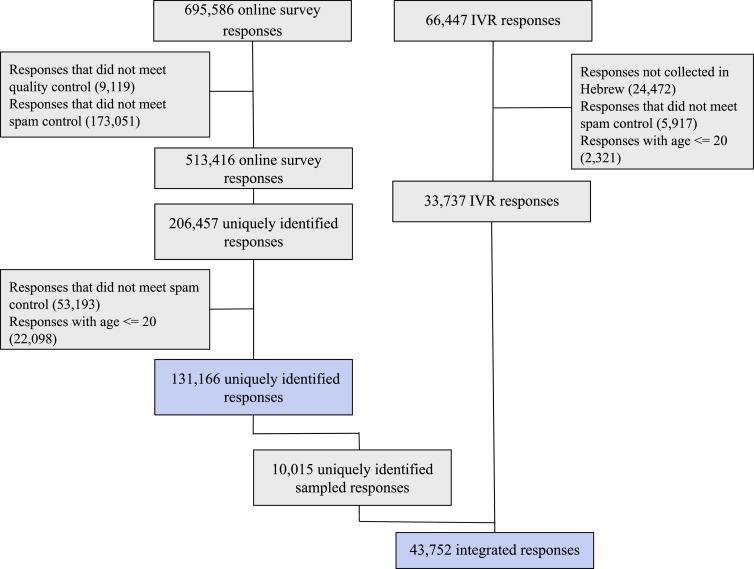
Study Population Flow Chart
Numbers represent recorded responses. Blue colored boxes show responses that were used in extended features model (top) and primary model (bottom) constructions.
Predicting the Outcome of a COVID-19 Test
We defined survey self-reporting of a COVID-19 laboratory confirmed diagnosis as our outcome. We constructed two models. The first, which we term the primary model, was constructed from the integrated responses of both the IVR and online versions of the survey and included the reduced set of questions that were surveyed in the IVR version. The characteristics of these responders are described in Table 1 . The second model, which we term the extended features model, was constructed using solely responses from the online version of the survey and included additional symptoms and questions that were not part of the IVR version of the survey. The characteristics of these responders are described in Table S2. We trained both the primary and extended features models using logistic regression; for more information on handling of missing values and the models construction process, see STAR Methods.
Table 1.
Baseline Characteristics of the Primary Model Population
| Characteristic, Mean (SD) or % | All Individuals n = 43,752 (100%) | IVR Version n = 33,737 (77.11%) | Online Version n = 10,015 (22.89%) | COVID-19 Undiagnosed n = 43,254 (98.862%) | COVID-19 Diagnosed n = 498 (1.138%) |
|---|---|---|---|---|---|
| Age in years | 44.941 (15.499) | 43.897 (15.244) | 48.460 (15.831) | 44.894 (15.47) | 49.076 (17.363) |
| Gender - male | 23,630 (54.009%) | 19,151 (56.766%) | 4,479 (44.723%) | 23,339 (53.958%) | 291 (58.434%) |
| COVID-19 diagnosed | 498 (1.138%) | 384 (1.138%) | 114 (1.138%) | 0 (0.0%) | 498 (100.0%) |
| Prior medical conditions | 8,070 (18.943%) | 5,176 (15.884%) | 2,894 (28.897%) | 7,946 (18.861%) | 124 (26.271%) |
| Feel well | 41,661 (95.221%) | 32,132 (95.243%) | 9,529 (95.147%) | 41,217 (95.291%) | 444 (89.157%) |
| Sore throat | 1,507 (3.445%) | 1,141 (3.382%) | 366 (3.655%) | 1,422 (3.288%) | 85 (17.068%) |
| Cough | 2,138 (4.887%) | 1,459 (4.325%) | 679 (6.78%) | 1,984 (4.587%) | 154 (30.924%) |
| Shortness of breath | 576 (1.317%) | 443 (1.313%) | 133 (1.328%) | 505 (1.168%) | 71 (14.257%) |
| Loss of taste or smell | 605 (1.388%) | 545 (1.624%) | 60 (0.599%) | 469 (1.088%) | 136 (27.812%) |
| Fever (body temperature above 38°C) | 77 (0.176%) | 53 (0.157%) | 24 (0.24%) | 64 (0.148%) | 13 (2.61%) |
Our primary model for prediction of a positive COVID-19 test result was based on the 43,752 integrated responses of which 498 self-reported as being diagnosed with COVID-19 (Figure 1; Table 1; STAR Methods). The model achieved an area under the receiver operating characteristic (auROC) of 0.737 (confidence interval [CI]: 0.712–0.759), and an area under the precision recall (auPR) of 0.144 (CI: 0.119–0.177) (Figures 2A and 2B; Table S3). As there is a trade-off between the positive predictive value (PPV) and the sensitivity of the model, appropriate thresholds can be chosen each time by policy makers according to factors such as the prevalence of the disease in the population and the number of available diagnostic tests (Table S4). As an example, when the availability of diagnostic tests is limited and a relatively high PPV is desired, a 10% sensitivity threshold may be chosen (in which 46.3% of the sick individuals will be recognized). On the other hand, if more tests are available, other thresholds may be chosen, such as 40% sensitivity, in which a lower PPV is obtained (10.5%). Even though in the majority of PPV thresholds the sensitivity of the model is not high, any prioritization, such as our continuous risk score, can mend current dichotomic policies, that only state who should or should not be tested. On top of that, the model has a negative predictive value (NPV) that does not go below 0.99 even in the highest decision probability threshold (Table S4). Aside from discrimination performance measures, we also tested whether the model was calibrated. In a perfectly calibrated model, the distribution of the predicted probabilities is equal to the distribution of outcomes observed in the training data. We found that our primary model is well calibrated across the relevant prediction range (Figure 2C).
Figure 2.
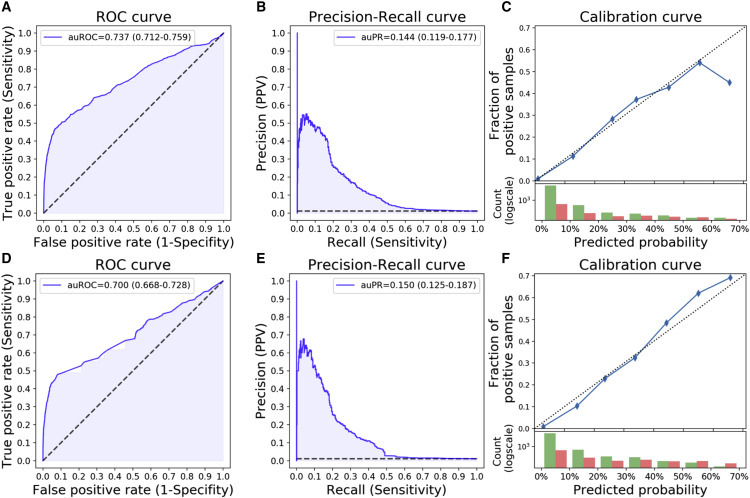
Primary Model Performance
(A–C) Logistic Regression. (D–F) Gradient Boosting Decision Trees. auROC/auPR, area under the ROC/PR curve; ROC, receiver operator characteristic; PR, precision recall. Confidence intervals are in parenthesis. (A and D) ROC curve of our model consisting of 9 simple questions. (B and E) Precision-recall curve of our model. (C and F) Calibration curve. Top: blue dots represent deciles of predicted probabilities. The dotted diagonal line represents an ideal calibration. Bottom: log-scaled histogram of predicted probabilities of COVID-19 undiagnosed (green) and diagnosed (red). See also Figure S1 and Tables S3–S5.
Model Validation
As an additional validation for the risk scores obtained, we compared the model predictions on the online survey data that were not used in the model construction process (n = 121,151), with the actual number of confirmed COVID-19 patients in Israel over time. Notably, we found that the average predicted probability of individuals to test positive for COVID-19 according to our model is highly correlated with the number of new confirmed COVID-19 cases and peaks 4 days later (Pearson r = 0.90, p < 10−8) (Figure 3 ), while the time since people first report they are suspected to be infected with the disease until the time they get a test result is on average 7 days.12 Furthermore, we evaluated the model’s performance on different COVID-19-diagnosed prevalences, to see how it would perform on populations with different percentages of cases. We found the area under the precision-recall curve to be improving as the prevalence increases (Figure S1; Table S5).
Figure 3.
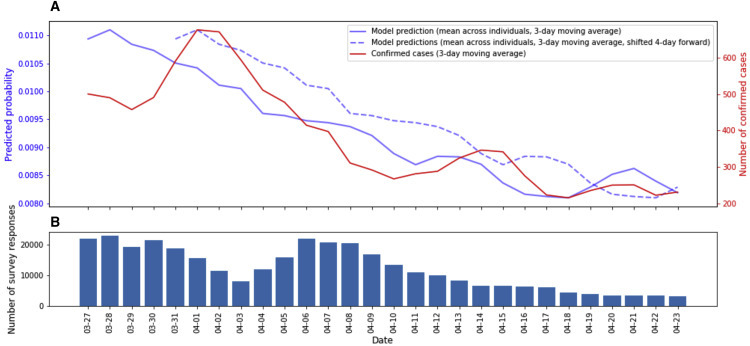
Comparison of Primary Model Predictions to New COVID-19 Cases in Israel over Time
(A) Primary model predictions, averaged across all individuals on a 3-day running average (solid blue) and shifted 4 days forward (dotted blue), compared to the number of newly confirmed COVID-19 cases in Israel by the ministry of health, based on a 3-day running average.
(B) Number of survey responses per day.
Collaborating within our Coronavirus Census Collective (CCC), we applied the model to an independent symptom survey dataset coupled with PCR tests in the US, UK, and Sweden (n = 113,139).13 , 14 Responses of individuals who underwent PCR tests were evaluated in groups, depending on the number of days their survey response preceded the PCR test. The model’s performance was evaluated in comparison to the PCR test result and improved each day over the week preceding the test (Figure 4 A). On entries filled on the same day as the test was conducted, the model achieved an auROC of 0.727 (CI: 0.711–0.739) and an auPR of 0.217 (CI: 0.199–0.235) (Figures 4B–4D; Table S4).
Figure 4.
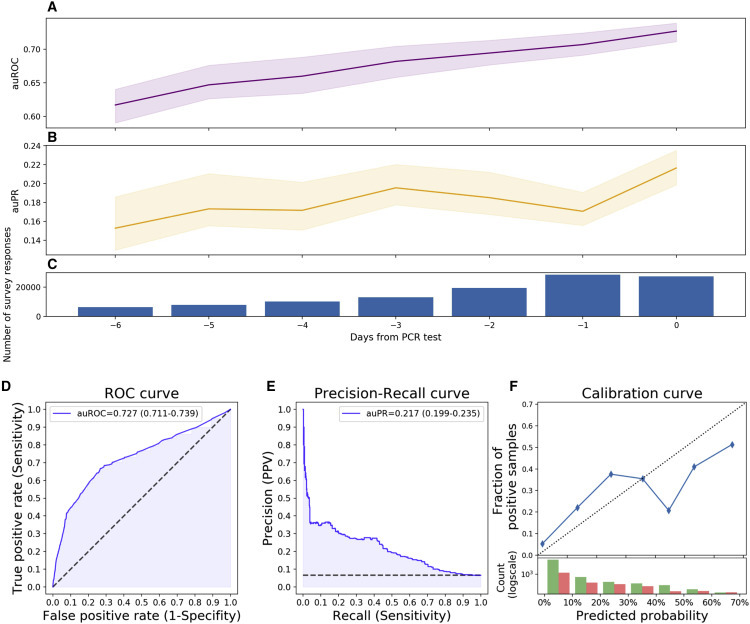
Primary Model Performance on an Independently Collected Dataset from the US, UK, and Sweden
(A) Area under the receiver operator characteristic curve (auROC) (purple).
(B) Area under the precision-recall curve (auPR) (orange).
(C) Number of survey responses per day.
(D) Receiver operator characteristic curve of our model consisting of 9 simple questions.
(E) Precision-recall curve of our model.
(F) Calibration curve. Top: blue dots represent deciles of predicted probabilities. Dotted diagonal line represents an ideal calibration. Bottom: log-scaled histogram of predicted probabilities of COVID-19 undiagnosed (green) and diagnosed (red).
Error bars represent CI. See also Table S4.
Feature Contributions Analysis
In order to capture nonlinear interactions and interactions among features, we trained both the primary and the extended features models using a Gradient Boosting Decision Trees algorithm15. The Gradient Boosting Decision Trees primary model showed similar performance to the Logistic Regression primary model (Figures 2D–2F; Table S3; Table S4), and predictions on the online survey data not used in the model’s construction process were highly correlated with the predictions of the primary Logistic Regression model (Pearson r = 0.91, p < 10−8).
To gain insight into the features that contribute most to the predicted probability of being diagnosed with COVID-19, we analyzed feature contributions in the Gradient Boosting Decision Trees models using SHAP (SHapley Additive exPlanation)16. SHAP aims to interpret the output of a machine learning model by estimating the Shapley value of each feature, which represents the average change in the output of the model, by conditioning on that feature while introducing other features one at a time, over all possible features ordering. Analyzing feature contributions in each of the models allowed us to compare the inner workings of each model and to identify which features dominated in each prediction.
Loss of taste or smell and cough had the largest overall contribution to the primary model (Figure 5 A), when analyzing the mean absolute SHAP value of the features on the entire data. Since the primary model contained a limited number of features, we compared its feature contributions to those obtained from the extended features model, also constructed using a Gradient Boosting Decision Trees algorithm. Notably, loss of taste or smell was the most contributing feature in both the primary model and the extended features model, which contained 14 additional features (Figure 5), as well as in an odds ratio analysis and other feature contribution measurement methods (Figure S2; Table S6). Although the extended features model included 23 features—14 additional features over the primary model, all symptoms included in the primary model were among the 12 features the algorithm found to be most contributing (Figure 5B).
Figure 5.
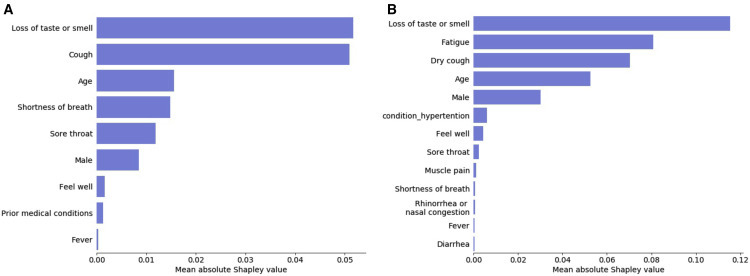
Feature Contribution Analysis
Mean absolute Shapley value (in units of log-odds) of (A) the primary model, including all features used in the model, and (B) the extended features model, for the 13 highest contributing features. See also Figure S2 and Table S6.
We further analyzed SHAP interaction values, which uses the “Shapley interaction index” to capture local interaction effects between features.16 Interaction values are calculated for each pair of the model’s features, and for each individual prediction of the model, allowing us to uncover interaction patterns between pairs of features.
As age was reported to be a dominant factor in SARS-CoV-2 infection and its clinical manifestation,17 we examined the interaction of age with each of the symptoms. Positive SHAP interaction value indicates that age and an examined symptom have more predictive power together than the summation of each of their individual predictive powers. The contribution of age individually to the probability of being diagnosed with COVID-19 is the highest in the oldest age group (>70 years old) (Figure 6 B). Presence of cough and loss of taste or smell exhibits a sharp transition-type (sigmoid-like) interaction with age, such that above the age of 40 years old; presence of each of these symptoms sharply increases the model’s predicted probability of COVID-19 infection (Figures 6G and 6H). In contrast, shortness of breath and sore throat show a more gradual (parabolic-like) interaction with age with presence of these symptoms increasing the model’s prediction more gradually as the age of the subject being predicted increases (Figures 6I and 6J). Negative answers to all these features show no interaction with age. Other examined features, such as fever and general feeling, do not show such interactions with age.
Figure 6.
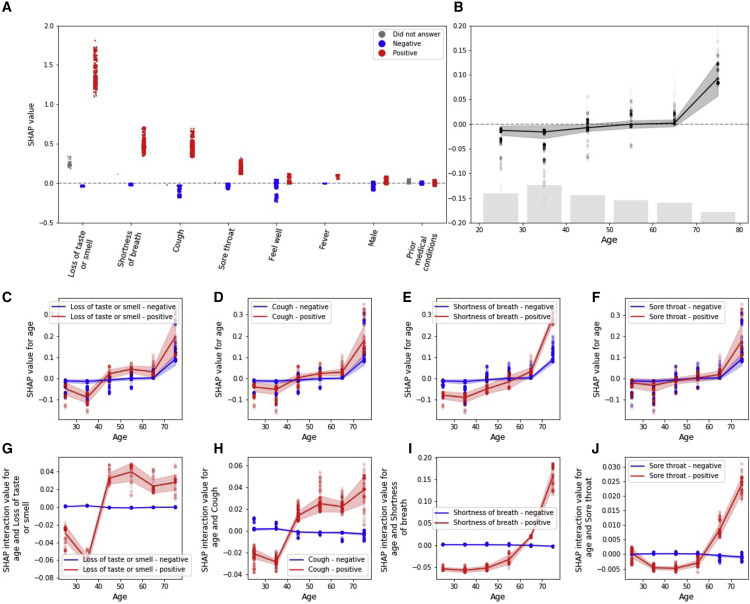
Feature Interpretation Analysis
(A) SHAP values (in units of log-odds) for positive report of a feature colored in red, negative report of a feature colored in blue, and missing answers in gray.
(B) SHAP values for age with number of responses as a histogram at the bottom.
(C–F) SHAP dependence plot of age versus its SHAP value in the model, stratified by positive (red) and negative (blue) responses of loss of taste or smell (C), cough (D), shortness of breath (E), and sore throat (F).
(G–J) SHAP interaction values of age with positive (red) and negative (blue) responses of loss of taste or smell (G), cough (H), shortness of breath (I), and sore throat (J). Error bars represent SD.
Discussion
In this study, we constructed a model that predicts the probability of individuals to test positive for COVID-19. Our model is based on 9 simple questions that every person can easily answer in less than a minute from their home. Our model can assist the worldwide fight against SARS-CoV-2 by better prioritizing the limited tests available without additional costs or risk of exposure to suspected patients, thereby increasing the rate at which positive individuals can be identified and isolated. Moreover, the tool can be used to estimate the COVID-19 status in the population and to regulate exposure of the general population to potentially infected individuals.
The model was validated on a portion of the Israeli dataset that was not used in the model construction process and found to be highly correlated with the number of new confirmed COVID-19 cases 4 days later, while on average the duration between reporting and obtaining of test results took 7 days.12 This high correlation shows that the survey and the model captures the overall trend in the Israeli population. We also evaluated the model’s performance on different disease prevalences, simulating different population states, and found it to be improving as the percentage of COVID-19 cases increases. Collaborating within our CCC, the model was also validated on an independent dataset collected during the week prior to conducting PCR tests in the US, UK, and Sweden.13 , 14 The model’s performance improved each day of the week prior to the PCR tests, probably due to the rise in symptoms and their severity in the early stages of the disease,18 while infection has yet to be confirmed, and treatment has not been initiated. This validation highlights the applicability of the model outside of Israel and especially in developing countries that are struggling to withstand the necessary load of PCR tests.
In Israel, as well as in many other countries, due to limited testing resources, and with a few exceptions such as healthcare workers, suspected patients are only tested if they were exposed to a COVID-19-confirmed patient as well as exhibited acute respiratory symptoms.6 By taking an unbiased approach to predicting SARS-CoV-2 diagnosis from symptoms data, our analysis highlights the importance of additional symptoms. Of note, anosmia and ageusia that were less described in patients in the early stages of the COVID-19 pandemic7 , 19 were the most impactful features in both the primary and extended features models for predicting COVID-19 diagnosis by SHAP analysis as well as in an other types of feature importance measurement tools. This is in line with recent literature demonstrating the importance of these symptoms in early detection and identification of the disease.20 , 21 Our model also successfully recapitulated patterns of the disease that are described in the literature, such as its complex relationship with age.17 In addition, our model unraveled several patterns that are not described in the literature, such as the different patterns of interactions that particular symptoms have with age, suggesting variation of the clinical manifestation of the disease in different age groups. Interestingly, as Israel faces an extreme second wave, where the majority of infected individuals are younger than before, the severity of symptoms and the percentage of cases that end up in hospitalization are lower.6 Although our analysis is purely predictive and not causal, these new patterns may be used to devise better testing policies and pave the way for future studies that can uncover new aspects of the disease that were not studied to date.
Analysis of an extended features model that included 23 features compared to 9 in the primary model validated our choice of questions in the shortened version of the survey and suggested that fatigue should also be considered. In addition, the extended features model suggested that, while dry cough has an essential role in predicting COVID-19 diagnosis, moist cough does not and thus may help distinguish between cases of SARS-CoV-2 and other infections. Some of the most contributing features to the prediction of a COVID-19 diagnosis were not initially included in the Israeli testing policy, such as loss of taste and smell, that were added to the policy in a later stage in the course of the pandemic.6 Other features, such as age, gender, and sore throat, are still not included. Our analysis suggests that adding these features to the testing policy may help discriminate which individuals should be tested and improve testing prioritization.
Notably, at an unknown sensitivity (as the actual number of cases is unknown), the overall predictive value (PPV) of all tests in Israel was 4.6% at the time our model was conceived. Both the logistic regression and the gradient boosting decision tree versions of our model applied to the Israeli dataset substantially outperforms this PPV at any sensitivity threshold up to 50%. Thus, our model can complement the identification of individuals at high risk for a positive test, who can be further isolated prior to obtaining the test, especially as the number of COVID-19 cases in Israel and other countries rises again, which makes it more challenging for the ministry of health to fulfill the epidemiological investigations of people that were exposed to a new confirmed patient and should be isolated.6
Several studies attempted to simulate and predict different aspects of SARS-CoV-2 infection, such as hospital admissions, diagnosis, prognosis, and mortality risk, using mostly age, body temperature, medical tests, and symptoms.22 Most diagnostic models published to date were based on datasets from China and included complex features that had to be extracted through blood tests and imaging scans.22 In this work, we devised a prediction model that is based solely on self-reported information, and as such it could be easily deployed and used instantly in other countries.
In conclusion, our constructed model predicts COVID-19 PCR test results with high discrimination and calibration. It suggests that several symptoms that are currently not included in the Israeli testing policy should be integrated into revised testing policies. Additionally, our analysis revealed new patterns of interaction that particular symptoms have with age that were not previously described in the literature. Overall, our approach can be utilized worldwide to direct the limited resources toward individuals who are more likely to test positive for SARS-CoV-2 infection, leading to faster isolation of infected patients and therefore to reduced spread of the virus.
Limitations of Study
Our data are biased by Israel’s MOH ever-changing testing policy, such that at some point all of the COVID-19 positively diagnosed participants in our study had to be eligible for a test under that policy, while the tests themselves are not free of erroneous results. Additionally, the Israeli dataset test negative group comprises both test negatives and untested individuals as these two groups were not separable in our dataset; this is not the case in the independent dataset from the US, UK, and Sweden where all participants went through a PCR test. An ideal dataset for purposes of devising a classifier should include a large random sampling of the population, but such data coupled with symptom surveys are currently unavailable at large scale. Accordingly, all the diagnosed responders in our study are not in the first stage of showing symptoms but are in some time lag after diagnosis. The cross-sectional nature of the study could have possessed an issue as different participants are at different stages of the disease and thus could express different severity levels of the infection, but, as can be seen in the independent dataset validation, the model performs well throughout the week preceding the PCR test. Our tool relies on the presence of symptoms and therefore is not applicable for the identification of asymptomatic individuals infected with SARS-CoV-2. In addition, our study is based on self-reports of willing participants and is therefore bound to suffer from some selection bias and non-objective evaluation of symptoms. The bias is significantly reduced in the data collected via the IVR platform, since all residents in the IVR-surveyed cities were actively contacted only once, on the same day and in the same manner. In the online version of the survey, we made attempts to reduce this bias by promoting it in several media outlets and by engaging leaders of underrepresented communities. Finally, as our dataset did not include children and some of the prior medical conditions were not highly prevalent in it, models designed to these specific subpopulations may highlight unique aspects of these groups.
STAR★Methods
Key Resource Table
| REAGENT or RESOURCE | SOURCE | IDENTIFIER |
|---|---|---|
| Deposited Data | ||
| Models and their predicted probabilities in addition to tables of de-identified, aggregated data | This paper | https://github.com/hrossman/Covid19-Survey/tree/master/Triage%20model |
| Software and Algorithms | ||
| python | https://www.python.org/ | Version 3.7.6 |
| sklearn | https://scikit-learn.org/stable/ | Version 0.21.3 |
| xgboost | https://xgboost.readthedocs.io/en/latest/ | Version 1.0.2 |
| shap | https://shap.readthedocs.io/en/latest/ | Version 0.35.0 |
| scipy | https://www.scipy.org/ | Version 1.4.1 |
| zepid | https://zepid.readthedocs.io/en/latest/ | Version 0.8.1 |
| matplotlib | https://matplotlib.org/ | Version 3.1.1 |
| seaborn | https://seaborn.pydata.org/ | Version 0.9.0 |
| Survey source code | Rossman et al. | https://github.com/hasadna/avid-covider |
| Models creation and prediction source code | This paper | https://github.com/hrossman/Covid19-Survey/tree/master/Triage%20model |
Resource Availability
Lead Contact
Further information and requests for resources should be directed to and will be fulfilled by the Lead Contact, Eran Segal (eran.segal@weizmann.ac.il).
Materials Availability
Not relevant.
Data and Code Availability
-
•
Models and their predicted probabilities in addition to tables of de-identified, aggregated data are available at https://github.com/hrossman/Covid19-Survey/tree/master/Triage%20model.
-
•
Source code for the survey is available at https://github.com/hasadna/avid-covider as an open source project, and can be readily adapted to use in other countries.
-
•
Source code for models creation and predictions by our model is available at https://github.com/hrossman/Covid19-Survey/tree/master/Triage%20model.
Experimental Model and Subject Details
This is a retrospective observational study. The survey data for this study was collected through an online website and Interactive Voice Response (IVR) platform that was available to the entire Israeli population and in targeted cities (Table S1), respectively. The survey was anonymous to maintain the privacy of the participants. Since children express different clinical manifestations of COVID-19 infection23 , 24, we decided to focus our analysis only on adults (age above 20 years old). In the arabic version of the survey, the question regarding COVID-19 diagnosis was mistakenly phrased in an ambivalent matter and thus, the responses collected in arabic had to be excluded from the current analysis. Responders from the IVR version of the survey were overall younger and had a lower prevalence of prior medical conditions compared to the online version responders. Other than the age differences, the latter may be partially due to the different modes of questioning between the two versions (STAR Methods). Detailed characteristics of the responders can be found in Table 1 and Table S2.
Methods Details
Survey Construction
The survey includes questions relating to age, gender, prior medical conditions, smoking habits, self-reported symptoms and geographical location (STAR Methods). Questions regarding prior medical conditions and symptoms included in the survey were carefully chosen by a team of medical doctors with a professional background that included epidemiology and public health, Pediatrics, Family medicine and Emergency medicine. The survey was constructed after an extensive literature review of symptoms and medical conditions which were associated with COVID-19. Each participant in the online version of the survey is asked to fill it once a day for himself and for family members that are unable to fill it for themselves (e.g., children and the elderly). This study followed the Transparent Reporting of a Multivariable Prediction Model for Individual Prognosis or Diagnosis (TRIPOD) reporting guideline25.
Unique Identifier
The IVR version of our survey was collected once in each selected city, and thus each responder was questioned once. In the online version of the survey, individuals were encouraged to respond daily, but since responses are anonymous, we cannot strictly identify repeated answers from the same individual. To allow the construction of an integrated dataset from both versions of the survey, without repeating answers from the same individuals, we defined a subset of questions which determine a unique identifier for every response recorded in the online survey. These include information on age, gender, prior medical conditions, smoking habits and geographical location - as answers to these questions are unlikely to change over the time period of our study. Responses that received the same unique identifier were treated as if they were answered by the same individual.
Quality Control and Spam Filtration
To ensure data reliability, responses were filtered by the following criteria; as a first filtration step, if the age is below 0 or above 120 years old, the body temperature is below 35°C or above 43°C or the same unique identifier was assigned to multiple responses within a period of 1 hour - responses were excluded. As a second filtration step, if all symptoms or all prior medical conditions are positive or more than 3 answers are missing - responses were excluded, as they are likely to be spam (Figure 1).
Model’s Datasets
From the online version of the survey, we randomly sampled a single response for each individual that was recognized by the unique identifier we created, and when an individual reported a COVID-19 diagnosis, we randomly sampled one response only from those which included a positive diagnosis answer. A total of 131,166 responses were identified for the extended features model dataset (Figure 1). For the integration of the two survey versions, all 33,737 IVR responses were combined together with all 114 uniquely identified responders in the online version of the survey that self-reported COVID-19 diagnosis and a random sample of 9,901 undiagnosed responders of this version, to maintain the same diagnosis prevalence as in the IVR version (Figure 1). We chose to maintain the IVR prevalence since it best represents the challenge that the MOH was facing at the time, of mostly regional outbreaks. A total of 43,752 responses were eventually included for the primary model dataset.
Handling of Missing Values
Since the only question that responders were allowed to skip was body temperature, we evaluated the gradient boosting decision trees models in two forms, one with missing values in case the question was skipped and another with imputation using the equivalent answer of fever under 38°C since the answer to this question is unlikely to be missing at random, meaning that people that did not measure their body temperature are more likely to not have high fever. We found the latter form to yield better prediction results and therefore imputed missing values as fever under 38°C.
Models Construction
The primary model was constructed using responses to both the IVR and online versions of the survey. Features included in this model were determined by the IVR version, since it included a subset of the online version questions. These consisted of age group, gender, presence of prior medical conditions, general feeling, and the following symptoms: fever, cough, shortness of breath, sore throat and loss of taste or smell.
The extended features model was constructed using only responses from the online version of the survey, as it had 14 additional features that were not available in the IVR version. This extended list added dry cough and moist cough (instead of general cough in the primary model), fatigue, muscle pain, rhinorrhea, diarrhea, nausea or vomiting, chills, confusion and reporting on presence of specific prior medical conditions separately (as opposed to the presence of any of the prior medical conditions in the primary model).
Logistic Regression models were constructed using 4 folds cross-validation and features were imputed with the most frequent answer in each feature. Gradient Boosting Decision Trees models were constructed using a double nested cross-validation, with 4 folds for cross-validation prediction and 2 folds for parameter tuning on the training fold. The final Primary model Gradient Boosting Decision Trees parameters are: colsample_bytree 0.75, learning_rate 0.005, max_depth 4, min_child_weight 7.5, n_estimators 500, subsample 0.8, and extended features model parameters are: colsample_bytree 0.75, learning_rate 0.005, max_depth: 4, min_child_weight 10, n_estimators 1250, subsample 0.75.
The Primary model Logistic Regression final coefficients are; age 0.014646709535756109, prior medical conditions −0.1028191760089675, male 0.2826631001038752, cough 1.4622188235272104, fever 1.0850715346186517, shortness_of_breath 0.9452566400387141, smell_or_taste_loss 2.7695803505943335, sore_throat 0.6710568984809682, feel_well 0.2009252240145963 with an intercept of −5.97106358.
Quantification and Statistical Analysis
auROC and auPR values were calculated using the sklearn.metrics python package (Results, Figures 2, 4, S1).
SHAP analysis was conducted using the shap python package (Results, Figures 5 and 6; Table S6).
Odds ratio values were calculated using the zepid python package with 0.05 alpha (Figure S2; Table S6).
All confidence intervals (CI) in this paper were calculated according to a confidence level of 0.95 using the scipy.stats package (Results, Figures 2, 4, S1, and S2).
Error bars represent the standard deviation of the data and were produced using the seaborn.lineplot python package (Figure 5).
Correlations were calculated using the scipy.statst.pearsonr python package (Results).
n represents the number of responses.
Additional Resources
Online survey website: https://coronaisrael.org/en/
Acknowledgments
E.S. is supported by the Crown Human Genome Center, Larson Charitable Foundation New Scientist Fund, Else Kroener Fresenius Foundation, White Rose International Foundation, Ben B. and Joyce E. Eisenberg Foundation, Nissenbaum Family, Marcos Pinheiro de Andrade and Vanessa Buchheim, Lady Michelle Michels, and Aliza Moussaieff and grants funded by the Minerva foundation with funding from the Federal German Ministry for Education and Research and by the European Research Council and the Israel Science Foundation. H.R. is supported by the Israeli Council for Higher Education (CHE) via the Weizmann Data Science Research Center and by a research grant from Madame Olga Klein – Astrachan. We thank the following for their contributions to our efforts: Y. Landau, T. Eldar, S. Kasem, T. Bria, S. Avraham, B. Kirel, A. Terkeltaub, N. Kalkstein, E. Krupka, M. Loitsker, Y. Sela, T. Bareia, J. Shalev, A. Brik, L. Samama, S. Cohen, J. Bitton, R. Priborkin, G. Beryozkin, G. Dardyk, S. Lanzman, N. Epstein, N. B. Shizaf, E. Daian, M. Bialek, M. Suleiman, R. Maor, Z. Maor, Y. Dinur, J. Klinger, R. Zaida, M. Eden, N. Hirshman, O. Dovev, Y. Grossman, and the Public Knowledge Workshop (“Hasadna”).
Author Contributions
S.S, T.K., A.K., S.S. and H.R. conceived the project, designed and conducted the analyses, interpreted the results, and wrote the manuscript. A.G., T.M., A.L., D.K., I.K. and A.G. designed and conducted the survey. O.C. directed the organizational and logistic efforts. A.K., O.H., M.Z.A., N.C., A.E.Z., and A.I. designed and conducted the survey as well as provided the data. B.G., D.H., V.S., R.B. and E.S. conceived, directed, and supervised the project and analyses.
Declaration of Interests
The study protocol was approved by the Weizmann Institute of Science review board (IRB). Informed consent was waived by the IRB, as all identifying details of the participants were removed before the computational analysis. Participants were made fully aware of the way in which the data will be stored, handled, and shared, which was provided to them and is in accordance with the privacy and data-protection policy of the Weizmann Institute of Science (https://www.weizmann.ac.il/pages/privacy-policy).
Published: October 10, 2020
Footnotes
Supplemental Information can be found online at https://doi.org/10.1016/j.medj.2020.10.002.
Supplemental Information
References
- 1.Xie J., Tong Z., Guan X., Du B., Qiu H., Slutsky A.S. Critical care crisis and some recommendations during the COVID-19 epidemic in China. Intensive Care Med. 2020;46:837–840. doi: 10.1007/s00134-020-05979-7. [DOI] [PMC free article] [PubMed] [Google Scholar]
- 2.Grasselli G., Pesenti A., Cecconi M. Critical Care Utilization for the COVID-19 Outbreak in Lombardy, Italy: Early Experience and Forecast During an Emergency Response. JAMA. 2020;323:1545–1546. doi: 10.1001/jama.2020.4031. [DOI] [PubMed] [Google Scholar]
- 3.Kucirka L.M., Lauer S.A., Laeyendecker O., Boon D., Lessler J. Variation in False-Negative Rate of Reverse Transcriptase Polymerase Chain Reaction-Based SARS-CoV-2 Tests by Time Since Exposure. Ann. Intern. Med. 2020;173:262–267. doi: 10.7326/M20-1495. [DOI] [PMC free article] [PubMed] [Google Scholar]
- 4.Coronavirus Testing Basics https://www.fda.gov/consumers/consumer-updates/coronavirus-testing-basics.
- 5.Sheridan C. COVID-19 spurs wave of innovative diagnostics. Nat. Biotechnol. 2020;38:769–772. doi: 10.1038/s41587-020-0597-x. [DOI] [PubMed] [Google Scholar]
- 6.Israeli Ministry of Health. https://maintenance.gov.il.
- 7.Zhao X., Zhang B., Li P., Ma C., Gu J., Hou P., Guo Z., Wu H., Bai Y. Incidence, clinical characteristics and prognostic factor of patients with COVID-19: a systematic review and meta-analysis. medRxiv. 2020 doi: 10.1101/2020.03.17.20037572. [DOI] [Google Scholar]
- 8.Mei X., Lee H.C., Diao K.Y., Huang M., Lin B., Liu C., Xie Z., Ma Y., Robson P.M., Chung M., et al. Artificial intelligence-enabled rapid diagnosis of patients with COVID-19. Nat. Med. 2020;26:1224–1228. doi: 10.1038/s41591-020-0931-3. [DOI] [PMC free article] [PubMed] [Google Scholar]
- 9.Götzinger F., Santiago-García B., Noguera-Julián A., Lanaspa M., Lancella L., Calò Carducci F.I., Gabrovska N., Velizarova S., Prunk P., Osterman V., et al. ptbnet COVID-19 Study Group COVID-19 in children and adolescents in Europe: a multinational, multicentre cohort study. Lancet Child Adolesc. Health. 2020;4:653–661. doi: 10.1016/S2352-4642(20)30177-2. [DOI] [PMC free article] [PubMed] [Google Scholar]
- 10.Soltan A.A., Kouchaki S., Zhu T., Kiyasseh D., Taylor T., Hussain Z.B., Peto T., Brent A.J., Eyre D.W., Clifton D. Artificial intelligence driven assessment of routinely collected healthcare data is an effective screening test for COVID-19 in patients presenting to hospital. medRxiv. 2020 doi: 10.1101/2020.07.07.20148361. [DOI] [Google Scholar]
- 11.Rossman H., Keshet A., Shilo S., Gavrieli A., Bauman T., Cohen O., Shelly E., Balicer R., Geiger B., Dor Y., Segal E. A framework for identifying regional outbreak and spread of COVID-19 from one-minute population-wide surveys. Nat. Med. 2020;26:634–638. doi: 10.1038/s41591-020-0857-9. [DOI] [PMC free article] [PubMed] [Google Scholar]
- 12.The Gertner Institute. http://www.gertnerinst.org.il/.
- 13.Drew D.A., Nguyen L.H., Steves C.J., Wolf J., Spector T.D., Chan A.T., COPE Consortium Rapid implementation of mobile technology for real-time epidemiology of COVID-19. medRxiv. 2020 doi: 10.1101/2020.04.02.20051334. [DOI] [PMC free article] [PubMed] [Google Scholar]
- 14.Segal E., Zhang F., Lin X., King G., Shalem O., Shilo S., Allen W.E., Alquaddoomi F., Altae-Tran H., Anders S., et al. Building an international consortium for tracking coronavirus health status. Nat. Med. 2020;26:1161–1165. doi: 10.1038/s41591-020-0929-x. [DOI] [PubMed] [Google Scholar]
- 15.Chen T., Guestrin C. Proceedings of the 22nd ACM SIGKDD International Conference on Knowledge Discovery and Data Mining - KDD ’16. ACM Press; 2016. XGBoost: A Scalable Tree Boosting System; pp. 785–794. [Google Scholar]
- 16.Lundberg S.M., Erion G., Chen H., DeGrave A., Prutkin J.M., Nair B., Katz R., Himmelfarb J., Bansal N., Lee S.I. From Local Explanations to Global Understanding with Explainable AI for Trees. Nat. Mach. Intell. 2020;2:56–67. doi: 10.1038/s42256-019-0138-9. [DOI] [PMC free article] [PubMed] [Google Scholar]
- 17.Harapan H., Itoh N., Yufika A., Winardi W., Keam S., Te H., Megawati D., Hayati Z., Wagner A.L., Mudatsir M. Coronavirus disease 2019 (COVID-19): A literature review. J. Infect. Public Health. 2020;13:667–673. doi: 10.1016/j.jiph.2020.03.019. [DOI] [PMC free article] [PubMed] [Google Scholar]
- 18.Yan L., Zhang H.-T., Xiao Y., Wang M., Sun C., Liang J., Li S., Zhang M., Guo Y., Xiao Y., et al. Prediction of survival for severe Covid-19 patients with three clinical features: development of a machine learning-based prognostic model with clinical data in Wuhan. medRxiv. 2020 doi: 10.1101/2020.02.27.20028027. [DOI] [Google Scholar]
- 19.Gudbjartsson D.F., Helgason A., Jonsson H., Magnusson O.T., Melsted P., Norddahl G.L., Saemundsdottir J., Sigurdsson A., Sulem P., Agustsdottir A.B., et al. Spread of SARS-CoV-2 in the Icelandic Population. N. Engl. J. Med. 2020;382:2302–2315. doi: 10.1056/NEJMoa2006100. [DOI] [PMC free article] [PubMed] [Google Scholar]
- 20.Menni C., Valdes A., Freydin M.B., Ganesh S., El-Sayed Moustafa J., Visconti A., Hysi P., Bowyer R.C.E., Mangino M., Falchi M., et al. Loss of smell and taste in combination with other symptoms is a strong predictor of COVID-19 infection. medRxiv. 2020 doi: 10.1101/2020.04.05.20048421. [DOI] [Google Scholar]
- 21.Yan C.H., Faraji F., Prajapati D.P., Boone C.E., DeConde A.S. Association of chemosensory dysfunction and COVID-19 in patients presenting with influenza-like symptoms. Int. Forum Allergy Rhinol. 2020;10:806–813. doi: 10.1002/alr.22579. [DOI] [PMC free article] [PubMed] [Google Scholar]
- 22.Wynants L., Van Calster B., Collins G.S., Riley R.D., Heinze G., Schuit E., Bonten M.M.J., Damen J.A.A., Debray T.P.A., De Vos M., et al. Prediction models for diagnosis and prognosis of covid-19 infection: systematic review and critical appraisal. BMJ. 2020;369:m1328. doi: 10.1136/bmj.m1328. [DOI] [PMC free article] [PubMed] [Google Scholar]
- 23.Dong Y., Mo X., Hu Y., Qi X., Jiang F., Jiang Z., Tong S. Epidemiological characteristics of 2143 pediatric patients with 2019 coronavirus disease in China. Pediatrics. 2020;58:712–713. [Google Scholar]
- 24.de Souza T.H., Nadal J.A., Nogueira R.J.N., Pereira R.M., Brandao M.B. Clinical Manifestations of Children with COVID-19: a Systematic Review. medRxiv. 2020 doi: 10.1101/2020.04.01.20049833. [DOI] [PMC free article] [PubMed] [Google Scholar]
- 25.Collins G.S., Reitsma J.B., Altman D.G., Moons K.G.M. Transparent reporting of a multivariable prediction model for individual prognosis or diagnosis (TRIPOD): the TRIPOD statement. BMJ. 2015;350:g7594. doi: 10.1136/bmj.g7594. [DOI] [PubMed] [Google Scholar]
Associated Data
This section collects any data citations, data availability statements, or supplementary materials included in this article.
Supplementary Materials
Data Availability Statement
-
•
Models and their predicted probabilities in addition to tables of de-identified, aggregated data are available at https://github.com/hrossman/Covid19-Survey/tree/master/Triage%20model.
-
•
Source code for the survey is available at https://github.com/hasadna/avid-covider as an open source project, and can be readily adapted to use in other countries.
-
•
Source code for models creation and predictions by our model is available at https://github.com/hrossman/Covid19-Survey/tree/master/Triage%20model.