Abstract
In this study, we propose the use of surface-enhanced Raman spectroscopy (SERS) to determine spectral markers for recognition of heparin-induced thrombocytopenia (HIT), a difficult-to-diagnose immune-related complication that often leads to limb ischemia and thromboembolism. The ability to produce distinct molecular signatures without requiring addition of exogenous labels enables unbiased inquiry and makes SERS an attractive complementary diagnostic tool for various complex pathologies. Here, we report a new capillary tube-derived SERS platform that offers ultrasensitive, label-free measurement capability as well as efficient handling of blood serum samples. The developed platform shows excellent reproducibility and long-term stability and, crucially, provides an alternative diagnostic rubric for determination of HIT by leveraging machine-learning based classification of the spectroscopic data. We envision that a portable Raman instrument could be combined with the capillary tube-based SERS analytical tool for rapid determination of HIT in the clinical laboratory - without perturbing the existing diagnostic workflow.
Keywords: Raman spectroscopy, Nanotechnology, Blood, Heparin-induced Thrombocytopenia, Chemometrics
1. Introduction
Heparin is an established anticoagulant therapy in several thrombotic conditions including acute coronary syndrome and deep venous thrombosis.[1] While heparin is highly effective in decreasing morbidity and mortality associated with thrombotic conditions, its use can also lead to severe adverse effects.[2] For instance, heparin-induced thrombocytopenia (HIT) is an immune-mediated complication of heparin therapy and may lead to limb ischemia and gangrene.[3] A sudden decrease in the platelet count (to ca. 50% of the baseline count) of patients receiving heparin treatment is a feature of HIT, even if the nadir remains above 150 × 109/L.[4] Though HIT may manifest as skin lesions at the heparin injection site, the recognition and detection of suspected HIT is often delayed, which significantly increases the disease burden and resource use.[5] Therefore, comprehensive initiatives to detect HIT at an early stage are urgently desired, as they can guide timely interventions and bring about a corresponding reduction in HIT-based complications.[5]
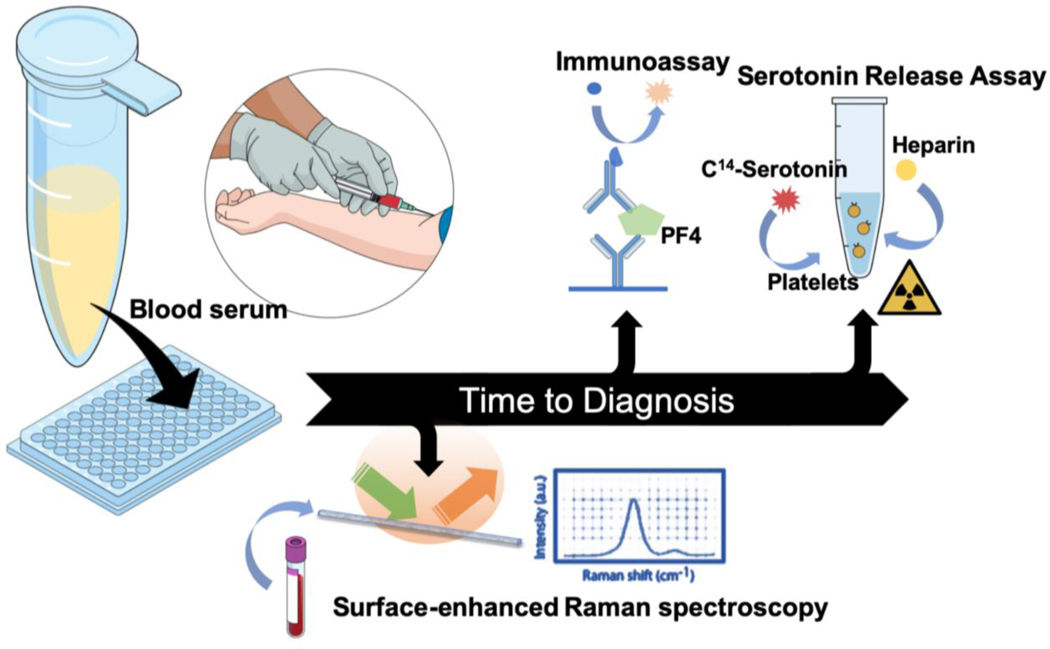
In the present scenario, suspicion of HIT requires immediate validation through a diagnostic workup, which is commonly performed through immunoassays and functional assays.[6] While quantitation of different classes of antibodies at varying thresholds forms the backbone of ELISA-based assays for HIT, variations in measurement conditions as well as physiological variations in the antibody levels from patient-to-patient complicate diagnostic interpretation.[7] Gold standard functional assays such as serotonin release assay (SRA) or the heparin-induced platelet activation assay (HIPA) are resource intensive and have significant turn-around times.[8] Other clinical identification markers, such as thrombosis and decrease in platelet count (part of the 4Ts score), can help in recognizing HIT but need substantial clinical expertise. Additionally, such determination is limited by inter-observer variability and low positive predictive value.[9] Therefore, development of accurate diagnostic platforms for HIT identification that require minimal sample preparation and reduce turn-around time would greatly facilitate treatment decisions at the bedside. Such a platform could complement the existing clinical methods, with the goal of enhancing detection sensitivity and specificity for patients with high-risk 4Ts scores (Figure 1).
Figure 1.
Schematic showing the various assays used for the diagnosis of HIT. In this report, we propose the use of surface-enhanced Raman spectroscopy inside a capillary tube (“SERS-in-a-capillary”) to significantly reduce the turn-around time for HIT diagnosis compared to existing approaches such as immunoassays and serotonin release assay.
Our solution to this need is based on surface-enhanced Raman spectroscopy (SERS) owing to its near-single molecule sensitivity,[10] exquisite molecular specificity,[11] and facile, real-time readout format.[12] The amplification of the inelastic scattering of light in the vicinity of electromagnetic “hotspots” on the plasmonic nanostructures allows for the transduction of biomolecular species of low concentration at the molecular, cellular and tissue levels to measurable spectral signals.[13,14] Driven by the above considerations, SERS has previously been used to detect various molecules in ELISA-style assays rivalling the sensitivity of fluorescence with enhanced multiplexing abilities.[15] One of the most compelling uses of SERS has been in label-free/untargeted detection of biomolecules including antibodies and other entities with complex molecular structures.[16] We and others have used label-free SERS to detect protein-ligand interactions,[17] biologics classification[18] and stoichiometric mixture of proteins[19] at ultra-low concentrations. SERS has also been harnessed for label-free detection of cell-free markers in various body fluids such as blood plasma, urine and saliva.[20–22] Building on these studies, we hypothesize that label-free SERS measurements would provide a snapshot of the totality of all biomolecular species (rather than focusing on a single entity) in the serum specimen and, when combined with multivariate analysis, would capture latent biological differences that are encoded in the vibrational fingerprints. The global molecular profiling makes SERS an excellent explorative and rapid analysis technique especially in cases where little/nothing is known about the molecular ensemble responsible for the pathology.
To specifically handle liquid serum samples, we have designed and fabricated a capillary-based plasmonic substrate with silver nanoparticles that serve as the basis for plasmonic enhancement. A principal concern for detection of biological samples is the maintenance of the native state of biomolecules during the measurement.[23] In addition to retaining the native solution state, our capillary tube-based measurement permits rapid sample analysis – by eschewing complex sample preparation processes – in low sample volumes (as small as 2 μL).
It has been previously suggested that coating plasmonic nanoparticles on the inside walls of glass capillaries could lead to high electromagnetic enhancement enabling small molecule detection while conserving precious specimen.[24,25] The potential of such a construct for designing and controlling SERS for sensing, however, has not been exploited for analyzing complex mixture samples, where a variety of biomolecular species are likely to contribute to the acquired spectral profile. We reasoned that a plasmonic capillary tube may provide a promising platform for analysis of clinical serum samples overcoming the well-known limitations of solid substrate-based measurements.[26] The enabling innovation of the proposed SERS-in-a-capillary platform is the integration of our facile Ag ink-precursor fabrication strategy with standard capillary tubes, which allows highly sensitive molecular detection in clinical samples drawn into and in contact with the nanoparticle-coated tube.
In this study, SERS-in-a-capillary measurements were performed in sera acquired from a total of 34 post-operative patients, 11 of who were confirmed to be HIT-positive through independent SRA. By correlating the recorded spectra with SRA diagnosis, we have developed leave-one-out classification models, which show high diagnostic power (with sensitivity and specificity of 86 and 81%, respectively) for detection of HIT cases. Owing to its diagnostic performance, lack of any sample preparation requirements as well as elimination of observer bias, the proposed method may offer a promising tool for diagnosing HIT in the clinical setting. With further refinement, this tool can be particularly useful for patients whose diagnosis is currently missed due to unresolved issues with the 4Ts score, antibody tests and time-intensive functional assays as well as wrongly diagnosed non-HIT patients.
2. Results and discussion
We have developed a label-free SERS-in-a-capillary platform that can measure spectral signatures from patient blood sera with the goal of aiding in rapid identification of heparin-induced thrombocytopenia (HIT). The occurrence of HIT is an immune response to heparin resulting in a cascade of molecular events with IgG antibodies recognizing neoepitopes on positively charged chemokine PF4 in PF4-polyanion complexes.[27] The accompanying activation of platelets and increased thrombin production lead to clinical complications. Diagnostic tests such as anti-PF4-heparin enzyme immunoassay or a functional test, e.g. platelet-activation assay and serotonin-release assay, probe specific features of this complex cascade of events with varying degrees of sensitivity. We reasoned that the involvement of different biomolecules with characteristic Raman signatures in HIT-positive patient sera may provide a unique opportunity to interrogate the specimen for pathological identification without individually targeting any of them. The subtle molecular variations should be recorded in the highly sensitive SERS measurements that can then be analyzed using established chemometric methods.
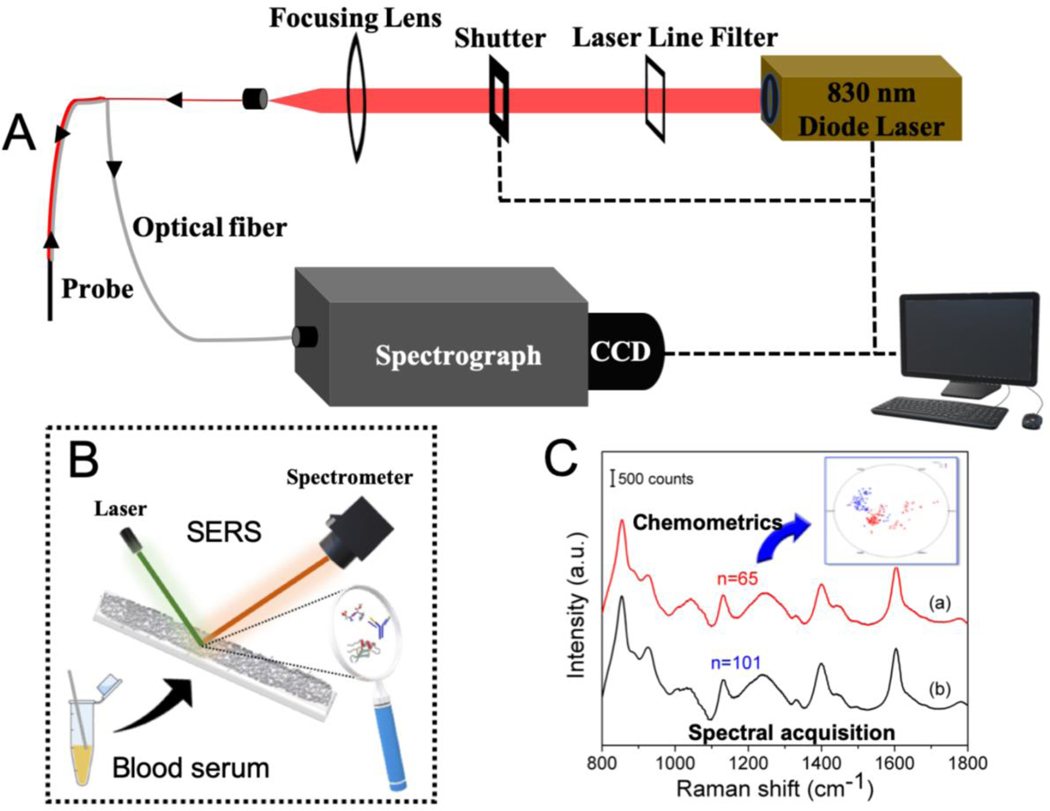
Based on this hypothesis, we focused on the following objectives in this study: 1) design and fabrication of SERS-in-a-capillary platform for efficient sample handling and data acquisition from patient blood serum; and 2) building a classifier for spectroscopic identification of HIT-positive samples. The schematic of the instrumentation and diagnostic procedure is given in Figure 2.
Figure 2.
(A) Schematic of the portable Raman instrument and the fiber-optic probe used for collection of the SERS spectra from the serum samples. Experimental setup features an 830 nm NIR laser, a f/1.8i spectrograph and a TE-cooled CCD camera along with the customized Raman probe for delivery of light to and from the sample. (B) Method for recording spectra from the sample drawn inside the SERS-in-a-capillary platform. (C) Illustration of the collected SERS spectra and subsequent chemometric analysis for classification between HIT- positive and HIT-negative samples.
-
1)
Design and fabrication of SERS-in-a-capillary platform
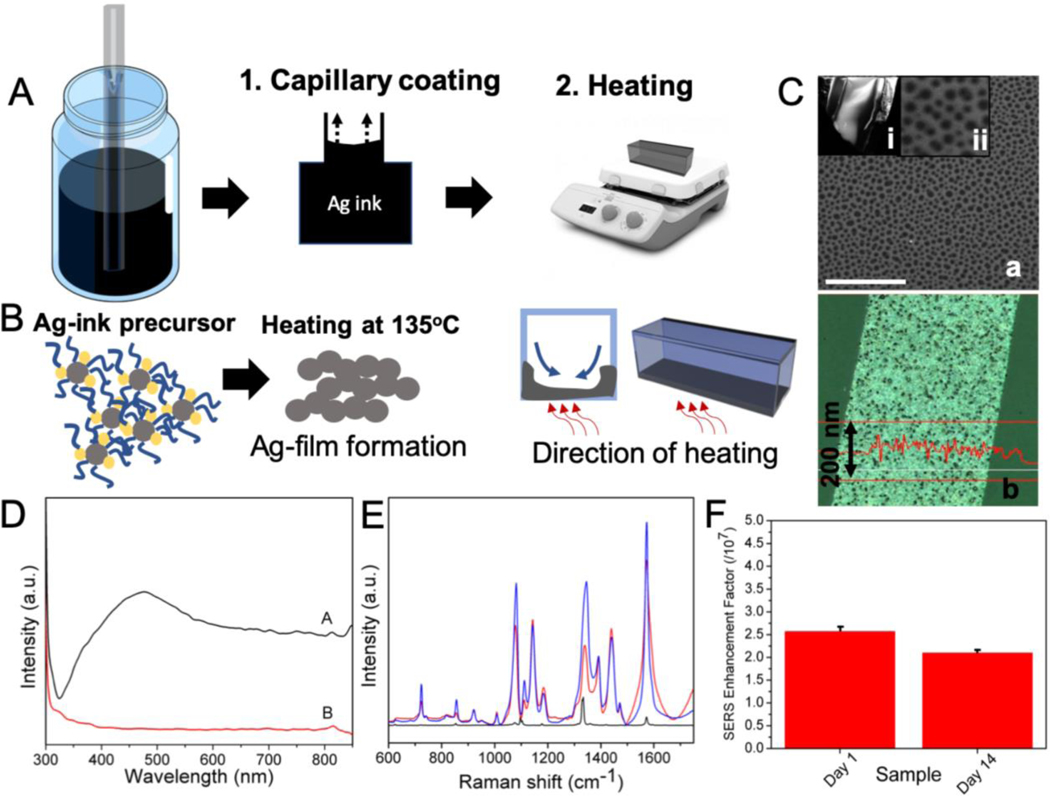
While previous studies have suggested different routes for assembling nanoparticles inside a capillary,[24, 25] we propose here a simpler fabrication approach that features single-step, rapid growth of bare silver nanoparticle film on the capillary wall. Specifically, we employed a solution processed, in situ reduction route to generate the plasmonic coating. The liquid Ag ink precursor is drawn in by capillary action, and subsequently heated to form uniform Ag films.[28] Shape of the capillary tube and dilution of the Ag ink form the key parameters in determining the thickness of the Ag film. We observed that only square capillaries - and not the round ones - ensured the integrity of the Ag coating during the heating process. Following completion of the heating step, the precursor did not leave any trace organic impurities making it ideal for label-free SERS measurements, where direct nanoparticle-analyte contact is necessary for optimal enhancement. The process of the silver film formation in the capillary tube is shown in Figure 3A and 3B, and the FESEM images of the Ag-film and its UV-visible spectrum showing the expected plasmon peak at ca. 475 nm are provided in Figure 3C and 3D, respectively. Notably, the silver film is formed on only one side of the square capillary tube (the side that is in contact with the hot plate; Figure S1) and is composed of nanoholes of diameter ranging between 50–100 nm, which are formed due to the escape of the solvent bubbles during heating. In addition to the nanoholes, the FESEM images (Figure S1C) also show the presence of coalesced nanoparticles in the Ag film. The edges of the holes as well as these nanoparticles are responsible for the plasmonic nature of the film, as detailed in one of our previous publications.[29] The thickness of the film can be easily controlled by changing the dilution of the silver ink (further details provided in SI). The primary advantage of this fabrication method is that it eliminates complex, expensive and time-intensive processing steps such as lithography, physical vapor deposition and intricate self-assembly of functionalized nanoparticles.
Figure 3.
(A) Schematic outlining the steps involved in the formation of silver nanoparticle coating in the SERS-in-a-capillary substrate. The steps involved are: coating of the capillary tube with the Ag- ink precursor; and heating. (B) The process of formation of the Ag-film involves the thermal degradation of the Ag-ink precursor. The direction of heating determines the side of the capillary that gets coated with the Ag-film. (C) (a) FESEM images of the Ag-film inside the capillary tube through an obliquely broken edge (i). The Ag-film shows nanohole arrays of around 50–100 nm in diameter (ii). Scale bar shown in SEM image corresponds to 1 micron. (b) The optical profilometry image of the Ag-film showing an average thickness of 115 nm. (D) The UV-vis spectra of the capillary coated with Ag-film (black) and Ag-ink (red) shows the presence and absence of surface plasmon peak at ca. 475 nm for the Ag-film and the Ag-ink, respectively. (E) Averaged SERS spectra of 4-NTP (1 × 10⁻⁴ M) acquired from freshly prepared SERS-in-a-capillary substrates (blue) and substrates aged for two weeks (red). Raman spectrum of 4-NTP in powder form is shown in black. (F) The calculated SERS enhancement factors corresponding to the freshly prepared and aged (2 weeks) SERS-in-a-capillary substrates.
The SERS performance of the capillary tubes is also dependent upon the ratio of silver ink to isopropanol ratio (Figure S2). The dilution with isopropanol ensures dewetting of the precursor film and, hence, dictates the uniformity of the film as well as the nanoparticle spacing. The SERS enhancement was ascertained by using 4-Nitrothiophenol (4-NTP), a commonly used non-fluorescent Raman reporter, and also Rhodamine 6G (R6G) (Figure S2). Measurements of different concentrations of 4-NTP solution revealed sub-nanomolar limit of detection showcasing its utility for label-free, sensitive biomolecular measurements (Figure S3). To test the reproducibility of the SERS-in-a-capillary platform, 16 capillary tubes from four different fabrication batches were selected. From the recorded spectral profiles of 4-NTP (Figure 3E), we estimate an enhancement factor of ~2.5 × 10⁷ with standard deviation of less than 5% (Figure 3F). Additionally, long-term stability of the SERS substrate is critical in determining its suitability for diagnostic applications. Here, the stability of the substrate was studied by comparing the spectral signals from a freshly prepared SERS-in-a-capillary tube and from another that was
-
2)
Spectral acquisition and data analysis for HIT diagnosis
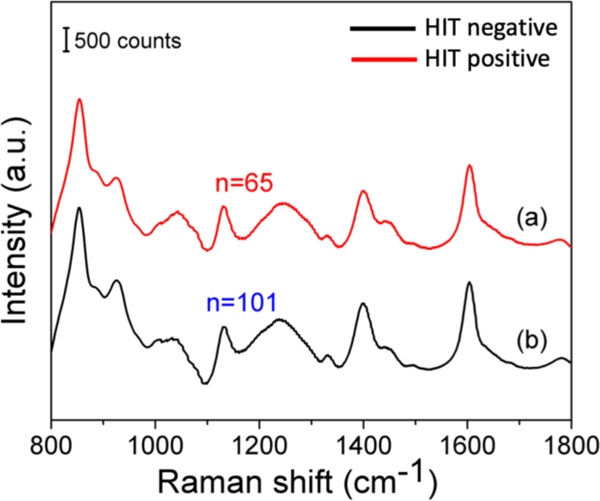
The SERS spectra obtained from the patient sera exhibited vibrational features consistent with the expected molecular composition of these samples.[30] The capillary geometry and constant liquid volume (due to the absence of evaporation) ensure that the spectral variability arises principally from the molecular entities. Additionally, for biological samples with protein content, it is imperative that the spectra are collected in the native (hydrated) state, which is guaranteed by the capillary-based measurements. The capillary also permits uniform sample spread over the Ag film, and spectral collection from small volumes of serum. Figure 4 shows the comparison of the average SERS spectrum of serum samples from HIT-positive and HIT-negative subjects. The strong plasmonic enhancement of the capillary substrate assured high signal-to-noise ratios in the recorded spectra.
Figure 4.
Comparison of the mean SERS spectra obtained from the serum samples of HIT-positive patients (a) and that of HIT-negative patients (b). stored at room temperature for two weeks after fabrication (Figure 3E). The similarity in the spectral profiles acquired from these two capillaries speaks to relatively long shelf-life of the prepared substrates.
The presence of a heterogeneous mixture of biomolecular constituents leads to a significant overlap of vibrational modes observed in the SERS data. We observe that the recorded spectra display broad peaks, which can be attributed to the presence of macromolecules (mol.wt.>10kDa) and the accompanying formation of hydrogen bonds in the solution state.[31] Characteristic SERS peaks corresponding to proteins were observed at 855 ((C-C) stretching and (CCH) deformation ring breathing of proline, tyrosine), 1239 (amide III, arising from coupling of C-N stretching and N-H bonding), and 1604 cm−1 (C=C in-plane bending mode of phenylalanine, ring C-C stretch of phenyl, tyrosine, C=C (protein)) from both HIT-positive and negative spectra. Modes corresponding to other serum components such as lipids were also identified. Detailed band assignment is provided in Table-S1 (Supplementary Information).
To evaluate the capability of SERS for differentiating between HIT-positive and negative samples, three chemometric methods, namely PC-LDA, PLS-DA, and Lasso-DA, were employed.
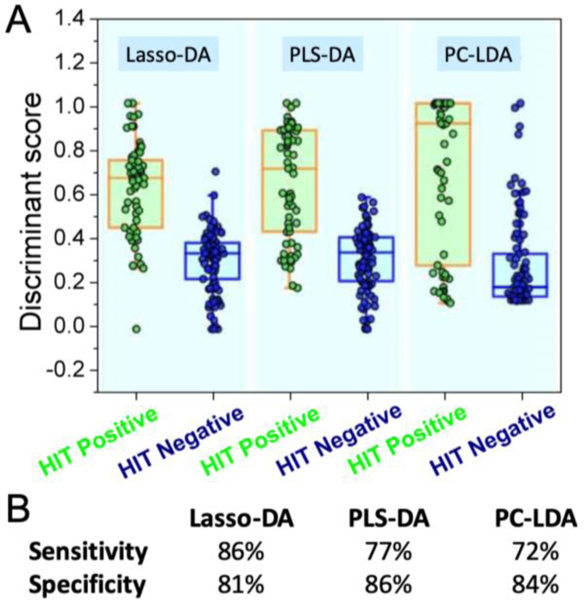
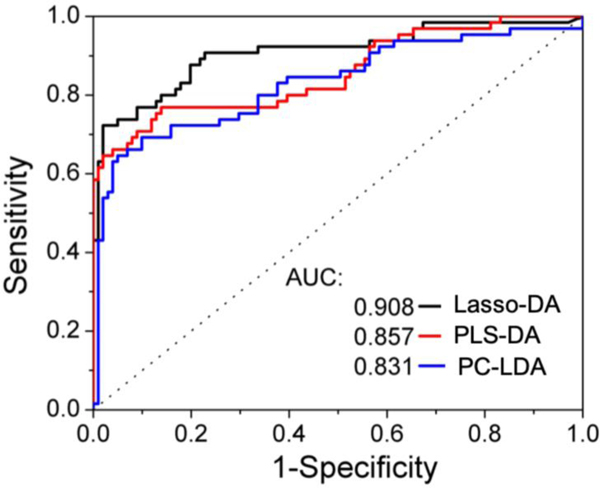
Figure 5A illustrates the column scatter figures of discriminant scores corresponding to the three chemometric models for HIT classification. The intra-class variability seen in Fig. 5(A) is a function of the variance of spectral data recorded from the clinical specimens and the chosen analytical method. Compared with the other two methods, Lasso-DA offers better differentiation between the two groups of HIT suspected patients (Figure 5B). It is worth mentioning that all the three models were cross-validated using a leave-one-out algorithm to avoid the potential risk of overfitting. Receiver operating characteristic (ROC) curves (Figure 6) were generated to assess the diagnostic ability of the three binary classifiers as the discrimination threshold is varied, and area under the curve (AUC) values was calculated in each case. The computed AUC values were 0.831 (PC-LDA), 0.857(PLS-DA), and 0.908 (Lasso-DA), respectively.
Figure 5.
(A) Comparison of classifiers based on SERS spectra for discriminating HIT-positive (n=65) from HIT-negative cases (n=101). (B) Sensitivity and specificity measures of these classifiers.
Figure 6.
ROC curve for the Lasso-DA, PLS-DA and PC-LDA for the diagnosis of HIT based on the SERS spectral data. The x- and y-axis represent the sensitivity and 1-specificity rates, respectively. The ROC curve of two indistinguishable populations, represented by the dashed line, is included for comparison. The area under the curve (AUC) values are provided in the legend for the three classifiers; the AUC for a perfect algorithm is 1.
Together, our findings underscore the promise of the SERS-in-a-capillary technique for differentiating HIT-positive and HIT-negative sera. While modern diagnostic algorithms for analysis of the 4Ts scores and ELISA immunoassays have eliminated the need of SRA testing in 90% of the patients,[32] this spectroscopic approach with further refinement would provide a complementary tool for rapid and robust HIT diagnosis.
3. Conclusions
This work describes a novel SERS-in-a-capillary platform for the diagnosis of heparin-induced thrombocytopenia from the blood serum of post-operative patients. The approach relies on the deposition of a uniform layer of plasmonic silver nanoparticles on the capillary walls through precursor deposition and subsequent heating. The lack of derivatization of the nanostructures and minimization of sample pre-processing provides a direct analytical setup compatible with clinical settings. Our data from the patient sera suggest that the SERS-in-a-capillary platform, in conjunction with chemometric methods, offers competitive diagnostic accuracy in recognizing HIT to that of existing immunoassays. The proposed approach has the potential to improve patient care due to the significantly shorter turn-around time and by eliminating the need for an alternative and costly anticoagulant.
In the near future, our experiments will focus on developing a deeper understanding of the influence of clinical factors including administered heparin type, patient type (surgical, medical or pregnancy/neonatal), gender and malignancy [33] on the acquired spectra. Additionally, we will seek to employ chemometric methods such as support vector machines that are better suited to account for possible non-linear effects (e.g. variations in optical turbidity of blood sera) and spectral interferents.
Supplementary Material
Acknowledgement
This research was supported by the National Institute of Biomedical Imaging and Bioengineering (2-P41-EB015871–31) and the National Institute of General Medical Sciences (DP2GM128198) to I.B. S.S. and Z.H. acknowledge support from the American Society for Laser Medicine & Surgery Research Grant and the China Scholarship Council post-doctoral fellowship, respectively.
References:
- [1].Hochman JS, Wali AU, Gavrila D, Sim MJ, Malhotra S, Palazzo AM, Fuente BDL, Am. Heart J.1999, 138, 313–318. [DOI] [PubMed] [Google Scholar]
- [2].Alban S, Lever R, Mulloy B, Page CP, Heparin - A Century of Progress, Berlin, Heidelberg, Springer Berlin Heidelberg, 2012, pp. 211–263. [Google Scholar]
- [3].Kelton JG, Pathophysiol. Haemo. T. 1986, 16, 173–186. [DOI] [PubMed] [Google Scholar]
- [4].Spinler SA, Thromb J. Thrombolys 2006, 21, 17–21. [DOI] [PubMed] [Google Scholar]
- [5].Menajovsky LB, Am. J. Med. 2005, 118, 21–30. [DOI] [PubMed] [Google Scholar]
- [6].Sun L, Gimotty PA, Lakshmanan S, Cuker A, Thromb. Haemost. 2016, 115, 1044–1055. [DOI] [PubMed] [Google Scholar]
- [7].Nagler M, Bachmann LM, Ten Cate H, ten Cate-Hoek A, Blood, 2016, 127, 546–557. [DOI] [PubMed] [Google Scholar]
- [8].Riggio JM, Cooper MK, Leiby BE, Walenga JM, Merli GJ, Gottlieb JE, Thromb J. Thrombolys 2009, 28, 124–131. [DOI] [PubMed] [Google Scholar]
- [9].Cuker A, Gimotty PA, Crowther MA, Warkentin TE, Blood 2012, 120, 4160–4167. [DOI] [PMC free article] [PubMed] [Google Scholar]
- [10].Le Ru EC, Meyer M, Etchegoin PG, J. Phys. Chem. B. 2006, 110, 1944–1948. [DOI] [PubMed] [Google Scholar]
- [11].Siddhanta S, Thakur V, Narayana C, Shivaprasad SM, ACS Appl. Mater. Interfaces. 2012, 4, 5807–5812. [DOI] [PubMed] [Google Scholar]
- [12].Piorek BD, Lee SJ, Moskovits M, Meinhart CD, Anal. Chem. 2012, 84, 9700–9705. [DOI] [PubMed] [Google Scholar]
- [13].Hu Q, Tay L, Noestheden M, Pezacki JP, J. Am. Chem. Soc. 2007, 129, 14–15. [DOI] [PubMed] [Google Scholar]
- [14].Li M, Zhao F, Zeng J, Qi J, Lu J, Shih W, J. Biomed. Opt. 2014, 19, 111611. [DOI] [PubMed] [Google Scholar]
- [15].Li M, Kang JW, Sukumar S, Dasari RR, Barman I, Chem. Sci. 2015, 6, 3906–3914. [DOI] [PMC free article] [PubMed] [Google Scholar]
- [16].Siddhanta S, Wróbel MS, Barman I, Chem. Commun. 2016, 52, 9016–9019. [DOI] [PubMed] [Google Scholar]
- [17].Karthigeyan D, Siddhanta S, Kishore AH, Perumal SSRR, Agren H, Sudevan S, Bhat AV, Balasubramanyam K, Subbegowda RK, Kundu TK, Narayana C, P. Natl. Acad. Sci. 2014, 111, 10416–10421. [DOI] [PMC free article] [PubMed] [Google Scholar]
- [18].Paidi SK, Siddhanta S, Strouse R, Mcgivney JB, Larkin C, Barman I, Anal. Chem. 2016, 88, 4361–4368. [DOI] [PubMed] [Google Scholar]
- [19].Keskin S, Kahraman M, Çulha M, Chem. Commun. 2011, 47, 3424–3426. [DOI] [PubMed] [Google Scholar]
- [20].Feng S, Chen R, Lin J, Pan J, Chen G, Li Y, Cheng M, Huang Z, Chen J, Zeng H, Biosens. Bioelectron. 2010, 25, 2414–2419. [DOI] [PubMed] [Google Scholar]
- [21].Del Mistro G, Cervo S, Mansutti E, Spizzo R, Colombatti A, Belmonte P, Zucconelli R, Steffan A, Sergo V, Bonifacio A, Anal. Bioanal. Chem. 2015, 407, 3271–3275. [DOI] [PubMed] [Google Scholar]
- [22].Li X, Yang T, Lin J, J. Biomed. Opt. 2012, 17, 037003. [DOI] [PubMed] [Google Scholar]
- [23].Xu L, Zong C, Zheng X, Hu P, Feng J, Ren B, Anal. Chem. 2014, 86, 2238–2245. [DOI] [PubMed] [Google Scholar]
- [24].Zhang Z, Xiao R, Yang T, Bo X, Wang S, Laser Phys. Lett. 2014, 11, 035603. [Google Scholar]
- [25].Shanthil M, Fathima H, Thomas KG, Appl. Mater. Interfaces 2017, 9, 19470–19477. [DOI] [PubMed] [Google Scholar]
- [26].Mosier-Boss P, Nanomaterials 2017, 7, 142. [DOI] [PMC free article] [PubMed] [Google Scholar]
- [27].Warkentin TE Br. J. Haematol. 2003, 121, 535–555. [DOI] [PubMed] [Google Scholar]
- [28].Huang Z, Nagpal A, Siddhanta S, Barman I, Raman Spectrosc J. 2018, 49, 1552–1558. [Google Scholar]
- [29].Gupta R, Siddhanta S, Mettela G, Chakraborty S, Narayana C, Kulkarni GU, RSC Adv. 2015, 5, 85019–85027. [Google Scholar]
- [30].Bonifacio A, Cervo S, Sergo V, Anal. Bioanal. Chem. 2015, 407, 8265–8277. [DOI] [PubMed] [Google Scholar]
- [31].Hajatdoostand S, J. Yarwood. Appl. Spec. 1996, 50, 558–564. [Google Scholar]
- [32].Zheng G, Streiff MB, Allison D, Takemoto CM, Salimian K, Morris P, Jani J, McCord R, Kickler TS, Int. J. Lab. Hem. 2018, 40, 527–532. [DOI] [PubMed] [Google Scholar]
- [33]. Prandoni P, Falanga A, Piccioli A, Thromb. Res. 2007, 120, S137–S140. [DOI] [PubMed] [Google Scholar]
Associated Data
This section collects any data citations, data availability statements, or supplementary materials included in this article.


