

Abstract
Mass spectrometry (MS) is a powerful technique for characterizing noncanonical nucleobases and other chemical modifications in small RNAs, yielding rich chemical information that is complementary to high-throughput indirect sequencing. However, mass spectra are often prohibitively complex when fragment ions are analyzed following either solution phase hydrolysis or gas phase fragmentation. For all but the simplest cases, ions arising from multiple fragmentation events, alternative fragmentation pathways, and diverse salt adducts frequently obscure desired single-cut fragment ions. Here we show that it is possible to take advantage of predictable regularities in liquid chromatographic (LC) separation of optimized RNA digests to greatly simplify the interpretation of complex MS data. A two-dimensional analysis of extracted compound chromatograms permits straightforward and robust de novo sequencing, using a novel Monte Carlo algorithm that automatically generates bidirectional paired-end reads, pinpointing the position of modified nucleotides in a sequence. We demonstrate that these advances permit routine LC–MS sequencing of RNAs containing noncanonical nucleotides, and we furthermore examine the applicability of this approach to the study of oligonucleotides containing artificial modifications as well as those commonly observed in post-transcriptionally modified RNAs.
Introduction
Cellular RNA is highly modified as a result of diverse post-transcriptional mechanisms. To date, greater than 100 chemically distinct RNA modifications have been observed, with some tRNA molecules displaying noncanonical nucleotides at over 20% of positions.1 These modifications play critical structural and informational roles in rRNA, tRNA, snRNA, and mRNA, and may be important in other regulatory RNA classes and epigenetic processes that are now being elucidated.2 Concomitantly, synthetic modified RNAs have been employed to modulate RNA interference,3 to enhance RNA-protein cross-linking,4 and for therapeutic applications.5 Alternative nucleic acid chemistries have also been extensively investigated in considering plausible prebiotic materials that may have played informational and functional roles in the origins of cellular life.6
Information about chemical modifications is generally lost during indirect sequencing that relies on base complementarity and enzymatic polymerization. Because indirect RNA sequencing typically begins with reverse transcription using an RNA-dependent DNA polymerase, in cases where modifications affect base pairing, the resultant sequence may contain base call ambiguities.7 In cases where modifications do not significantly affect complementarity, no modification information is transmitted to the cDNA intermediate. However, clever indirect sequencing techniques that identify a small number of modifications have been reported, including bisulfite sequencing,8 inosine erasing,9 and methylation-specific immunoprecipitation,10 but each method is specially tailored to probe for the presence of a specific modified nucleotide.
Direct sequencing by MS is complementary to high throughput indirect sequencing, permitting RNA modifications to be routinely detected and identified (for reviews, see the literature11,12). When coupled with chemical13,14 and enzymatic15,16 RNA degradation techniques, matrix-assisted laser desorption ionization (MALDI)17 and electrospray ionization (ESI) MS15 as well as tandem MS18,19 have been widely applied for characterization and sequence confirmation of modified oligoribonucleotides. Exonucleolytic digestion has been used to prepare laddering fragments of an RNA followed by mass analysis by time-of-flight (TOF).20 Acid hydrolysis-based generation of mass ladders has also been used to sequence RNA and to identify modifications.13 Acid hydrolysis can be performed directly in the MALDI matrix, circumventing the need for desalting after mass ladder generation.21 Sequence confirmation for modified L-RNA has also been demonstrated using liquid chromatography (LC) coupled ESI-MS, making use of an end-labeling technique to generate single-ended reads free of internal fragments.22 Nonetheless, no generalized procedure for fragmentation and de novo bidirectional sequencing of modified RNA has been presented.
MS offers rich chemical information in the analysis of RNA modifications with notable caveats. Complications in detecting compound signal above noise, including matrix materials and low-mass contaminants, as well as the low ionization efficiency of small oligonucleotides contribute to low sensitivity and resolution in the relevant low mass range (300–1000 Da, 1–3 nucleotides) using ESI-MS.13,23 There also exist significant methodological inadequacies in the preparation of high quality degradative sequence ladders.23 Ideally, for convenient and unambiguous RNA sequencing, the conditions for sequence ladder formation by fragmentation of an isolated RNA starting material should be optimized such that (a) the RNA of interest is specifically fragmented at a single cleavage site on each nucleotide, (b) the resulting family of fragments have good sequence coverage that is unaffected by sequence content or context, (c) internal fragments resulting from more than one scission event per molecule are minimized, and (d) the degradation conditions are mild enough to minimize modification loss. Under these conditions, base calling can be performed by measuring the mass differences between observed hydrolytic fragments, and searching for this difference in a database generated from known nucleotide masses.13 By comparison, state-of-the-art methods for the direct gas-phase fragmentation of intact RNA samples into mass ladders, such as in-source decay MALDI,24 fail to give uniform bond-specific fragmentation patterns across the RNA phosphate backbone. Despite this, impressive direct sequencing of oligonucleotides by gas-phase fragmentation has been reported,25,26 but recent demonstrations have made use of specialized instrumentation and the resulting spectra remain complicated by product ions arising from multiple fragmentation pathways.
Here we present a generic procedure that permits RNA oligonucleotides to be sequenced directly, without extraneous labeling22,27,28 or reverse transcription29,30 procedures. This method consists of an optimized technique for partial RNA degradation with formic acid, high performance liquid chromatography (HPLC) separation of hydrolytic fragments, online ESI-QTOF mass analysis, and a computational algorithm for read generation from survey mass spectra that generates paired end reads. Together these methods give a simple and robust approach to the sequencing of modified RNA. We further show that in the case of isomeric modifications, such as methylation, the workflow is compatible with tandem MS for disambiguation. Central to the success of the methodology are the formic acid degradation protocol and our ability to correlate fragment masses with chromatographic retention times (RTs), facilitating bidirectional sequencing. With continued improvements in MS sensitivity, we expect this direct sequencing strategy to find utility in pinpointing the chemical identity and position of nucleotide modifications in cellular RNA.
Results
Acid Hydrolysis Generates LC–MS Sequencing Ladders Ideal for Mass Analysis
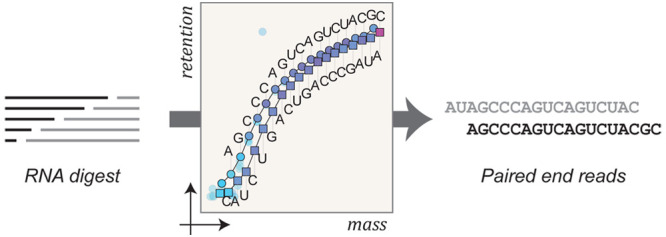
Direct RNA sequencing relies on generating degradative products from a purified starting material (Figure 1a).31 Hydrolytic RNA fragments produced by single scission events are directly sequenceable by observing mass differences between neutral compound masses. While exonucleolytic digestion generates degradative fragments containing the authentic 5′ or 3′ ends of the starting material, endonucleolytic digestion can rapidly hydrolyze single-cut fragments to generate confounding internal fragments. Identification of single-cut fragments can be achieved by end labeling,32 but enzymatic digestion can be inhibited by RNA modifications33 resulting in nonuniform formation rates and sequencing gaps.
Figure 1.
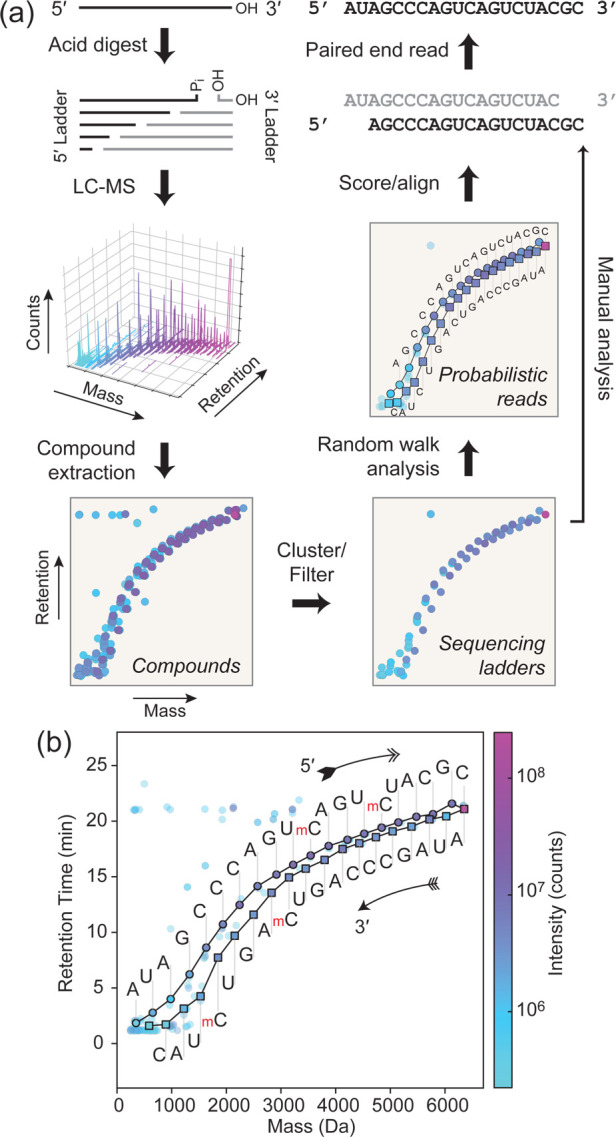
Workflow for direct sequencing of modified RNA. (a) An isolated RNA starting material is partially digested in a manner that predominantly generates single-cut fragments. Compounds are identified and extracted from raw two-dimensional mass vs retention time data. In ion pairing reverse phase HPLC (IP-RP-HPLC), RNA fragment retention time is dominated by backbone phosphate content, generating an elution peak ladder that correlates with mass. Data quality can be improved by clustering or filtering coeluting mass adducts. An algorithm that traverses compound points can then generate bidirectional alignable reads from random walks along proximal mass differences. Alternatively, a manual analysis of this data set can verify the algorithm’s results or disambiguate impurities in the starting material. (b) A sequenced synthetic RNA (R2, AUAGCCCAGUm5CAGUm5CUACGC) containing two 5-methylcytosine (mC) nucleobases. Solid lines indicate walks automatically traversed by the sequencing algorithm between compounds indicated in black-outlined circles and squares. Letters indicate the base calls made using mass differences observed for each step, with the upper and lower sets arising from the sequencing ladders containing the original 5′ end (5′ ladder, circle) and 3′ end (3′ ladder, square), respectively, of the starting material.
Alternatively, acidic conditions favor RNA hydrolysis (Scheme 1).34 Each phosphodiester hydrolysis event produces a 5′ fragment with terminal 3′(2′)-monophosphate isomers and a 3′ fragment with a 5′-hydroxyl. The reaction proceeds by nucleophilic attack of the ribose 2′-hydroxyl on the vicinal 3′-phosphodiester, resulting in a pentacoordinate transition state that can, in part, resolve by cleavage of the 5′-ester of the subsequent nucleotide, releasing a newly generated 5′-hydroxyl and yielding a cyclic 2′,3′-phosphate intermediate. Water addition to this cyclic species then gives a fragment terminating in a ribonucleotide 3′(2′)-monophosphate with a forward rate that is substantially faster than the equivalent hydroxide mediated reaction.34 In this work, we denote the single-cut sequence ladder having the original 5′ end as the “5′ ladder” and the sequence ladder containing the original 3′ end as the “3′ ladder” (Figure 1a).
Scheme 1. General Reaction Scheme for Acid-Mediated Hydrolysis of Ribonucleotide Phosphodiesters.

We designed a series of RNA oligonucleotides (R1–R8 in Table S1) as models to optimize the method. Limited acid hydrolysis of the RNA phosphodiester backbone produced two ladders with newly generated 3′ and 5′ ends. To separate these fragments by HPLC, we employed a neutral pH mobile phase containing 1,1,1,3,3,3-hexafluoro-2-propanol (HFIP) and triethylamine (TEA) that has been demonstrated to give good separation of small RNAs by length.35 Since retention in a methanol gradient was dominated by phosphate number rather than base composition, this convenient feature allowed for relatively simple disambiguation of the ladder identity of observed fragments. Sequence ladders of the base-modified RNA R2 having two 5-methylcytosines in positions 11 and 15 were separated and are shown as a plot of extracted ion chromatogram “compounds” (Figure 1b). The ladders eluted along a sigmoidal mass vs RT curve, with clear separation between 5′ and 3′ ladders (the ladder of fragments containing the original 5′ and 3′ ends, respectively), with the former showing an increase in RT.
Since fragments containing the original 5′ end retain a terminal 3′(2′)-monophosphate following acid hydrolysis, the 5′ ladder shows increased RT relative to fragments in the 3′ ladder of the same sequence length. The inset in Figure S2 shows terminal loss fragments starting from an RNA with cytidine at both termini. Fragments resulting from single cleavage event showed distinct RT despite having the same base composition, differing only by a single terminal 3′(2′)-phosphate. This RT shift would be more pronounced for a species carrying additional 5′ charged groups, such as a 5′-phosphate, triphosphate, or capping group found in native cellular RNAs, further separating the fragments with the authentic 5′ end from all others.
Because acid hydrolysis can rapidly generate internal fragments by multiple scission events from a starting molecule, we optimized the reaction to generate predominantly single-cut fragments (Figure 2). Formic acid (FA, pKa = 3.77) is a mild and volatile organic acid used extensively in MS because it has a low boiling point (100.8 °C) and can therefore easily be removed by lyophilization.36 The 20-nt RNA R1 degraded with a first-order rate constant of 3.1 h–1 at 50 μM in 50% (v/v) formic acid at 40 °C. The extent of hydrolysis was controlled by varying the treatment time, which was terminated by flash-freezing and lyophilization. The abundance of single-cut ladder fragments initially increased followed by a decrease due to overdigestion, while the intensity of the full length material monotonically decreased and was nearly undetectable at 120 min (Figure 2a,c). We detected 38 of the 39 expected single-cut fragments of this 20-nt RNA (Figure 2e). The 3′ terminal nucleoside ionized too weakly for assignment with stringent thresholding; generally, ionization efficiency diminished with decreasing length. During the first 5 min the single-cut fragments had higher intensities than the internal fragments, but by 15 min the prevalence of internal fragments began to outstrip some single-cuts (Figure 2b,d). Given these considerations, we chose 5 min as the optimal treatment time for a 20-nt RNA. In principle, this treatment time should be inversely adjusted for RNAs of different length.
Figure 2.

Optimizing formic acid digestion to yield single-cut RNA fragments. (a) Heat map of single-cut fragment intensities in the 5′ ladder of the 20-nt RNA R1 (AUAGCCCAGUCAGUCUACGC) generated by digestion in 50% (v/v) formic acid at 40 °C. The intensities were normalized to the highest observed intensity for each fragment over a 120 min formic acid treatment. The point spacing for the time axis is shown in panel b, and the measured fragment masses set the point spacing on the mass axis. (b) Absolute intensities for selected ladder fragments arising from either one hydrolysis event (magenta) or more than one hydrolysis event (cyan) for R1. The desired single-cut fragments arise from hydrolysis of one phosphodiester bond at any position in the starting material, while undesired internal fragments arise from additional hydrolysis. (c) Normalized intensities for selected ladder fragments in the 5′ ladder over time. (d) Normalized intensities for all ladder fragments in the 5′ ladder for a 5 min (circle), 15 min (triangle) and 30 min (square) formic acid treatments. (e) Number of ladder fragments for both sequence ladders of R1 arising from one hydrolysis event (magenta) or more than one hydrolysis event (cyan) as a function of increasing formic acid treatment time. The dashed line represents the theoretical maximum number of desired fragments (39 fragments), of which we assigned 38 with stringent thresholding. The internal fragments were calculated as the number of possible fragments with unique mass. Experiments were run in triplicates, and error bars represent s.e.m.
This hydrolysis condition is less acidic and at a lower temperature than a reported protocol suggesting the use of 0.75% trifluoroacetic acid (pKa = 0.23) for use in MALDI13 and yet achieves significantly better bidirectional overlapping sequence coverage for the same sample treatment time. We did not detect significant acid-mediated reactions of canonical or noncanonical nucleotides used here, suggesting that this procedure is suitable for routine use. However, unhindered primary alcohols may be formylated under these conditions,37 a product we observed on an artificially 3′ Cy3 dye labeled RNA oligonucleotide (R4), which contains a 3′ terminal propanol group as an artifact of solid phase synthesis (Figure S3, see Table S1 for structure). The ribose 5′-hydroxyl formylation product was not typically observed in significant abundance, but a +CO mass addition could nevertheless be considered a neutral adduct during analysis.
Computational Algorithm to Read Modified RNA Sequences
RNA sequencing reads were generated de novo from compounds identified by their mass, RT, and abundance. The algorithm proceeds by generating compounds by molecular feature extraction, clustering related mass adducts appearing at similar RT, and filtering the final set of compounds by number of observed charge states and other factors (Figure 1a and Figure S1). Subreads were generated by performing biased random walks across compound points using a series of step rules and a probabilistic criterion to generate a set of candidate sequencing trajectories (see Materials and Methods). A walk begins from every compound, and each walk terminates when no legal step can be taken that would result in a base call. A final sequence is determined by alignment38 of subread fragments and an intensity-weighted scoring metric.
We used hierarchical clustering of mass adducts to augment compound intensity. Co-eluting neutral and charge-carrying adducts were recursively clustered, such that their integrated intensities are combined with that of the main peak. This increased the intensity of ladder fragment compounds, better differentiated singly cut fragments from coeluting internal fragments of the same length, and reduced the data complexity in the region critical for generating sequencing reads.
Base calling relied on the observed mass difference between adjacent fragments along a sequencing trajectory, where mass differences were converted to base calls by a database search of nucleotide and modified nucleotide masses. A series of contiguous base calls in a trajectory generated a subread that was aligned with other subreads to produce a consensus sequence from each ladder. Chromatographic separation of sequence ladders simplified identification of reads in the same orientation. Subreads belonging to each ladder could be automatically clustered by bifurcating the set of walks with a locally regressed midline through the observed compound data set. This step made use of locally weighted scatter plot smoothing (LOWESS) to generate a reasonable clustering border, and walks were grouped together based on their position relative to this border.
Internal fragments could have similar masses and RTs as desired single-cut fragments, leading to erroneous base calls. However, the algorithm biases each step toward a nearby compound with high local peak intensity and also scores steps based on that intensity. Since internal fragments were in lower abundance than single-cut fragments as a result of our sample preparation, internal fragment ladders generated subreads that were less frequent, shorter, and lower scoring than bona fide reads. Critically, filtering on subread length further minimized reads containing steps off of the main ladder, since these usually terminate a sequencing trajectory prematurely.
The algorithm was used to sequence a variety of modified and unmodified RNAs (Figure 1b, 3, 5a, S3, and S5). For the 20-nt RNA R2 (Figure 1b), the two methylated residues were identified in the expected positions in both sequence ladders with mass differences of 319.0564 ± 0.001 Da on each ladder, corresponding to methylated cytidine monophosphate. There are four isomeric RNA bases that would yield a mass difference of 319.0569 Da upon loss: 3-methylcytidine (m3C), 5-methylcytidine (m5C), N4-methylcytidine (m4C) and 2′-O-methylcytidine (Cm).1 The hydrolysis mechanism can be used to exclude 2′-hydroxyl methylation.13 From MS1 data, we therefore obtained the position and exact mass of the modification, and we deduced that the modified nucleotides are one of the three documented cytosine methylations.
Figure 3.

Direct LC–MS sequencing of modified RNA. In panels (a–d), circles denote compounds on the 5′ ladder (containing the original 5′ end) and squares denote those on the 3′ ladder (containing the original 3′ end). (a) Sequencing of an RNA that contains only canonical bases (R1: AUAGCCCAGUCAGUCUACGC). (b) Sequencing of a modified 20-nt RNA (R8: As2UCs2UCCCAGUCAGUCUACGC). (c) Sequencing of a 5′-biotinylated 15-nt RNA (R6: Biotin-GCGUAUACUGUCUCG). (d) Sequencing of a 20-nt RNA with the bulky hydrophobic 3′ modification Cy3 (R4: AUAGCCCAGUCAGUCUACGC-Cy3).
Figure 5.

Probing sequencing gaps and nucleotide isomers by MS/MS. (a) Automated sequencing of a modified 20-nt RNA with a 2′-O-methylation in position C11 (R5: AUAGCCCAGUCmAGUCUACGC). 2′-O-modifications inhibit acid hydrolysis of the phosphate backbone leading to weak or missing ladder fragments. The mass of the missing fragment in the lower 3′ ladder corresponded to A + C + methyl (gray text). (b) Structure of the missing dimer determined by MS/MS analysis, with characteristic fragment ions as labeled. (c) Fragmentation spectrum following extended acid hydrolysis (80 °C, 75% (v/v) formic acid, 2 h) to increase the abundance of the dimer. MS/MS data was collected for the modified dimer and fragment ions were used to confirm that the methylation is on the ribose 2′ position of cytidine and the sequence is CmA. Assignable fragments labels are indicated on the dimer structure in panel (b).
The algorithm was able to reconstruct bidirectional reads in the presence of significant compound noise. For instance, for the 20-nt RNA R8 (Figure 3b), two thiolated uridines (corresponding to 2- or 4-thiouridine) were identified as a mass differences of 322.001 ± 0.0031 Da. In this case, 273 compounds were initially identified by molecular feature extraction with a signal-to-noise ratio (SNR) > 20, of which 189 compounds remain following adduct clustering, and 180 remain after limiting the overall mass range. The random walk algorithm in this case generated over 400 redundant sequencing trajectories, resulting in an alignable bidirectional read of the 20-mer with 20 out of 20 base calls in one orientation (upper 5′ ladder) and 18 out of 20 in the reverse orientation (lower 3′ ladder). The two remaining bases on the 3′ ladder have low ionization efficiency and retention with these instrument parameters because they exhibit one or zero phosphates for the 3′ terminal dimer and monomer, respectively, and were often not observed above the specified SNR.
The overall procedure gives excellent reproducibility, with equivalent sequencing results in multiple independent replicates (Figure S5). The robustness of the algorithm permits high fidelity results from across a wide range of digest times, from 3–15 min (Figure 4). In an extreme case, two of three independent samples overdigested for 30 min result in error-free final reads. In these cases, the algorithm began from more than 500 compounds, such that the desired reads were largely obscured by internal fragments. Reads arising from both internal fragment ladders and the bona fide single-cut ladder contributed to the final alignments.
Figure 4.

Sequencing error rate as a function of RNA digest time at 40 °C in 50% (v/v) formic acid for independent triplicate digests of the 20-nt RNA R1. Error rate was defined as (No. of incorrect base calls)/(sequence length) × 100%.
While ion pairing retention is predominantly dictated by phosphate number,39 base composition can also affect RT. This second-order effect was beneficial, since it permitted separation of RNAs having partial sequence heterogeneity (Figure S6). In Figure S6a, two RNAs having similar sequences were sequenced simultaneously. R1 and R3 differ in the first five bases, and four ladders were therefore observed. For fragments shorter than 16-nt, the 3′ ladders for R1 and R3 have identical sequence and therefore converged. Figure S6b shows that mobility differences arising from only a single base difference (16mer in 3′ ladders) gave rise to a 20 s separation. This resulted in unique RT for all fragments in the 5′ ladders. The chromatographic separation between R1 and R3 simplified analysis, such that ladders could be identified based on inspection of the retention. Both RNAs were correctly sequenced by a manual analysis, demonstrating that at least in some cases multiple RNAs could be sequenced simultaneously and that small differences in composition could be adequate to separate sequence ladders arising from different RNAs.
Effect of Hydrophobic Modifications on Ladder Separation
Bulky hydrophobic modifications should significantly increase fragment retention time. To examine extreme cases of bulky modifications, we examined the laddering behavior of biotinylated and dye-modified oligonucleotides. We directly sequenced a 5′-biotinylated RNA, R6 (Figure 3c). This modification is less polar than RNA and led to marked separation of the sequence ladders. Further, modification position had a large effect on ladder separation. A 3′ terminal hydrophobic modification inverted ladder elution order, such that the 3′ ladder exhibited longer RT than the 5′ ladder. This effect was clearly apparent in the case of a 3′ terminally Cy3 labeled RNA (R4, Figure 3d). Bulky internal hydrophobic modifications yielded similar effects, as observed for the RNA R7, incorporating a Cy3 group between G13 and U14 (Figure S4). Fragments that retained Cy3 were clearly separated from the rest of the laddering pattern.
Benefit of Bidirectional Reads and Scenarios Requiring MS/MS Confirmation
Our procedure does not rely on MS/MS confirmation of hydrolytic fragments, but in select cases it may be helpful to disambiguate sequencing anomalies and to probe the chemical structure of isobaric modified bases. Schemes to differentiate some nucleoside isomers by specific labeling reactions have been previously reported, such as identification of pseudouridine by cyanoethylation.33 Enzymatic digestion of tRNA down to single nucleoside level followed by RP-HPLC also gives baseline separation of m3C, m5C and Cm.40,41 However, selected ion fragmentation can provide additional modification information without significant changes to sample preparation.
When an RNA was modified at a 2′-hydroxyl (R5, Figure 5a), acid hydrolysis led to gaps in the laddering corresponding to the position of the 2′-O-modification.13 In the 5′ ladder, a surprising sequencing read through the 2′ modified position nevertheless occurs, most likely by stepping to a low intensity internal fragment in the absence of a dominant single-cut fragment at this position. This interpretation is supported by the fact that the read is not observed bidirectionally. The observed gap in the 3′ ladder at this position could be used to manually infer that the intervening sequence contains A + C + methylation. During characterization of a novel RNA, the unmodified sequence is likely to be known from indirect sequencing, allowing the likely modification mass to be deduced from observed ladder gaps. In this test case, the position of the missing fragment in the 3′ sequence ladder clearly gave the location of the modification, and the presence of a dimer-sized gap hints at a ribose 2′ modification. Confirmation was therefore obtained by MS/MS of the modified dimer fragment, by selecting the characteristic dimer ion (Figure 5b,c).13 Here, we observed several assignable product ions consistent with dimer 5′-Cm-A-3′. The combination of LC–MS and MS/MS for short selected ions was thus a simple means for complete sequencing of a sparsely modified 2′-O-methylated RNA that was directly compatible with our workflow.
Discussion
A complete understanding of the informational and functional potential of nucleic acids requires sequencing methods that can directly detect chemical modifications and noncanonical bases. Here, we have presented a procedure for improved direct sequencing of RNA using a two-dimensional analysis of mass and chromatographic retention time that we expect to be useful for the analysis of synthetic oligonucleotides, artificial nucleic acids, and isolated biological samples. By optimizing sample preparation and making use of observed regularities in the resulting data sets, we have presented a number of typical cases in which our custom algorithm permits automated sequencing, as well as limiting cases in which manual analysis remains relatively straightforward. These latter cases point toward areas where future algorithmic improvements may be made.
Critically, chromatographic fragment separation prior to mass determination greatly simplified assignment of related ladder fragments. In addition, fragment separation ameliorated ion suppression effects, simplified charge state deconvolution, and generally yielded uncomplicated spectra amenable to automated analysis methods. This was especially important for ladder fragments with high masses, since their charge state envelopes can overlap with that of the full length starting material. A 5 min formic acid treatment only digested approximately a quarter of the starting material for a 20-nt RNA, such that each ladder fragment is present in the injected sample at approximately 1% relative to the undigested starting material. Thus, a further benefit of LC separation is the retention-based identification and clustering of mass adducts, which decreases the complexity of the mass spectra and results in increased signal from the dominant ion of interest. Finally, because two-dimensional analysis also yielded visually identifiable laddering patterns, observable gaps in algorithmically generated sequencing trajectories, e.g., Figure 5a, would also reveal sites in small RNAs that contain novel unannotated modification types. Such discontinuities imply that, from among those nucleotides in the chosen reference set, no valid mass could be found that would yield a base call in that sequence region. As such, visual inspection of the sequencing trajectories may be directly useful for hypothesis generation and discovery of novel modifications.
There are several notable limitations to our current method. The maximum length of starting material is practically limited by the accuracy and resolution of the mass analyzer. With technological advances in instrumentation, the sequenceable length will continue to increase. In general, charge state envelopes for long RNAs and their numerous metal ion adducts are broad and complicated, such that chromatographic refinements are also highly valuable. In our conditions, fragment chromatographic separation becomes decreasingly effective for fragments longer than ∼25–30-nt.35 Adjustment of chromatographic conditions to improve separation of longer RNA fragments would reduce ambiguity by better separating the 5′ and 3′ fragment ladders.
The increased retention of 5′ fragment ladders is valuable for automatic assignment of read orientation, but in special cases this property may no longer be assumed. In particular, if the starting material has a 5′-hydroxyl and a 3′-phosphate, both hydrolytic fragments will have the same approximate RT under ion pairing conditions for compositionally similar fragments. This technical problem can be mitigated by dephosphorylation (e.g., using a phosphatase). Additionally, if a significantly hydrophobic modification exists on the 3′ fragment, dramatic retention effects emerge in the resulting laddering (Figure 3d and Figure S3). These large effects can either improve or confound automated data analysis, but they generally improve 5′ vs 3′ ladder separation for part or all of the sequence. Although Cy3 and biotin represent artificial modifications that are particularly extreme in their hydrophobicity, some naturally found RNA modifications may have similar properties, such as the recently identified geranylated 5-methylaminomethyl-2-thiouridine.42
Our procedure relies on a homogeneous starting material, although we demonstrate that some RNA mixtures of limited complexity can be manually analyzed. This requires that native RNA be isolated in significant yield for analysis. Our choice of mobile phase trades some sensitivity for fragment separation. With our instrumentation, 15 pmol of starting material was sequenceable, but other currently available instruments have the sensitivity to achieve full sequencing at the low picomole or subpicomole scale. These amounts are well within the range tractable to typical PAGE or chromatographic purifications of biological samples. It is notable that our method is insensitive to DNA contamination in the starting material, such that RNA isolation using (e.g., biotinylated) complementary 2′-O-methyl, 2′-fluoro, or deoxy-oligonucleotides would be compatible with the method.
In principle, any linear informational polymer with known monomer composition could be sequenced bidirectionally by a generalization of the presented method and algorithm. In particular, adaptation of the method to novel backbone chemistries or dramatically different linear polymers requires only optimization of digest conditions and a database of relevant monomer masses.
Conclusion
The discovery of novel classes of RNA molecules playing diverse roles in cellular processes is leading to an increasing demand for techniques that interrogate nucleic acids at the chemical level. We suggest that the direct sequencing procedure presented here will aid in the mechanistic understanding of RNA species isolated from natural sources, particularly small noncoding RNAs including miRNAs, piRNAs, and numerous new RNA classes of recent interest. The method could also be used to determine the interaction site for chemically or photochemically cross-linked RNA-protein and RNA–RNA complexes after chemical or enzymatic degradation. Furthermore, we believe the method will permit analysis of extension products from nonenzymatic replication reactions using RNA or oligonucleotides containing nonstandard nucleobases or backbone chemistries.
Materials and Methods
LC–MS
Samples were separated and analyzed on an Agilent 1200 HPLC coupled to an Agilent 6520 accurate-mass Q-TOF (Agilent Technologies) equipped with a solvent degasser, autosampler, diode array detector and column oven. All separations were performed using IP-RP-HPLC according to ref (35) with aqueous mobile phase (A) as 200 mM HFIP with 1.25 mM TEA at pH 7.0 and organic mobile phase (B) as methanol across a 100 mm × 1 mm i.d. Xbridge C18 column with a particle size of 3.5 μm (Waters). For samples with hydrophobicity similar to unmodified RNA, mobile phase B was ramped from 2.5% to 20% over 30 min. For samples with large hydrophobic modifications, mobile phase B was increased from 5% to 15% over 0–20 min and from 15% to 60% over 20–41 min. The flow rate was 0.1 mL/min, and all separations were performed with the column temperature maintained at 50 °C. Injection volumes were 5–25 μL, and sample amounts were 15–400 pmol of RNA. RNAs were analyzed in negative ion mode from 239 m/z to 3200 m/z with a scan rate of 1 spectrum/s with the following MS settings: drying gas flow, 8 L/min; drying gas temperature, 325 °C; nebulizer pressure, 30 psig; capillary voltage, 3500 V; fragmentor, 200 V; and skimmer, 65 V. For LC–MS/MS the source parameters were the same as above and ions were fragmented using collision induced dissociation (CID) with N2 and collision potential of 30 V.
Automated De Novo Sequencing Algorithm
Candidate compounds identified by molecular feature extraction (see Supporting Information) were analyzed using a novel algorithm implemented in Python that generates paired end sequencing reads from a set of compounds defined by their mass, chromatographic RT, and abundance (Figure S1). Compounds were recursively clustered to agglomerate peak intensity from multiple adducts into a single parent compound. To do so, a list of compounds was searched for mass additions corresponding to frequent adducts and losses (e.g., +Na–H, +K–H, +Cl, −H2O, and +formyl) within a specified mass error window (calculated in ppm) and RT window (specified as a peak width multiplier). The intensities of candidate compound adducts were summed onto the species with maximum integrated compound volume, based on the observation that the dominantly observed ion for purified nucleic acids was the adduct-free species. Adduct clustering was performed recursively to a specified recursion depth (typically no more than 2–3 levels to avoid error amplification), such that multiple mass adducts were hierarchically clustered with the parent compound.
The clustered compound set can be further filtered based on ion characteristics (number of observed charge states, peak quality, intensity, etc.), although strict filters were generally unnecessary. An optional high stringency weighting scheme can be employed, since the desired single-cut fragments are only those pairs whose mass sum to that of the candidate full length species (−H2O), such that all other fragments can be down-weighted. This optional feature was not required for the analyses reported here. Sequencing reads for a 20-nt RNA were commonly generated from a final set of ca. 200–300 compounds. For the analyses performed here, compounds were filtered only by requiring observation of two ions and that they have a mass greater than 224 Da.
With a set of compounds, C, a constrained Monte Carlo random walk was repeatedly simulated across all C(m,t,v) points, where m is compound monoisotopic mass, t is compound RT, and v is integrated peak intensity. In the algorithm, a candidate sequencing read of length n is defined by a walk [Ci, Ci+1, ..., Ci+n] along steps i that proceeds across C point space using the following set of rules. A step from Ci → Ci+1 can be taken if and only if
-
(1)
mi > mi+1 (i.e., in the direction of monotonically decreasing mass),
-
(2)
ti > ti+1or ti < ti+1 for all i (i.e., in the direction of monotonically increasing or decreasing RT for an entire walk),
-
(3)
mass difference, Δm = mi – mi+1 ∈ {Δmknown ± merr}, and
-
(4)
Ci+1 maximizes Pi+1 = P(Ci+1|Ci), where the conditional probability Pi+1 is defined for this purpose as Pi+1 = (vi/(max(vnn))) + G.
Here, G is a Gaussian noise term with mean 1 and empirical variance (generally 0.1 for internal jumps and 0.5 for first jumps in a walk). As above, vi is the volumetrically integrated and globally normalized peak intensity of compound Ci. The local normalization factor max(vnn) is determined by taking the maximum intensity of all nearest neighbors within a mass × RT window around Ci, the size of which can be variably defined by the set of known base mass differences, {Δmknown}, the maximum allowable mass error, merr (limited at 5–10 ppm for our instrument), and an expected maximum RT difference for loss of a single nucleotide (maximally around 3 min for native bases and minor modifications under the separation conditions used in this work). The intensity-weighted term of the probability Pi+1 is valid primarily for the sample preparation conditions used here, as singly cut fragments are generally expected to be in highest abundance in any mass × RT region relative to multiply cut internal fragments.
Since many trajectories can be generated from a data set, an intensity based scoring metric was used to judge the quality of each step in a trajectory, and therefore of each call in a read. Walk trajectories were generated on each degradative sequencing ladder, in both 3′–5′ and 5′–3′ orientations. Trajectories were clustered into two groups expected to be in the same read orientation, bifurcated by a locally weighted scatterplot smoothing (LOWESS) regression line generated from the filtered compound set. Trajectories were then converted to subsequence reads by a table lookup of Δmi for each step, taking into account the specified maximum allowable merr. A preliminary sequence alignment within each cluster of trajectories was performed, and a consensus subread was determined for each by choosing the base at each aligned sequence position with maximal score.
Preliminary alignment gave one consensus subread for each cluster, but orientation of these sequences is not yet known. Orientation can be unambiguously determined in most cases by checking whether the first mass difference from the full length mass corresponds to a nucleoside or nucleotide minus H2O. Since acid digestion results in fragments containing a 3′(2′)-monophosphate and a 5′-hydroxyl, loss of a nucleoside occurs at the 3′ end, provided that the starting material is not 3′(2′)-phosphorylated, which can be ensured by phosphatase treatment. Given this predicted orientation, the two sequences resulting from preliminary alignment could then be aligned against one another after placing them in the same orientation, which gave a final consensus read.
Acknowledgments
We thank Drs. L. Li, and C. Hentrich for helpful discussions. This work was supported in part by a grant (290363) from the Simons Foundation to J.W.S. A.B. is supported by a fellowship from the Academy of Finland. J.W.S. is an investigator of the Howard Hughes Medical Institute.
Supporting Information Available
The Supporting Information is available free of charge on the ACS Publications website at DOI: 10.1021/jacs.5b09438.
Additional experimental data, full materials and methods. (PDF)
An open source Python package (a source code repository and documentation are available on Github at https://szostaklab.github.io/lcmsseq/). (ZIP)
Author Present Address
□ Statens Serum Institut, Artillerivej 5, DK-2300 Copenhagen S, Denmark.
Author Present Address
# Department of Life Sciences, New York Institute of Technology, New York, NY 10023, United States.
Author Present Address
∇ Ra Pharmaceuticals, Inc., Cambridge, Massachusetts 02139, United States.
Author Contributions
⊥ A.B., V.S.L., and S.Z. contributed equally.
The authors declare no competing financial interest.
Supplementary Material
References
- Cantara W. A.; Crain P. F.; Rozenski J.; McCloskey J. A.; Harris K. A.; Zhang X.; Vendeix F. A.; Fabris D.; Agris P. F. Nucleic Acids Res. 2011, 39, D195–201. 10.1093/nar/gkq1028. [DOI] [PMC free article] [PubMed] [Google Scholar]
- Wang X.; He C. Mol. Cell 2014, 56, 5–12. 10.1016/j.molcel.2014.09.001. [DOI] [PMC free article] [PubMed] [Google Scholar]
- Braasch D. A.; Jensen S.; Liu Y.; Kaur K.; Arar K.; White M. A.; Corey D. R. Biochemistry 2003, 42, 7967–7975. 10.1021/bi0343774. [DOI] [PubMed] [Google Scholar]
- Hafner M.; Landthaler M.; Burger L.; Khorshid M.; Hausser J.; Berninger P.; Rothballer A.; Ascano M. Jr.; Jungkamp A. C.; Munschauer M.; Ulrich A.; Wardle G. S.; Dewell S.; Zavolan M.; Tuschl T. Cell 2010, 141, 129–141. 10.1016/j.cell.2010.03.009. [DOI] [PMC free article] [PubMed] [Google Scholar]
- Kole R.; Krainer A. R.; Altman S. Nat. Rev. Drug Discovery 2012, 11, 125–140. 10.1038/nrd3625. [DOI] [PMC free article] [PubMed] [Google Scholar]
- Benner S. A. Acc. Chem. Res. 2004, 37, 784–797. 10.1021/ar040004z. [DOI] [PubMed] [Google Scholar]
- Ebhardt H. A.; Tsang H. H.; Dai D. C.; Liu Y.; Bostan B.; Fahlman R. P. Nucleic Acids Res. 2009, 37, 2461–2470. 10.1093/nar/gkp093. [DOI] [PMC free article] [PubMed] [Google Scholar]
- Schaefer M.; Pollex T.; Hanna K.; Lyko F. Nucleic Acids Res. 2009, 37, e12. 10.1093/nar/gkn954. [DOI] [PMC free article] [PubMed] [Google Scholar]
- Sakurai M.; Suzuki T. Methods Mol. Biol. 2011, 718, 89–99. 10.1007/978-1-61779-018-8_5. [DOI] [PubMed] [Google Scholar]
- Dominissini D.; Moshitch-Moshkovitz S.; Schwartz S.; Salmon-Divon M.; Ungar L.; Osenberg S.; Cesarkas K.; Jacob-Hirsch J.; Amariglio N.; Kupiec M.; Sorek R.; Rechavi G. Nature 2012, 485, 201–206. 10.1038/nature11112. [DOI] [PubMed] [Google Scholar]
- Limbach P. A. Mass Spectrom. Rev. 1996, 15, 297–336. . [DOI] [PubMed] [Google Scholar]
- Giessing A. M.; Kirpekar F. J. Proteomics 2012, 75, 3434–3449. 10.1016/j.jprot.2012.01.032. [DOI] [PubMed] [Google Scholar]
- Bahr U.; Aygun H.; Karas M. Anal. Chem. 2009, 81, 3173–3179. 10.1021/ac900100x. [DOI] [PubMed] [Google Scholar]
- Howlett H. A.; Johnson M. W.; Trim A. R.; Eagles J.; Self R. Anal. Biochem. 1971, 39, 429–440. 10.1016/0003-2697(71)90433-7. [DOI] [PubMed] [Google Scholar]
- Kowalak J. A.; Pomerantz S. C.; Crain P. F.; McCloskey J. A. Nucleic Acids Res. 1993, 21, 4577–4585. 10.1093/nar/21.19.4577. [DOI] [PMC free article] [PubMed] [Google Scholar]
- Pieles U.; Zurcher W.; Schar M.; Moser H. E. Nucleic Acids Res. 1993, 21, 3191–3196. 10.1093/nar/21.14.3191. [DOI] [PMC free article] [PubMed] [Google Scholar]
- Nordhoff E.; Cramer R.; Karas M.; Hillenkamp F.; Kirpekar F.; Kristiansen K.; Roepstorff P. Nucleic Acids Res. 1993, 21, 3347–3357. 10.1093/nar/21.15.3347. [DOI] [PMC free article] [PubMed] [Google Scholar]
- Sample P. J.; Gaston K. W.; Alfonzo J. D.; Limbach P. A. Nucleic Acids Res. 2015, 43, e64. 10.1093/nar/gkv145. [DOI] [PMC free article] [PubMed] [Google Scholar]
- Ni J.; Pomerantz C.; Rozenski J.; Zhang Y.; McCloskey J. A. Anal. Chem. 1996, 68, 1989–1999. 10.1021/ac960270t. [DOI] [PubMed] [Google Scholar]
- Tolson D. A.; Nicholson N. H. Nucleic Acids Res. 1998, 26, 446–451. 10.1093/nar/26.2.446. [DOI] [PMC free article] [PubMed] [Google Scholar]
- Wambua D. M.; Ubukata M.; Dane J.; Cody R. B.; Chiu N. H. L. Anal. Methods 2014, 6, 8829–8839. 10.1039/C4AY01519C. [DOI] [Google Scholar]
- Turner J. J.; Hoos J. S.; Vonhoff S.; Klussmann S. Nucleic Acids Res. 2011, 39, e147. 10.1093/nar/gkr776. [DOI] [PMC free article] [PubMed] [Google Scholar]
- Thomas B.; Akoulitchev A. V. Trends Biochem. Sci. 2006, 31, 173–181. 10.1016/j.tibs.2006.01.004. [DOI] [PubMed] [Google Scholar]
- Yamada M.Method for sequencing RNA by in-source decay using matrix assisted laser desorption ionization time of flight mass spectrometer. U.S. Patent US9040235 B2, May 26, 2015.
- Taucher M.; Breuker K. Angew. Chem., Int. Ed. 2012, 51, 11289–11292. 10.1002/anie.201206232. [DOI] [PMC free article] [PubMed] [Google Scholar]
- Nakayama H.; Yamauchi Y.; Taoka M.; Isobe T. Anal. Chem. 2015, 87, 2884–2891. 10.1021/ac504378s. [DOI] [PubMed] [Google Scholar]
- RajBhandary U. L.; Kohrer C. J. Biosci. 2006, 31, 439–451. 10.1007/BF02705183. [DOI] [PubMed] [Google Scholar]
- Kellner S.; Burhenne J.; Helm M. RNA Biol. 2010, 7, 237–247. 10.4161/rna.7.2.11468. [DOI] [PubMed] [Google Scholar]
- Wang Z.; Gerstein M.; Snyder M. Nat. Rev. Genet. 2009, 10, 57–63. 10.1038/nrg2484. [DOI] [PMC free article] [PubMed] [Google Scholar]
- Ozsolak F.; Milos P. M. Nat. Rev. Genet. 2011, 12, 87–98. 10.1038/nrg2934. [DOI] [PMC free article] [PubMed] [Google Scholar]
- Peattie D. A. Proc. Natl. Acad. Sci. U. S. A. 1979, 76, 1760–1764. 10.1073/pnas.76.4.1760. [DOI] [PMC free article] [PubMed] [Google Scholar]
- Silberklang M.; Gillum A. M.; RajBhandary U. L. Nucleic Acids Res. 1977, 4, 4091–4108. 10.1093/nar/4.12.4091. [DOI] [PMC free article] [PubMed] [Google Scholar]
- Mengel-Jorgensen J.; Kirpekar F. Nucleic Acids Res. 2002, 30, e135. 10.1093/nar/gnf135. [DOI] [PMC free article] [PubMed] [Google Scholar]
- Oivanen M.; Kuusela S.; Lonnberg H. Chem. Rev. (Washington, DC, U. S.) 1998, 98, 961–990. 10.1021/cr960425x. [DOI] [PubMed] [Google Scholar]
- Apffel A.; Chakel J. A.; Fischer S.; Lichtenwalter K.; Hancock W. S. Anal. Chem. 1997, 69, 1320–1325. 10.1021/ac960916h. [DOI] [PubMed] [Google Scholar]
- Bahr U., Karas M.. Verfahren zur Sequenzierung eines RNA-Moleküls mittels Massenspektrometrie. Germany Patent DE102008007112 (B3), Aug 6, 2008.
- Gan L. X.; Whistler R. L. Carbohydr. Res. 1990, 206, 65–69. 10.1016/0008-6215(90)84006-G. [DOI] [PubMed] [Google Scholar]
- Sievers F.; Wilm A.; Dineen D.; Gibson T. J.; Karplus K.; Li W.; Lopez R.; McWilliam H.; Remmert M.; Soding J.; Thompson J. D.; Higgins D. G. Mol. Syst. Biol. 2011, 7, 539. 10.1038/msb.2011.75. [DOI] [PMC free article] [PubMed] [Google Scholar]
- Huang Z.; Jayaseelan S.; Hebert J.; Seo H.; Niu L. Anal. Biochem. 2013, 435, 35–43. 10.1016/j.ab.2012.12.011. [DOI] [PMC free article] [PubMed] [Google Scholar]
- Su D.; Chan C. T.; Gu C.; Lim K. S.; Chionh Y. H.; McBee M. E.; Russell B. S.; Babu I. R.; Begley T. J.; Dedon P. C. Nat. Protoc. 2014, 9, 828–841. 10.1038/nprot.2014.047. [DOI] [PMC free article] [PubMed] [Google Scholar]
- Russell S. P.; Limbach P. A. J. Chromatogr. B: Anal. Technol. Biomed. Life Sci. 2013, 923–924, 74–82. 10.1016/j.jchromb.2013.02.010. [DOI] [PMC free article] [PubMed] [Google Scholar]
- Dumelin C. E.; Chen Y.; Leconte A. M.; Chen Y. G.; Liu D. R. Nat. Chem. Biol. 2012, 8, 913–919. 10.1038/nchembio.1070. [DOI] [PMC free article] [PubMed] [Google Scholar]
Associated Data
This section collects any data citations, data availability statements, or supplementary materials included in this article.