

Abstract
Purpose
Animal models are powerful tools to broaden our understanding of disease mechanisms and to develop future treatment strategies. Here we present detailed structural and functional findings of a rhesus macaque suffering from a naturally occurring bilateral macular dystrophy (BMD), partial optic atrophy and corresponding reduction of central V1 signals in visual fMRI experiments when compared to data in a healthy macaque (CTRL) of similar age.
Methods
Retinal imaging included infrared and auto fluorescence recordings, fluorescein and indocyanine green angiography and spectral domain optical coherence tomography (OCT) on the Spectralis HRA + OCT platform. Electroretinography included multifocal and Ganzfeld-ERG recordings. Animals were killed and eyes analyzed by immunohistochemistry.
Results
Angiography showed reduced macular vascularization with significantly larger foveal avascular zones (FAZ) in the affected animal (FAZBMD = 8.85 mm2 vs. FAZCTRL = 0.32 mm2). OCT showed bilateral thinning of the macula within the FAZ (total retinal thickness, TRTBMD = 174 ± 9 μm)and partial optic nerve atrophy when compared to control (TRTCTRL = 303 ± 45 μm).Segmentation analysis revealed that inner retinal layers were primarily affected (inner retinal thickness, IRTBMD = 33 ± 9 μm vs. IRTCTRL = 143 ± 45 μm), while the outer retina essentially maintained its thickness (ORTBMD = 141 ± 7 μm vs. ORTCTRL = 160 ± 11 μm). Altered macular morphology corresponded to a preferential reduction of central signals in the multifocal electroretinography and to a specific attenuation of cone-derived responses in the Ganzfeld electroretinography, while rod function remained normal.
Conclusion
We provided detailed characterization of a primate macular disorder. This study aims to stimulate awareness and further investigation in primates with macular disorders eventually leading to the identification of a primate animal model and facilitating the preclinical development of therapeutic strategies.
Keywords: Macular disorde, Neurodegeneration, Functional MRI, Optical coherence tomography, Electroretinography
Introduction
Nonhuman primates, like the rhesus macaque, proved over the years to be ideal models for studying the pathophysiological processes of aging and retinal disease. Prominent examples are the studies on age related macular degeneration (AMD), a blinding disorder with large socioeconomic impact. Common features of AMD such as altered pigment distribution, window defects due to retinal pigment epithelial atrophy, soft drusen and changes of Bruch’s membrane structure can all be found reliably in elderly monkeys (Macaca mulatta) where progression, ultrastructure and functional losses are comparable to those found in humans [1, 2].
In humans, any form of macular degeneration results in significant morbidity for the patient, particularly since there are still no therapeutic options available—with the exception of anti-VEGF treatment in exudative (wet) AMD. Apart from AMD, there is a group of inherited retinal degenerations that are frequently seen in human patients. Various forms of macular dystrophy with different inheritance patterns, clinical phenotype and rate of progression can manifest already early in life [3]. These macular dystrophies often result in profound visual disability as the central visual input is crucial for reading, face recognition and other key tasks of everyday life [4].
Unfortunately, progress in studying the pathogenesis, and consequently the development of treatment options in inherited degenerations has been hampered by the lack of appropriate animal models. While a large number of genetically modified rodent and lapine animal models exist for the study of the visual system, their applicability is questionable since these animals do not have a significant central retinal region comparable to the human and/or primate macula [5]. The retinal structure in rhesus macaques on the other hand corresponds well to human retinal architecture, making them an ideal candidate for studying retinal disorders and for testing the development of new therapeutic strategies [6].
Here we study in detail the case of a naturally occurring bilateral macular dystrophy (BMD) in a rhesus macaque (Macaca mulatta). The visual field loss in this animal was first detected during functional magnetic resonance (fMRI) experiments designed to map its visual cortex. Results from these experiments demonstrated a central loss of visually driven area V1 activity, which corresponded in extent to the expected retinotopic projection of the retinal lesion. In order to explain the lack of foveal responses and to clarify the underlying pathophysiology, we carried out a detailed in vivo characterization of the structural and functional aspects of this condition using state-of-the-art clinical diagnostic protocols including fMRI, Spectralis® HRA + OCT imaging, fluorescence and indo cyanine green angiography and Ganzfeld and multifocal ERG. To the best of our knowledge, this is the first presentation of such an unusual macular lesion and its extensive in vivo characterization in a primate.
Methods
Ethics statement
Animals were treated in accordance with the recommendations of the Weatherall report (http://www.mrc.ac.uk/Utilities/Documentrecord/index.htm?d=MRC003440), and all experiments were conducted with great care to ensure the well-being of the animals. Specifically, group housing was maintained to increase quality of life by social interaction and stimulation for play. Animals were kept in large cages that allow swinging and jumping, and equipment or toys were changed frequently. To ameliorate suffering, high-quality anesthesia procedures were used during experimentation (described in detail below). All procedures involving animals were performed with the approval of the Regierungspraesidium Tuebingen (Trial No. KY 2/06) and in full compliance with the guidelines of the local authorities and the European Community (EUVD 86/609/EEC) for the care and use of laboratory animals.
Animals
A detailed ophthalmological examination of a rhesus macaque (Macaca mulatta, male, aged 6 years) with bilateral macular dystrophy (BMD) was performed, including a 1-year follow-up. At baseline, three healthy macaques (two males, aged 9 years; and a female, aged 6 years) served as control (CTRL). FMRI experiments were performed on one male, one female and the BML animal, and retinal imaging (OCT) and electrophysiological recordings were performed on one male and the BML animal. All animals were treated in accordance with the recommendations of the Weatherall report.
Preparation
First, blood samples were taken from both animals for toxicological and genetic analysis. Then, experiments were performed under general anesthesia described in detail elsewhere [7]. Briefly, the animals were premedicated with glycopyrolate (0.01 mg/kg, intramuscular) and ketamine (15 mg/kg, intramuscular), and then deep anesthesia was induced by fentanyl (3 μg/kg), thiopental (5 mg/kg) and succinyl chloride (3 mg/kg). Anesthesia was maintained with remifentanil (0.5–2 μg/kg/min) and mivacurium chloride (3–6 mg/kg/h) to ensure the suppression of eye movements. Heart rate and blood oxygen saturation were monitored continuously with a pulse-oxymeter. Prone position was maintained, and the head was fixed via stereotax. Wire specula were used for lid retraction. Pupillary mydriasis was produced by tropicamide eye drops (Mydriaticum Stulln©, Pharma Stulln, Germany). During examinations the cornea was kept well hydrated to provide clear optical media.
Intraocular pressure (IOP) was measured four times on each eye using a Tono-Pen (Tono-Pen® XL Applanation Tonometer, Reichert Technologies, Depew, NY, USA) and averaged.
Functional MRI
FMRI experiments were performed on a 4.7T vertical scanner (Bruker Biospec, Bruker Biospin GmbH, Ettlingen, Germany) equipped with 48 mT/m gradients. Typically, 17 axial slices were acquired with an eight-segment gradient-echo EPI with field of view (FOV) 128 × 128 mm2, matrix 128 × 128, slice thickness 2 mm, flip angle (FA) 40°, echo time (TE) 20 ms and repetition time (TR) 750 ms. For anatomical measurements we used FLASH with the same FOV 128 × 128 mm2, matrix 256 × 256, slice thickness 2 mm, FA 70° and TE 10 ms. A high-resolution 3D-MDEFT anatomical image with an isotropic resolution of 0.5 mm was acquired during a separate session and was used for co-registration with the FLASH and EPI images. For more details on the fMRI methods see [7, 8]. Visual stimulation was delivered monocularly to the left eye by using a custom in house–made system that projected the images to MRI compatible goggles through a fiberoptic guide with resolution 640 × 480 pixels. The horizontal field of view was 30° and the vertical 23. The stimuli consisted of bar apertures (2° thickness) moving by 1° per volume acquisition (6 s) over a flickering polar checkerboard in four different directions (down, right, up and left). Each fMRI scan included 2 repetitions of the stimuli, and we acquired 5–7 scans for each session. Data were analyzed by using the voxel-based population receptive field (pRF) analysis method described by Dumoulin et al. [9]. The activity of each voxel was fit by using a two-dimensional Gaussian function with three parameters (the visual field spatial coordinates x, y reflecting the center of the pRF and a standard deviation reflecting the pRF size). The gray– white matter boundary was segmented using the high-resolution 3D-MDEFT anatomical images, and 3D cortical surface and flat mesh models were created [10]. Functional activation maps of the explained variance were thresholded at 0.15 and were overlaid on the 3D and flat meshes. Activation maps were also calculated using other threshold values (not shown) without significant changes to the map and the border of the lesion projection zone (LPZ), demonstrating that activity is changing sharply across the border. The expected cortical representation of the retinal lesion was calculated from Tootell et al.’s [11] retinotopic organization maps of V1 obtained via the 14c-2-deoxy-D-glucose staining technique, and from electrophysiological cortical magnification measurements M1 (r) = 13r−1.22 [12], or M2 (r) = 15.7 (r + 1.62)−1 [13], where r is the eccentricity from the center of the visual field, and M is the magnification factor in millimeter per degree. Then, the radius D from the fovea of the representation of the central part of the visual field in area V1 from eccentricity 1° to eccentricity E can be calculated by integrating the magnification factor equation. Cortical distance from 0° to 1° eccentricity was estimated using Df (r) = 7 ln(r + 0.33) [14].
Retinal imaging
High-resolution spectral domain OCT (SD-OCT) imaging was done in the same session as ERG recordings as previously described [15–17] using the commercially available Spectralis® HRA + OCT device from Heidelberg Engineering. For acquisition of scans, a mean of 16 images was calculated with automated alignment of iterative recordings using the Automated Real Time mode, thereby increasing the signal-to-noise ratio by a factor of four [18]. For quantification of retinal dimensions, we used the proprietary software package version 3.1 from Heidelberg Engineering according to the instructions by the manufacturer. Briefly, the “measure distance tool” was used to quantify the horizontal extent of the lesion between the foveola and the “hard border” (i.e., where the retinal thickness stopped to be minimal) as well as the “soft border” (i.e., where the retinal thickness reaches normal thickness). For quantification of retinal thickness, we used the automatic layer segmentation of the software that identifies the inner and outermost border of the retina (inner limiting membrane to retinal pigment epithelium) and analyzed the retinal thickness in horizontal cross sections centered on the foveola at 16 equidistant loci (every 500 μm) along the length of the scan. Because the built-in software from Heidelberg Engineering did not reliably detect the boundaries of the retinal segments, the manual override function was used to manually correct the layer segmentation algorithm on every single B-Scan. For en face retinal imaging and angiography, we used the Argon laser in the short wavelength range (488 nm with 500 nm barrier filter) for fundus autofluorescence (FAF) imaging and fluorescein angiography (FA) and the longer wavelength diode laser at 785 nm (barrier filter at 800 nm) for indocyanine green angiography (ICGA). Resulting data were exported as 8 bit color bitmap files and processed in Adobe Photoshop CS3 (Adobe Systems, San Jose, CA).
Electroretinography (ERG)
After anesthesia was induced and stable eye position was achieved, Ganzfeld-ERGs were recorded with a Mini-Ganzfeld-system (Roland Consult GmbH, Brandenburg, Germany). The dark-adapted (30-min adaptation) ERG protocol consisted of a stimulus intensity series (seven intensities ranging from 0.0095 to 9.5 cd * s/m2 in 0.5 log unit steps) including the rod (0.01 cd * s/m2), standard flash (3 cd * s/m2) used also for evaluation of the oscillatory potentials and a high-intensity flash (10 cd * s/m2). After 10 min of light adaptation (background light, 30 cd/m2), photopic single flash and 30-Hz flicker responses were recorded with a stimulation intensity of 3 cd * s/m2. All responses were amplified and band-pass filtered between 0.2 and 300 Hz. Oscillatory potentials were extracted by band-pass filtering the scotopic responses to a 3 cd * s/m2 flash between 100 and 300 Hz. All responses were analyzed by means of a- and b-wave amplitude and implicit time. Since a set of normal values was not available, we calculated a BMD/CTRL ratio for response amplitudes at each step for further investigation of the proportional changes.
Multifocal ERGs were recorded under photopic conditions using a modified device of a HRA2 infrared fundus camera (Heidelberg Engineering, Germany) in combination with a Roland Consult multifocal ERG system. This system allows visualization of the fundus while simultaneously stimulating the central 30° retinal area. Since the animals were anesthetized and artifacts (eye movements and blinking) could be avoided, a direct fundus-controlled recording and precise stimulus positioning was possible throughout the whole measurement. Furthermore, the HRA2 device also provides a correction of spherical refractive errors from −12 to +30 diopters without change of magnification. Although cylindrical refractive errors were not ascertained, a sharp image of the retina could be achieved. The stimulus, presented with a built-in small black and white CRT monitor, consisted of 61 hexagonal scaled segments centered in the fovea and extending over the optic disk. Scaled stimulus pattern was chosen on the basis of high similarities of the retinal architecture to human and correct positioning of the stimulus pattern during recordings. The eccentricity of the concentric rings from the center was estimated on the basis of the 30° retinal image and stimulus pattern (i.e., from the fovea to the middle of a representative hexagon in each ring): 2°, 5°, 10° and 15° for rings 2–5, respectively. For test–retest reliability, multifocal ERGs were recorded three times on each eye, every run consisted of 8 cycles. Responses to flash stimuli were amplified and band-pass filtered between 5 and 100 Hz and recorded. An average of the responses was calculated and analyzed according to N1-P1 amplitudes and P1 implicit times of ring averages of the waveforms. Ganzfeld and multifocal ERGs were recorded using ERG-Jet contact lens electrodes (Roland Consult GmbH, Brandenburg, Germany) which were applied to the cornea with 2 % Methocel (hydroxypropyl methylcellulose, OmniVision GmbH, Germany). Despite the contact lens electrodes, a sharp image of the retina could be achieved. Both eyes were tested separately, and the ERG-Jet electrode of the contralateral (covered) eye was used as reference. Ground needle electrodes were placed under the skin of the glabella. Ganzfeld and multifocal ERG protocols were based on the ISCEV Standards [19] and were completed before fundus photography and angiography.
Histology
The animals were tranquilized with ketamine and killed with an overdose of pentobarbital (60–80 mg/kg i.v.). They were immediately perfused transcardially with 0.9 % saline, and the eyes were quickly removed prior to the perfusion with fixative. The eyes were cut open and immersion-fixed in 4 % paraformaldehyde in 0.1 M phosphate buffer (PB, pH 7.4) for 20 min at room temperature. All procedures were approved by the local animal care committee and were in accordance with the law for animal experiments issued by the German government (Tierschutzgesetz).
Following fixation, eyecups were stored in PB with 0.02 % sodium azide. A retinal piece of 3 × 3 mm from the optic nerve head to the fovea was dissected from the affected eyecup and from a control eyecup, cryoprotected in graded sucrose solutions (10, 20 and 30 % in PB) and sectioned vertically (12–18 μm) with a cryostat. Immunocytochemical labeling was performed using the indirect fluorescence method. Sections were incubated overnight with primary antibodies in 3 % normal donkey serum (NDS), 1 % bovine serum albumin (BSA) and 0.5 % Triton X-100. After washing in PB, secondary antibodies were applied for 1 h. These were conjugated to either Cy3 (Dianova) or Alexa TM 488 (Invitrogen).
A rabbit polyclonal antibody against the C-terminal binding protein 2 (CtBP2, 1:5,000; Synaptic Systems, Göttingen, Germany) was used to label synaptic ribbons within the outer and inner plexiform layer, and to label photoreceptor nuclei in outer nuclear layer. ON bipolar cells were labeled with a polyclonal antibody directed against Gγ13 that was raised in rabbit (1:1,000; kind gift from Dr. R. F. Margolskee, Mount Sinai School of Medicine, New York). Glycinergic amacrine cells were labeled with a polyclonal antibody directed against the glycine transporter 1, raised in goat (1:500; Chemicon, Temecula, CA). Horizontal cells were labeled with a monoclonal mouse antibody against parvalbumin (1:10,000; Swant, Bellinzona, Switzerland).
Results
Blood chemical analysis (including blood cell count, liver, kidney, pancreas function and basic metabolic panel) of the affected animal revealed no pathological changes, a standard neurological assessment was within normal limits except for the central scotoma, and no abnormalities were noted on a high-resolution anatomical MRI study. There was no evidence for toxic effects in the animal’s history. IOP measurements were carried out in both animals, showing IOP levels around the lower limit of normal values (IOPBMD = 8.5 ± 1 mmHg, IOPCTRL = 12.5 ± 1.9 mmHg).
Functional MRI
FMRI visual activation maps were measured under photopic conditions using the pRF method [9] in the left eye of the BMD animal and two controls. A comparison between the BMD animal and one of the controls is presented in Fig. 1a–d. The second control showed very similar results as the first one (not shown). The cortical surface representing the central portion of the visual field was devoid of significant visual modulation in the BMD animal. In contrast, the control animals demonstrated robust activation within the corresponding V1 area. The distance from the cortical representation of the fovea to the border where visually driven activity was first visible in area V1 was 33 mm in the BMD animal. For the control animals, the cortical distances in V1 from fovea to the approximate extent of the retinal scotoma of the BMD animal—10° of eccentricity—were measured as 33 and 32 mm. This agrees well with the estimated cortical distance that would subtend 0–10° of eccentricity in area V1 of macaque monkeys, as determined using cortical magnification measurements from the electrophysiology literature (see “Methods”).
Fig. 1.

Blood-oxygen-level dependence (BOLD) responses of the BMD and the control (CTRL) monkey. a Reconstructed surface representing the border of the gray and white matter of the right hemisphere of the BMD monkey with the fraction of the explained variance map overlaid thresholded at 0.15 (see “Methods”). The map was measured using a moving bar stimulus presented to the left eye of the BMD animal. The right eye was closed. b Unfolded flat map of the early visual cortex displayed in A (see “Methods”). The operculum of the monkey is outlined by the calcarine, the lunate and the inferior occipital sulcus. The two insets are the BOLD responses of two voxels selected in the nondeafferented V1 and deafferented V1 of BMD, respectively. The cortical distance between fovea (yellow star) and lesion projection zone border in V1 is 33 mm for BMD, which agrees well with the estimated cortical distances (33 mm [11], 33.2 mm [12, 14] and 33.1 mm [13, 14]) from fovea to 10° eccentricity (the approximate radius of retinal involvement in the BMD subject). c, d Maps corresponding to a, b, respectively, derived from a control monkey are displayed here for comparison. The same methods, including explained variance threshold, were used. BMD bilateral macular dystrophy
Angiography
Prior to fluorescence angiography, we recorded fundus autofluorescence (FAF) in the control and BMD animal (supplemental Figure 1). While FAF signal in the control animal was slightly stronger, there was no distinct pattern such as a bull’s-eye formation or any form of hyperfluorescence in the BMD animal. Fluorescence angiography (Fig. 2a) in the control animal displayed a regular foveal avascular zone (FAZ) of 0.62 mm diameter and area of 0.32 mm2 [20]. Likewise, systemic perfusion parameters (arm retina time, ARTCTRL = 12.4 s) and retinal blood flow (arteriovenous passage time, AVPCTRL = 2.3 s) in the control animal were compared well to those in healthy human subjects [21]. While perfusion characteristics were similar in the affected animal (ARTBMD = 11.9 s, AVPBMD = 2.3 s), the diameter of the FAZ was dramatically increased to 3.73 mm diameter (8.85 mm2 area) at baseline without signs of progression at the 1-year follow-up. Background fluorescence stemming from the choriocapillary network showed an equal distribution over the posterior pole in the control animal, while displaying a highly irregular pattern in the early phase and a central hypofluorescent area at later stages of perfusion in the affected animal. This was even more pronounced in the indocyanine green angiography (Fig. 2b), where late-phase recordings showed a concentric pattern of hyper- and hypofluorescent rings also found in some forms of macular dystrophies in humans [22].
Fig. 2.
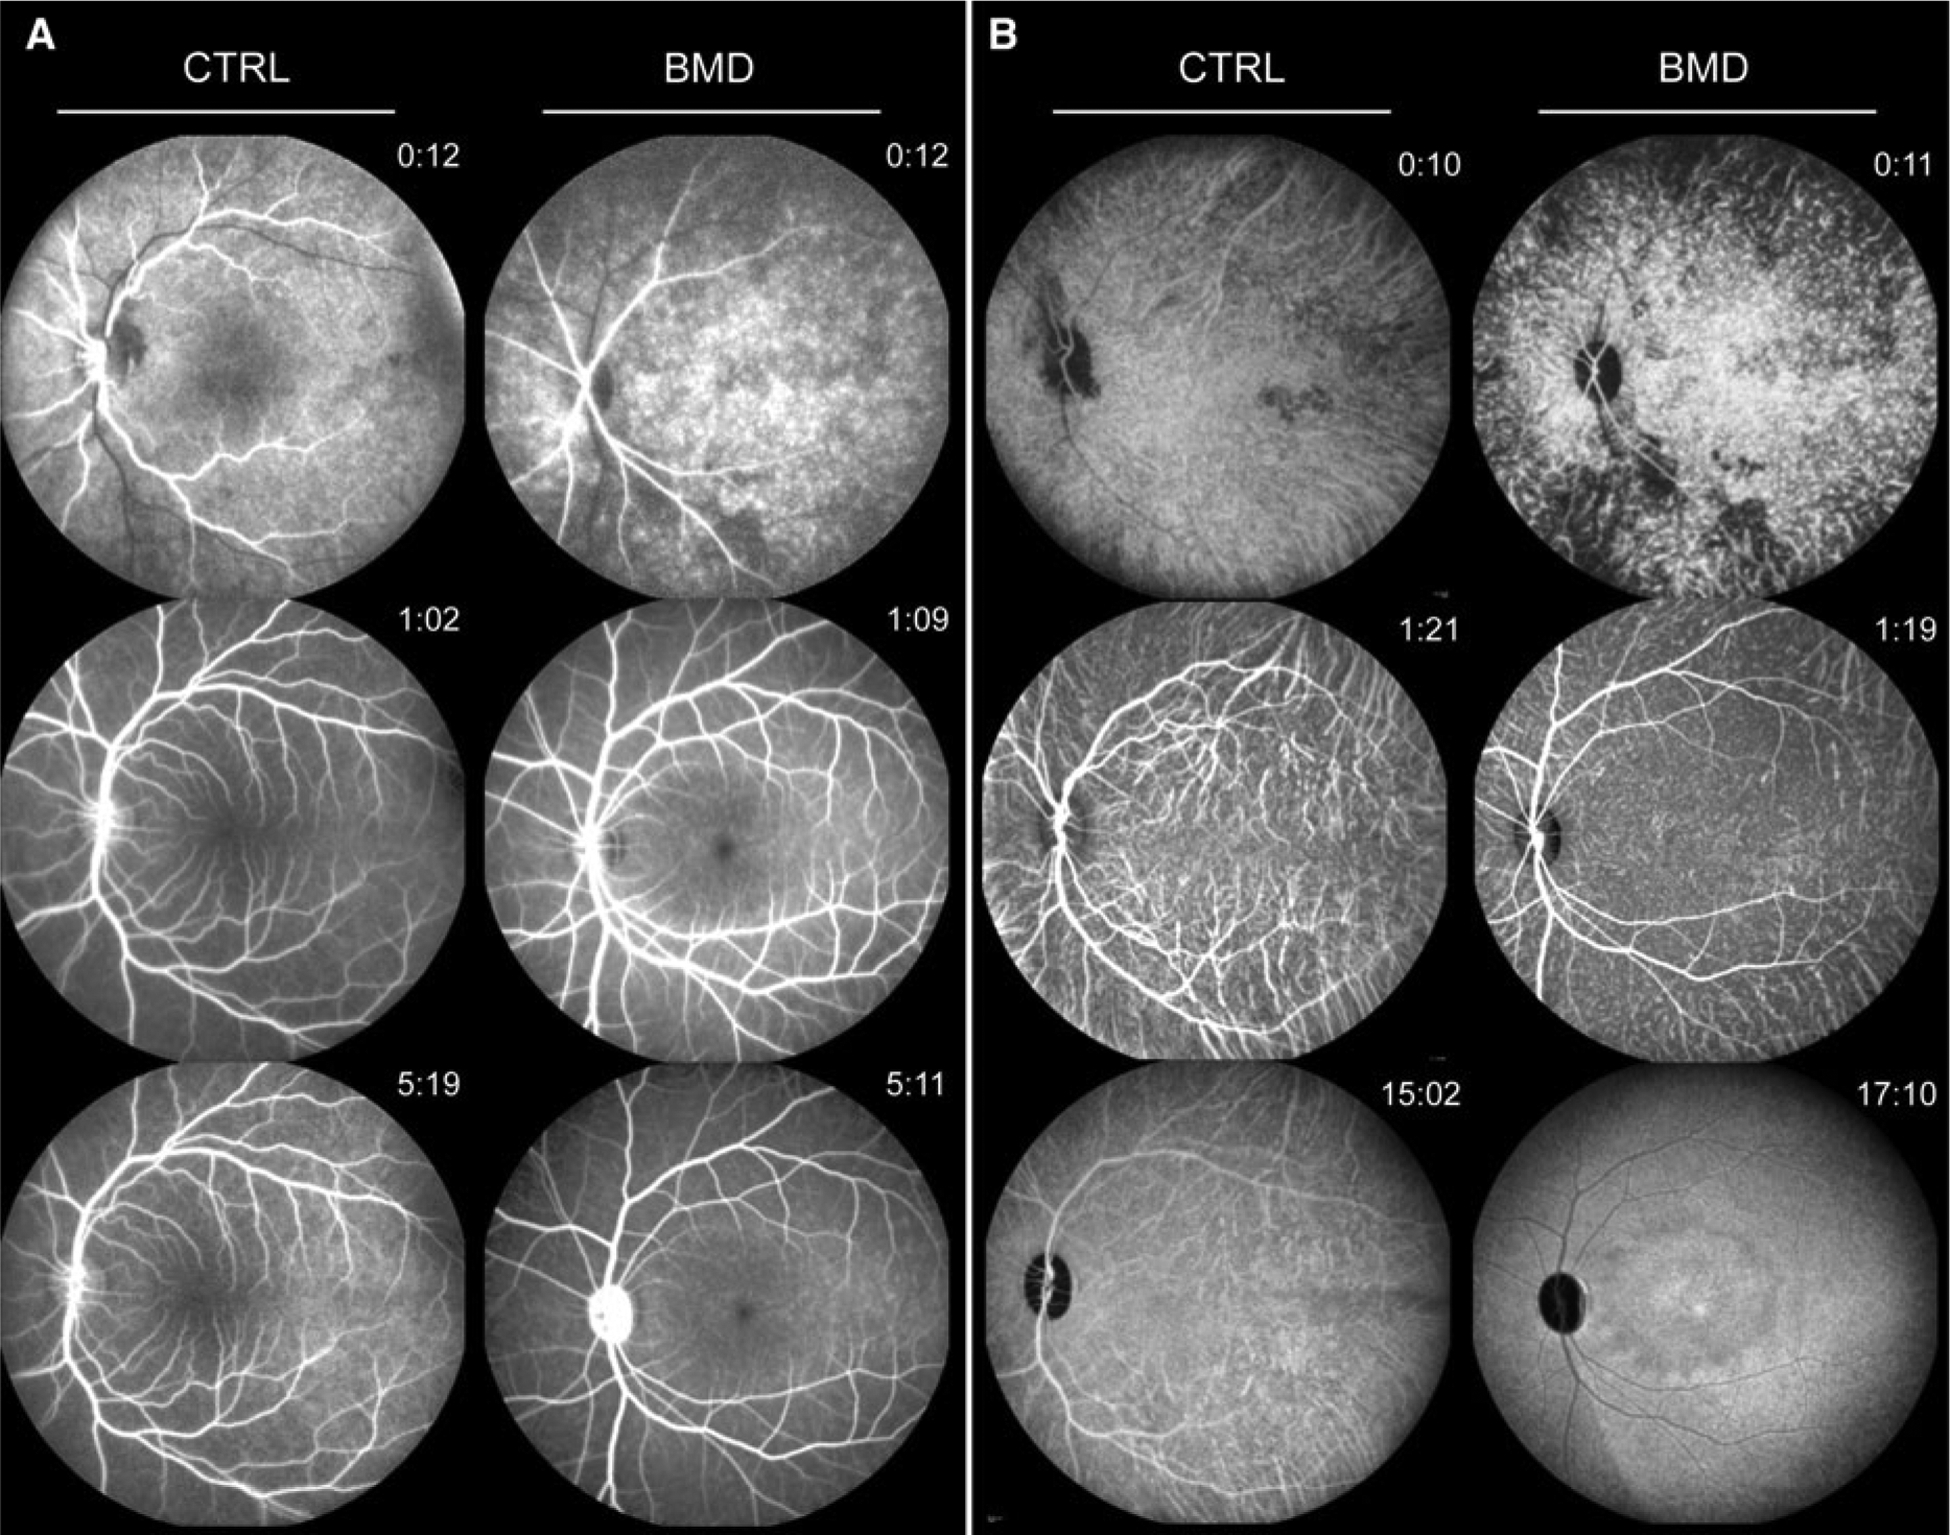
Retinal angiography of CTRL and BMD monkey. Sequential recordings during fluorescein (a) and indocyanine green (b) angiography demonstrate regular timing and distribution in the CTRL animal (left panels), while the BMD animal (right panels) shows a spotty filling pattern in the early phases (top), an enlarged foveal avascular zone (FAZ) at the posterior pole (middle) and a distinct pattern of hypo- and hyperfluorescence in the central retinal region at later stages (bottom)
Spectral domain optical coherence tomography
Interpolated retinal thickness profiles calculated from volume scans with 97 B-Scans at 30-μm intervals (Fig. 3) centered on the fovea revealed a total retinal thickness TRTCTRL = 303 ± 45 μm in the healthy control animal and TRTBMD = 174 ± 9 μm in the affected rhesus macaque (normal value mean = 304 μm (range 282–326 μm) as reported by Anger et al. [23]). Three-dimensional reconstruction of the retinal scans showed a near perfect rotational symmetry of the dramatic loss of central retinal tissue in BMD and the associated temporal optic atrophy (Figs. 3, 4). Horizontal radius of the atrophic area with minimal retinal thickness (center to “hard border”) was 2.47 mm/2.47 mm for the right eye (baseline/follow-up) and 2.21 mm/2.25 mm for the left eye. The retinal lesion therefore is predicted to result in a scotoma with 10.65°/10.63° (baseline/follow-up) eccentricity for the right eye and 9.53°/9.67° for the left eye. These data correspond very well with our fMRI data on the dimensions of the recorded cortical scotoma (10°) in the left eye of the BMD animal (see above and Fig. 1).
Fig. 3.

Optical coherence tomography of the macular region in the CTRL and BMD monkeys. Interpolated retinal thickness profile maps centered on the fovea demonstrate the severe macular dystrophy in the BMD (b) compared to the CTRL (a) animal. Total retinal thickness is markedly reduced in BMD, with the inner retinal layers much more affected than outer retinal layers with little change at follow-up (c). The foveal region (d) in the CTRL animal (left side) shows the normal slope from the foveal rim toward the foveal pit. In contrast, retinal nerve fiber, ganglion cell, inner plexiform and inner nuclear layers are essentially missing in the BMD animal (right side), and consequently, there is no foveal rim formation. Moreover, the outer retinal signal composition features a disorganization of the inner/outer segment border (I/OS) signal in the cone-only fovea. Interestingly, while more temporal aspects of the posterior pole e show a second highly reflective band that is thought to correspond to the cone outer segment tips (COST, arrowheads) in the CTRL monkey (left side), the same signal only starts to appear in the BMD animal toward the periphery beyond the dystrophic center (bottom right, arrowheads)
Fig. 4.

The retinal thickness profile map of the right eye (a) and a three-dimensional reconstruction (b) of the retinal scans show a near perfect rotational symmetry of the dramatic loss of central retinal tissue in BMD. The horizontal cross section d through the optic nerve head demonstrates the dystrophic macular area with corresponding temporal optic atrophy (asterisk). The peripapillary ring scan e centered on the optic nerve head (r = 3.4 mm) demonstrates relatively abrupt thinning of inner retinal layers central of the vascular arcades (ca. 0–45° and 315–360°), indicating a loss primarily of the papillomacular bundle (e). The full and empty arrow heads point to the superior and inferior retinal veins correspondingly, for orientation. Grid in a indicates circular areas of 0.8, 2.4 and 4.8 mm diameter. Dotted lines in a and b indicate 4.8 mm eccentricity
Segmentation analysis of retinal B-scans at either the foveal center (Fig. 3d) or the temporal aspect of the posterior pole (Fig. 3e) revealed severe atrophy of inner retinal layers (inner retinal thickness, IRTCTRL = 143 ± 45 μm vs. IRTBMD = 33 ± 9 μm, Fig. 3c; normal value mean = 159 μm (range 99–209 μm) as reported by Anger et al. [23]). While the retinal nerve fiber, ganglion cell, inner plexiform and inner nuclear layers were essentially missing in the atrophic area of BMD, the dimensions of outer retina layers were surprisingly well preserved. However, detailed analysis demonstrated a disorganization of the inner/outer segment border (I/OS) signal in the cone-only fovea (Fig. 3d), a structural aspect known to reflect photoreceptor dysfunction [24], and increased reflectivity in the otherwise hyporeflective outer segment layer. Interestingly, at the transition zone from BMD to more temporal aspects of the posterior pole, a second highly reflective band starts to emerge that is thought to arise from the cone outer segment tips (COST) (Fig. 3e). This suggests structural disintegration at the photoreceptor level in the central macula with gross inner retinal atrophy, while normal layering of the inner and outer retina can be observed peripheral of the transition zone. Conversely, the I/OS signal was equally strong throughout the posterior pole of the control animal with evidence of elongated outer segments in the central foveal region and easily detectable COST signal in the extrafoveal regions.
Horizontal B-scans through the optic nerve head (Fig. 4d) clearly showed the differences between temporal and nasal retinal morphology that underscored the site-specific pathology in BMD. Peripapillary ring scans centered on the optic nerve head (Fig. 4e) also demonstrated relatively abrupt thinning of inner retinal layers central of the vascular arcades (ca. 0–45° and 315–360°), indicating a loss primarily of the papillomacular bundle.
At follow-up after 1 year, the dimensions of the atrophic area remained essentially identical regarding the inner retinal thickness (IRTbaseline = 33 ± 9 μm vs. IRTfollow-up = 360 ± 9 μm), while the outer retinal thickness showed some degree of further reduction (ORTbaseline = 141 ± 7 μm vs. ORTfollow-up = 125 ± 8 μm), possibly indicating a degree of continuous neurodegeneration within the original region of macular involvement.
Histology
Histologic data highlight the dramatic loss of inner retinal components such as bipolar, amacrine and horizontal cells within the affected region in the BMD animal compared to CTRL (Fig. 5) and thereby support findings in vivo. Besides structural loss of inner retinal neurons, immunohistochemical labeling shows significant loss of cone ribbon synapses within the affected area.
Fig. 5.

Gross anatomy a demonstrates the atrophic aspect of the macula. Note the modest amount of yellow pigment appearing as macula lutea in the fovea. Note also the temporal atrophy of the optic nerve head. The red bar at the nasal-inferior border of the dystrophic area indicates the location from which the histological sections were taken. Labeling with CtBP2 (ribbon synapses and somata) demonstrates relatively well-preserved outer nuclear layer in the retinal region affected by MD (b) versus in the outer (unaffected) retina (c, CTRL). Staining with Gγ13 (ON bipolar cells) and GlyT1 (glycinergic amacrine cells) in the BMD d shows dramatic loss of inner nuclear layer neurons compared to CTRL retina (e) in the central atrophic areas (asterisks). This is also evident from parvalbumin (horizontal cell) and CtBP2 (ribbon synapses and somata) labeling in BMD (f–g) versus CTRL (h) sections. In the OPL of the CTRL retina, CtBP2 labeled ribbons appear as clusters of bands (arrows) in cone pedicles and as horseshoe-shaped structures (arrowheads) in rod terminals (h). The missing bands in the BMD OPL (g) indicate that cone synapses are more strongly affected than rod synapses in the BMD animal. Scale bars are 25 μm (b–f) and 10 μm (g–h)
Electrophysiology
Dark-adapted (scotopic) Ganzfeld-ERGs revealed similar response amplitudes to brief, low-intensity flashes for the BMD and the control animals (for the 0.01 cd * s/m2 flash 189 and 205 μV, respectively; BMD/CTRL ratio 0.92). With increasing flash intensities, the response amplitude in BMD increased less than in the control so that at the highest stimulus intensity the amplitude was significantly smaller in the BMD animal than in the control (237 and 343 μV for the 10 cd * s/m2 stimulus, respectively; BMD/CTRL ratio 0.69). These proportional changes of response amplitudes indicated a reduced cone system contribution, since cones are known to contribute significantly to the response waveforms of bright flashes under scotopic conditions. Response implicit times of the a- and b-wave were similar in the BMD and the control animal for all flash intensities, suggesting that the surviving photoreceptors provide physiologic or near physiologic signal processing (Fig. 6).
Fig. 6.

Ganzfeld-ERG responses according to the ISCEV Standards in the CTRL (gray curves) and the BMD animals at baseline (blue and red lines represent the right (OD) and left eye (OS) of the BMD animal, respectively). a, panels 1–4 Scotopic recordings show a well-preserved rod photoreceptor response in the BMD retinae (panel 1, rod response). The reduction in a-wave and b-wave amplitudes at brighter stimuli (panels 2 and 4, mixed rod-cone and high-intensity responses, respectively) under scotopic conditions suggests a reduction in the total number of functioning cone photoreceptors and bipolar cells in the BMD versus the CTRL retinas, while normal implicit times suggest unchanged signal transduction characteristics for the remaining cone photoreceptors and proximal neurons (b). This pattern becomes even more evident in photopic conditions (a, panels 5–6, cone single flash and 30-Hz flicker responses, respectively) where responses of the cone photoreceptor system and its downstream signaling pathway are clearly reduced in BMD compared to CTRL (c). At 1-year follow-up (broken blue and red lines and triangles), Ganzfeld-ERG results remain essentially unchanged. ERG electrophysiology, ISCEV international society for clinical electrophysiology of vision
The b/a-wave amplitude ratios of the standard flash responses were calculated to reveal differences in the contribution of the inner retina to the response waveforms, since a selective reduction in the b-wave amplitude would suggest a dysfunction of transmission in the inner retina, either in the photoreceptor synapses or in the postreceptoral pathway. The constellation, where the b/a ratio is equal to or smaller than 1, is termed a negative ERG. However, both the BMD and control animal results showed similar response amplitudes and waveforms as well as b/a ratios greater unity (b/a ratioBMD = 2.0, b/a ratioCTRL = 2.2) on the baseline and follow-up measurements as well (b/a ratioBMD = 1.9 at follow-up).
The photopic responses obtained after light adaptation showed even more reduced amplitudes in BMD compared to the control (45 and 147 μV for the 3 cd * s/m2 photopic flash, respectively; BMD/CTRL ratio, 0.3). Implicit times again were similar for both; 30-Hz flicker responses revealed a lower magnitude, but similar phase. Even though the retinal area contributing to the photopic waveforms was obviously reduced in the BMD animal, the timing of the responses was essentially normal, suggesting again that the remaining cone system’s physiological function was intact.
At follow-up after 1 year, the Ganzfeld-ERG responses obtained under scotopic and photopic adaptation were similar in amplitude, implicit time and b/a ratios, again consistent with a disease restricted to the macular area.
The multifocal ERG demonstrated reduced amplitudes at all eccentricities (ring 1–5), more pronounced in the central segment and the two adjacent rings (rings 1–3) covering a field of ca. 20° in diameter (Fig. 7). This area covered almost exactly the atrophic and largely avascular area observed in angiography and OCT imaging (Figs. 2, 3, 4). At 1-year follow-up, a similar reduction in response amplitude in the central hexagon was noticed. Implicit times at follow-up showed a prolongation, notably in rings 2–4. While small changes in amplitude may be within normal repeat variability and central variability may be attributed to worse signal-to-noise ratio, the combination with elongated implicit times could explain the slight progression (i.e., limited further reduction in the outer retinal thickness seen in the cross-sectional imaging in Fig. 3c) of the affected macular area. However, these changes in implicit time may also be within normal limits.
Fig. 7.

MfERG response arrays of the CTRL and the BMD retinae overlaid on retinal thickness maps reveal the correlation between functional and morphological changes in the BMD animal (a). Ring analysis of the mfERGs b shows the amplitudes (left side) and implicit times (right side) for each ring in BMD and CTRL (gray dots show CTRL results, and blue and red dots and triangles represent BMD responses at baseline and at follow-up, respectively). The analysis clearly shows a reduction in amplitudes, more pronounced in the central rings. While implicit times were similar at baseline, a delay is found for ring 2–4 at 1-year follow-up. MfERG multifocal electroretinography
Discussion
Many commonly used animal models such as mice and rats lack a central retinal region with higher optical resolution due to the increased cone photoreceptor, bipolar and ganglion cell density and rarefication of retinal vasculature to further reduce optical aberration. In contrast, rhesus macaque retinal architecture shows excellent correspondence to human retinal structure, and therefore, the macaque model would be ideal for studying inherited macular degeneration [20]. Unfortunately, there is only little information in the literature regarding naturally occurring macular degeneration in nonhuman primates.
When one particular animal from our colony of rhesus macaque monkeys showed no central visual modulation in fMRI experiments (Fig. 1) combined with altered bilateral macular reflexes at the posterior pole on direct ophthalmoscopy, it underwent a thorough ophthalmologic evaluation to potentially identify an primate model of macular degeneration. Imaging data suggested normal perfusion in the periphery regarding both retinal (FA) and choroidal (ICGA) vasculature (Fig. 2). In contrast, the macula showed a drastically enlarged FAZ covering a circular area of approximately 10° in radius centered at the posterior retinal pole. Within this well-circumscribed area, the retina appeared notably thinner in comparison with the control animal. Furthermore, SD-OCT images demonstrated a disorganization of the inner/outer segment border (I/OS) signal and a severe atrophy of inner retinal layers, indicating structural changes at the level of photoreceptors and loss of more proximal neurons. This observation was supported by immunohistochemical data in retinal sections from BMD vs. CTRL animals (Fig. 5). These demonstrated a dramatic loss of bipolar, amacrine and horizontal cells in the inner nuclear layer, while the outer nuclear layer seemed relatively intact. Interestingly, cone ribbon synapses in the outer plexiform layer were much more strongly affected than rod ribbon synapses, which is in line with the reduced responses seen under photopic conditions.
SD-OCT cross sections at the edge of the dystrophic macula showed increasing signal strength in a highly reflective band thought to indicate the cone photoreceptor outer segment tips (COST), suggesting that cone density returns gradually to normal outside the affected region (Fig. 3d), where the electrophysiological responses in mfERG analysis also begin to approach control levels (Fig. 7).
The retina of a healthy macaque contains an average of 3 million cones and 61 million rods, and their density peaks as well as their distribution pattern correspond well with human retinal architecture [6]. Rod density is particularly high in a 15° annulus around the fovea beginning 2–3 mm from the rod-free foveola and extending to 6–8 mm toward the periphery. Cone density, on the other hand, is highest in the foveola and first decreases exponentially in the first 2 mm eccentricity followed by an almost linear peripheral decline.
Based on these anatomical properties, the observed macular disease with a dystrophic area of ca. 6 mm diameter is predicted to cause a notable reduction in cone function. This is in line with our fMRI data of the left eye in the BMD animal, confirming a central scotoma with retinotopic representation in V1 reflecting the central ca. 10° (Fig. 1). Likewise, our Ganzfeld-ERG recordings show that the cone photoreceptor system and its downstream signaling pathway are clearly affected (Fig. 6). More specifically, the reduction in a-wave and b-wave amplitudes at brighter stimuli under scotopic conditions, and the even more decreased cone responses under photopic conditions suggest the reduction in the total number of functional cone photoreceptors and bipolar cells, respectively, while the normal implicit time suggests unchanged signal transduction characteristics for the remaining cone photoreceptors and proximal neurons in the more peripheral regions. Furthermore, multifocal ERG demonstrated reduced amplitudes more pronounced in the central three rings proving a good structure– function correlation as the bilateral macular dystrophy was limited to a central area of ca. 3 mm radius (Fig. 7). On a structural level, it is surprising to see the inner retinal layers being so selectively affected. However, while outer retinal thickness did not differ to the same amount between the affected and control animals, qualitative changes could be observed on close examination (Fig. 3). There is a clear disturbance of the highly reflective layer at the border between the inner and outer segment of photoreceptors in the outer retinal signal composition, which has been linked to photoreceptor dysfunction [24]. Extrafoveal OCT sections also showed specific attenuation of the COST signal in the dystrophic area with gradual recovery at the transitional zone, indicating structural changes at the level of the photoreceptor outer segments, where photons induce the phototransduction cascade ultimately leading to light perception.
Fortune and co-workers reported a disease phenotype in a number of rhesus macaques featuring idiopathic bilateral temporal optic atrophy (IBOA), affecting the papillomacular bundle with histologic evidence of axonal loss and gliosis limited to the temporal optic nerve. Functionally, the RNFL (retinal nerve fiber layer) loss correlated with substantial reduction in mfERG high-frequency components, while mfERG low-frequency components and all Ganzfeld-ERG amplitudes (a-wave, b-wave, oscillatory potentials or PhNR) were normal or even slightly increased [25]. The highly symmetric loss of retinal nerve fiber layer (RNFL) tissue in the papillomacular bundle of the BMD animal with its corresponding temporal atrophy of the optic nerve head compares well to this phenotype (Fig. 4). However, there are a number of striking differences to the pathology reported by Fortune. In contrast to IBOA, where the retinal nerve fiber layer/ganglion cell layer is selectively affected, in our case the inner nuclear layer is also grossly reduced in the area of atrophy, which is reflected functionally by the reduced b-wave amplitudes in the Ganzfeld-ERG (Fig. 6). Similarly, recent publications on tobacco-alcohol-induced toxic optic neuropathy in human also showed symmetric temporal optic disk pallor and RNFL loss in the papillomacular bundle, but no significant macular alterations distal of the RNFL [26]. As secondary temporal optic atrophy is a known feature in retinal dystrophies that primarily affect the macular region [27, 28], it seems feasible that the morphological changes at the temporal optic nerve head reflect a consequence of the macular dystrophy along with its increased FAZ and rarified choroidal vasculature. However, as the pathology was already evident at the first time point of investigation, we cannot be absolutely certain about a temporal and/or causal relation.
Considering the drastic changes during development of the fovea, developmental abnormalities can be considered as potential etiologic factor for the present phenotype. All adult primate foveae possess a central avascular region known as FAZ, which is a critical requirement for foveal pit formation. Several studies indicate that the absence of FAZ (where vessels overgrow the foveal area) results in a missing foveal pit and reduced visual acuity [29]. In some cases, this foveal hypoplasia was shown to be associated with PAX6 missense mutations, a gene well known to be involved in the morphogenesis of the eye [30]. Interestingly, our case shows rather opposite changes to foveal hypoplasia, that is, a marked enlargement of the FAZ and associated atrophic appearance of the whole macular region and sequencing of the PAX6 gene showed no pathogenic mutation. If the size of the FAZ determines the geometry of the foveal indentation, the observed macular malformation might be secondary to an abnormally expanded FAZ. However, it is currently unclear which factors would be involved at what stage of such a developmental abnormality, since such macular changes have not yet been observed.
On the other hand, secondary enlargement of FAZ is a frequent finding in patients with ischemic retinal diseases such as diabetic or hypertensive retinopathy. Likewise, enlarged FAZ was also reported in patients with retinal vein occlusion or sickle cell retinopathy [31]. However, in these conditions further ischemic symptoms, like microaneurysms, bleeding, cotton wool spots and neovascularization, are frequently seen. Such changes were not detected in our case, and the highly symmetrical macular morphology also argues against acquired diseases.
At 1-year follow-up, Ganzfeld-ERG results remained essentially unchanged, while multifocal ERGs suggested a slight progression of the disease in the central area, which corresponded with the noted changes of outer retinal atrophy. However, otherwise there was no evidence for disease progression. Considering all observations, the pathology seen in this animal can be best described as bilateral macular dystrophy (BMD) with atrophy of the temporal optic disk. BMD targets the cone-rich macula, thereby reducing the total number of functional cone photoreceptors. The remaining cones function well (normal implicit time) with a feature that characterizes maculopathies and distinguishes them from cone dystrophies. The first ever fluorescein angiography in such a case of maculopathy in a primate revealed an enlarged FAZ, and indocyanine green angiography additionally demonstrated widespread atrophy of choriocapillary networks underneath the dystrophic macula.
The fMRI data corroborate the link between structure and function by demonstrating a corresponding central scotoma of ca. 10° eccentricity in the primary visual cortex of the affected animal [32]. This is the first extensive structural and functional characterization of a primate with profound macular degeneration exploring its potential as animal model. While the etiology of BMD in this animal has remained elusive, the advances in the field of genetic sequencing promise cost-effective whole-exome sequencing in the near future. Publication of our findings is intended to spur awareness for detecting additional potential cases of primate BMD or related macular dystrophies in other laboratories eventually leading to the identification of Macaque models of this disease. Also, the fact that such a dramatic retinal pathology can lead to an inconspicuous behavioral pattern points toward the need for diagnostic screening before including nonhuman primates in preclinical studies, where visual function is critical for outcome measures.
Supplementary Material
Acknowledgments
We would like to thank Susanne Kohl and Nicole Weisschuh for sequencing the PAX6 gene and Matthias Munk and Henry Evrardj for perfusing the BMD animal. This study was supported by the Deutsche Forschungsgesellschaft (NKL), National Eye Institute (NEI) R01 grant EY019272 (SS) and National Institute of Neurological Disorders and Stroke (NINDS) R21NS059607 (SS).
Footnotes
Electronic supplementary material The online version of this article (doi:10.1007/s10633-012-9340-3) contains supplementary material, which is available to authorized users.
Conflict of Interest The study sponsors had no role in study design; in the collection, analysis and interpretation of data; in the writing of the report; and in the decision to submit the paper for publication. Furthermore, the authors state that they have full control of all primary data and that they agree to allow interested parties to review their data if requested.
References
- 1.El-Mofty A, Gouras P, Eisner G, Balazs EA (1978) Macular degeneration in rhesus monkey (Macaca mulatta). Exp Eye Res 27(4):499–502 [DOI] [PubMed] [Google Scholar]
- 2.Dawson WW, Dawson JC, Lake KP, Gonzalez-Martinez J (2008) Maculas, monkeys, models, AMD and aging. Vision Res 48(3):360–365 [DOI] [PubMed] [Google Scholar]
- 3.Saperstein DA (1995) Advances in macular dystrophies. Int Ophthalmol Clin 35(4):19–35 [PubMed] [Google Scholar]
- 4.Williams RA, Brody BL, Thomas RG, Kaplan RM, Brown SI (1998) The psychosocial impact of macular degeneration. Arch Ophthalmol 116(4):514–520 [DOI] [PubMed] [Google Scholar]
- 5.Fletcher EL, Jobling AI, Vessey KA, Luu C, Guymer RH, Baird PN (2011) Animal models of retinal disease. Prog Mol Biol Transl Sci 100:211–286 [DOI] [PubMed] [Google Scholar]
- 6.Wikler KC, Williams RW, Rakic P (1990) Photoreceptor mosaic: number and distribution of rods and cones in the rhesus monkey retina. J Comp Neurol 297(4):499–508 [DOI] [PubMed] [Google Scholar]
- 7.Logothetis NK, Guggenberger H, Peled S, Pauls J (1999) Functional imaging of the monkey brain. Nat Neurosci 2(6):555–562 [DOI] [PubMed] [Google Scholar]
- 8.Keliris GA, Shmuel A, Ku SP, Pfeuffer J, Oeltermann A, Steudel T, Logothetis NK (2007) Robust controlled functional MRI in alert monkeys at high magnetic field: effects of jaw and body movements. Neuroimage 36(3):550–570 [DOI] [PubMed] [Google Scholar]
- 9.Dumoulin SO, Wandell BA (2008) Population receptive field estimates in human visual cortex. Neuroimage 39(2): 647–660 [DOI] [PMC free article] [PubMed] [Google Scholar]
- 10.Wandell BA, Chial S, Backus BT (2000) Visualization and measurement of the cortical surface. J Cogn Neurosci 12(5): 739–752 [DOI] [PubMed] [Google Scholar]
- 11.Tootell RB, Switkes E, Silverman MS, Hamilton SL (1988) Functional anatomy of macaque striate cortex. II. Retino topic organization. J Neurosci 8(5):1531–1568 [DOI] [PMC free article] [PubMed] [Google Scholar]
- 12.Van Essen DC, Newsome WT, Maunsell JH (1984) The visual field representation in striate cortex of the macaque monkey: asymmetries, anisotropies, and individual variability. Vision Res 24(5):429–448 [DOI] [PubMed] [Google Scholar]
- 13.LeVay S, Connolly M, Houde J, Van Essen DC (1985) The complete pattern of ocular dominance stripes in the striate cortex and visual field of the macaque monkey. J Neurosci 5(2):486–501 [DOI] [PMC free article] [PubMed] [Google Scholar]
- 14.Dow BM, Vautin RG, Bauer R (1985) The mapping of visual space onto foveal striate cortex in the macaque monkey. J Neurosci 5(4):890–902 [DOI] [PMC free article] [PubMed] [Google Scholar]
- 15.Fischer MD, Huber G, Beck SC, Tanimoto N, Muehlfriedel R, Fahl E, Grimm C, Wenzel A, Reme CE, van de Pavert SA, Wijnholds J, Pacal M, Bremner R, Seeliger MW (2009) Noninvasive, in vivo assessment of mouse retinal structure using optical coherence tomography. PLoS One 4(10): e7507. [DOI] [PMC free article] [PubMed] [Google Scholar]
- 16.Huber G, Beck SC, Grimm C, Sahaboglu-Tekgoz A, Paquet-Durand F, Wenzel A, Humphries P, Redmond TM, Seeliger MW, Fischer MD (2009) Spectral domain optical coherence tomography in mouse models of retinal degeneration. Invest Ophthalmol Vis Sci 50(12):5888–5895 [DOI] [PMC free article] [PubMed] [Google Scholar]
- 17.Huber G, Heynen S, Imsand C, vom Hagen F, Muehlfriedel R, Tanimoto N, Feng Y, Hammes HP, Grimm C, Peichl L, Seeliger MW, Beck SC (2010) Novel rodent models for macular research. PLoS One 5(10):e13403. [DOI] [PMC free article] [PubMed] [Google Scholar]
- 18.Helb HM, Charbel Issa P, Fleckenstein M, Schmitz-Valckenberg S, Scholl HP, Meyer CH, Eter N, Holz FG (2010) Clinical evaluation of simultaneous confocal scanning laser ophthalmoscopy imaging combined with high-resolution, spectral-domain optical coherence tomography. Acta Ophthalmol 88(8):842–849 [DOI] [PubMed] [Google Scholar]
- 19.Marmor MF, Fulton AB, Holder GE, Miyake Y, Brigell M, Bach M (2009) ISCEV Standard for full-field clinical electroretinography (2008 update). Doc Ophthalmol 118(1): 69–77 [DOI] [PubMed] [Google Scholar]
- 20.Kong X, Wang K, Sun X, Witt RE (2010) Comparative study of the retinal vessel anatomy of rhesus monkeys and humans. Clin Exp Ophthalmol 38(6):629–634 [DOI] [PubMed] [Google Scholar]
- 21.Bertram B, Wolf S, Fiehofer S, Schulte K, Arend O, Reim M (1991) Retinal circulation times in diabetes mellitus type 1. Br J Ophthalmol 75(8):462–465 [DOI] [PMC free article] [PubMed] [Google Scholar]
- 22.Walter P, Mazinani B (2010) Macular dystrophies–hereditary macular degenerations. Klin Monatsbl Augenh 227(1): R1–R14 [DOI] [PubMed] [Google Scholar]
- 23.Anger EM, Unterhuber A, Hermann B, Sattmann H, Schubert C, Morgan JE, Cowey A, Ahnelt PK, Drexler W (2004) Ultrahigh resolution optical coherence tomography of the monkey fovea. Identification of retinal sublayers by correlation with semithin histology sections. Exp Eye Res 78(6): 1117–1125 [DOI] [PubMed] [Google Scholar]
- 24.Fischer MD, Fleischhauer JC, Gillies MC, Sutter FK, Helbig H, Barthelmes D (2008) A new method to monitor visual field defects caused by photoreceptor degeneration by quantitative optical coherence tomography. Invest Ophthalmol Vis Sci 49(8):3617–3621 [DOI] [PubMed] [Google Scholar]
- 25.Fortune B, Wang L, Bui BV, Burgoyne CF, Cioffi GA (2005) Idiopathic bilateral optic atrophy in the rhesus macaque. Invest Ophthalmol Vis Sci 46(11):3943–3956 [DOI] [PubMed] [Google Scholar]
- 26.Moura FC, Monteiro ML (2010) Evaluation of retinal nerve fiber layer thickness measurements using optical coherence tomography in patients with tobacco-alcohol-induced toxic optic neuropathy. Indian J Ophthalmol 58(2):143–146 [DOI] [PMC free article] [PubMed] [Google Scholar]
- 27.Newman NM, Stevens RA, Heckenlively JR (1987) Nerve fibre layer loss in diseases of the outer retinal layer. Brit J Ophthalmol 71(1):21–26 [DOI] [PMC free article] [PubMed] [Google Scholar]
- 28.Newman NJ (1993) Optic disc pallor: a false localizing sign. Surv Ophthalmol 37(4):273–282 [DOI] [PubMed] [Google Scholar]
- 29.Provis JM, Hendrickson AE (2008) The foveal avascular region of developing human retina. Arch Ophthalmol 126(4):507–511 [DOI] [PubMed] [Google Scholar]
- 30.Azuma N, Nishina S, Yanagisawa H, Okuyama T, Yamada M (1996) PAX6 missense mutation in isolated foveal hypoplasia. Nat Genet 13(2):141–142 [DOI] [PubMed] [Google Scholar]
- 31.Parodi MB, Visintin F, Della Rupe P, Ravalico G (1995) Foveal avascular zone in macular branch retinal vein occlusion. Int Ophthalmol 19(1):25–28 [DOI] [PubMed] [Google Scholar]
- 32.Drasdo N, Fowler CW (1974) Non-linear projection of the retinal image in a wide-angle schematic eye. Brit J Ophthalmol 58(8):709–714 [DOI] [PMC free article] [PubMed] [Google Scholar]
Associated Data
This section collects any data citations, data availability statements, or supplementary materials included in this article.