

Abstract
As one of the thalamic midline nuclei, the thalamic paraventricular nucleus (PVT) is considered to be an important signal integration site for many descending and ascending pathways that modulate a variety of behaviors, including feeding, emotions, and drug-seeking. A recent study has demonstrated that the PVT is implicated in the acute visceral pain response, but it is unclear whether the PVT plays a critical role in the central processing of chronic pain. Here, we report that the neurons in the posterior portion of the PVT (pPVT) and their downstream pathway are involved in descending nociceptive facilitation regarding the development of neuropathic pain conditions in male rats. Lesions or inhibition of pPVT neurons alleviated mechanical allodynia induced by spared nerve injury (SNI). The excitability of pPVT-central amygdala (CeA) projection neurons was significantly increased in SNI rats. Importantly, selective optogenetic activation of the pPVT-CeA pathway induced obvious mechanical hypersensitivity in naive rats. In addition, we used rabies virus (RV)-based and cell-type-specific retrograde transsynaptic tracing techniques to define a novel neuronal circuit in which glutamatergic neurons in the vlPAG were the target of the pPVT-CeA descending facilitation pathway. Our data suggest that this pPVTGlu+-CeA-vlPAGGlu+ circuit mediates central mechanisms of descending pain facilitation underlying persistent pain conditions.
SIGNIFICANCE STATEMENT Studies have shown that the interactions between the posterior portion of the thalamic paraventricular nucleus (pPVT) and central amygdala (CeA) play a critical role in pain-related emotional regulation. However, most reports have associated this circuit with fear and anxiety behaviors. Here, an integrative approach of behavioral tests, electrophysiology, and immunohistochemistry was used to advance the novel concept that the pPVT-CeA pathway activation facilitates neuropathic pain processing. Using rabies virus (RV)-based and cell-type-specific retrograde transsynaptic tracing techniques, we found that glutamatergic neurons in the vlPAG were the target of the pPVT-CeA pathway. Thus, this study indicates the involvement of a pPVTGlu+-CeA-vlPAGGlu+ pathway in a descending facilitatory mechanism underlying neuropathic pain.
Keywords: central amygdala, descending facilitation, pain, thalamic paraventricular nucleus, ventrolateral periaqueductal gray
Introduction
It has been well recognized that the thalamus is the principal gateway for the transmission of various sensory information from the periphery to the cortex (Kolaj et al., 2014). The thalamic midline nuclei, initially considered “nonspecific,” have recently gained recognition for their involvement in a variety of distinct functions, such as stress, motivation and mood (Hsu et al., 2014; Kirouac, 2015). Interestingly, some midline nuclei have been verified to function as novel “nociceptive discriminators” and form two distinct endogenous systems that control noxious responses: the mediodorsalnucleus of the thalamus (MD) that participates in the descending facilitation underlying the development of mechanical allodynia and the ventromedial nuclei of the thalamus (VMs) that specifically mediates the descending inhibition of thermal hyperalgesia in rats (You et al., 2013).
Recently, the thalamic paraventricular nucleus (PVT), another thalamic midline nucleus, has also attracted increasing attention for its function. Based on anatomic connectivity and functions, the PVT is divided into anterior (aPVT) and posterior (pPVT) portions along the rostrocaudal axis (Li and Kirouac, 2012; Li et al., 2014; Dong et al., 2017). The pPVT is associated with fear and anxiety via projections to the bed nucleus of the stria terminalis (BNST) and the amygdala (Li and Kirouac, 2008; Li et al., 2010; Kirouac, 2015). Interestingly, chemogenetic inhibition of PVT neurons has been shown to attenuate acute pancreatitis-related visceral pain (Jurik et al., 2015), although its mechanisms including its downstream neural circuitry, are not fully understood.
The central amygdala (CeA) is now defined as the “nociceptive amygdala” and contains a population of neurons involved in processing pain-related information (Han et al., 2005; Nakao et al., 2012). Notably, the pPVT has denser projections to the CeA than to other amygdaloid nuclei (Li and Kirouac, 2008; Vertes and Hoover, 2008; Kuramoto et al., 2009), and the pPVT-CeA pathway has been identified to play a vital role in fear learning and memory (Do-Monte et al., 2015; Penzo et al., 2015). Nevertheless, whether the pPVT-CeA pathway is involved in nociception transmission or modulation remains unclear.
There are many complicated neural circuits in the brain stem involved in descending pain modulation, in which the periaqueductal gray (PAG)-rostral ventromedial medulla (RVM)-spinal dorsal horn (SDH) pathway is recognized as the classical and most essential central endogenous descending pain system (Millan, 2002; Heinricher et al., 2009). Therefore, the PAG is considered to be a key site for the integration of descending pain modulation. One strong downstream target of the CeA is the PAG, especially the ventrolateral subregion of the PAG (vlPAG; Rizvi et al., 1991). According to the aforementioned literature evidence, we hypothesize that the pPVT might function through the CeA and vlPAG to affect the endogenous pain modulating system.
Here, using neuroanatomical tracing methods, chemogenetic and optogenetic approaches, we anatomically and functionally define a novel pathway from the pPVT to the vlPAG via the CeA (that is, the pPVT-CeA-vlPAG pathway) that is involved in descending pain facilitation.
Materials and Methods
Animals
Sprague Dawley male rats and VGLUT2-ires-Cre male mice were used. The Sprague Dawley rats were purchased from the Laboratory Animal Center of the Fourth Military Medical University; the animals weighed 260–320 g (specifically, 80–100 g for electrophysiology). The VGLUT2-ires-Cre mice (20–25 g) were purchased from The Jackson Laboratory. The animals were housed in a 12/12 h light/dark cycle with free access to food and water, and all experiments were performed during the light cycle between 8 A.M. and 6 P.M. All procedures were conducted in accordance with the International Association for the Study of Pain guidelines (Zimmermann, 1983) for the care and use of laboratory animals and were approved by the Ethics Committee of Animal Use for Research and Education of the Fourth Military Medical University (Xi'an, People's Republic of China).
Neuronal tract tracing
Neuronal tract tracing was performed on the rats as previously described (Liang et al., 2016). Briefly, the rats were deeply anesthetized with pentobarbital sodium (50 mg/kg, i.p.) and then mounted on a stereotaxic apparatus (Narishige Scientific Instrument Lab). The tracers used in this study include the anterograde tracer biotinylated dextran amine (BDA; D1956, 10,000 MW; Invitrogen), retrograde tracers Fluoro-Gold (FG; 80014, Biotium), and tetramethylrhodamine-dextran (TMR; D3308, 3000 MW, Invitrogen) that were stereotaxically pressure-injected into the related nuclei through different glass micropipettes (internal tip diameter, 50–80 µm) attached to a 1-µl Hamilton microsyringe. The injections were performed on the right side according to the atlas of the brain created by Paxinos and Watson (Paxinos and Watson, 2007), and the coordinates were as follows: 2.3–2.5 mm posterior to the bregma, 4.3 mm lateral to the midline, and 8.3 mm ventral to the skull surface for the CeA; 3.2–3.4 mm posterior, 0.3 mm lateral, and 5.6 mm ventral to the bregma, midline, and skull surface, respectively, for the pPVT; and 7.8–8.0 mm posterior, 0.6 mm lateral, and 5.8 mm ventral to the bregma, midline, and skull surface, respectively, for the vlPAG. After surgery, the rats were allowed to survive for 7 d.
BDA (0.06 µl, 10%, dissolved in distilled water), FG (0.04 µl, 4%, dissolved in distilled water), or TMR (0.05 µl, 10%, dissolved in trisodium citrate solution; pH 3.0; Kaneko et al., 1996) were each stereotaxically pressure-injected into the CeA, separately. Then, 0.04 µl of 10% BDA was pressure-injected into the pPVT and 0.04 µl of 4% FG was pressure-injected into the ipsilateral vlPAG.
Establishment of a pain model
In the present study, we used spared nerve injury (SNI) to establish a neuropathic pain model, which has been reported previously (Decosterd and Woolf, 2000). Briefly, the rats received general anesthesia with pentobarbital sodium (50 mg/kg, i.p.). After disinfection, the sciatic nerve and its three terminal branches on the left side were clearly exposed by small incisions made on the skin and to the biceps femoris muscle in the left thigh. Two ligations were made on the common peroneal and tibial branches with 5–0 silk sutures. Then, the nerves were cut between the ligations, and 2–4 mm of the distal nerve stump was removed. The muscular fascia and skin were closed. Those in the sham group underwent the same surgery procedures, except they did not undergo ligation or the cutting of the nerves.
Behavioral tests
SNI-induced mechanical allodynia was assessed by measuring the paw withdrawal threshold (PWT) of the ipsilateral hind paw. After the rats were acclimated for 30 min, a series of von Frey filaments (Stoelting) from 0.16 to 26.0 g were applied to the plantar surface of the hind paw with a sufficient force to bend the filaments for 5 s. A sharp withdrawal of the hind paw was recorded as a positive response. The minimal value, that elicited at least six positive responses in 10 stimuli for every filament, was recorded as the PWT. The PWT baseline values of the normal rats selected in our experiment were 10–15 g. Experimental subjects had unique number identifiers and the behavioral experimenters were blinded to the animal grouping.
Chemical lesions
A combination of chemical lesions in the pPVT by caused kainic acid (KA; MKBS7052 V, Sigma-Aldrich) and behavioral tests were used to observe the roles of the pPVT in neuropathic pain development. The rats were randomly divided into five groups: sham, SNI, sham + KA, SNI + saline, and SNI + KA. In the SNI + saline or SNI + KA groups, the rats received brain stereotaxic injections of 0.5 µl of KA (1 mg/ml) or 0.9% saline into the bilateral pPVT (midline, 3.3 mm posterior to the bregma and 5.6 mm ventral to the skull surface), respectively, before the SNI. Behavioral tests with von Frey filaments were conducted on days 4, 7, 10, 14, 21, and 28 after the SNI. After behavioral tests were completed, the rats were perfused with fixative. Neuronal nuclei (NeuN)-labeled neurons and astrocytes labeled by glial fibrillary acidic protein (GFAP) in the pPVT were used to examine and reconstruct the lesion region. Behavioral data collected from the rats in which only lesion areas were restricted to the bilateral pPVT were used for further analysis.
Virus injections and chemogenetics
We used a chemogenetic approach with designer receptors exclusively activated by designer drugs (DREADDs; Farrell and Roth, 2013) to inhibit pPVT neurons. An AAV virus with the CaMKIIa promotor can specifically infect excitatory neurons. Additionally, hM4Di is an artificial receptor modified from human muscarinic acetylcholine receptor M4 (Armbruster et al., 2007; Whissell et al., 2016) that is potently activated by clozapine-N-oxide (CNO). In neurons, the binding of CNO with hM4Di hyperpolarizes the cell membrane and inhibits the action potential of neurons. Based on reports that pPVT neurons are mainly glutamatergic, we used the virus AAV2/9-CaMKIIa-hM4Di-mCherry (PT-0017, 7.36 × 10¹² genome copies/ml, BrainVTA) to inhibit excitatory neuronal activity in the pPVT. First, the rats received injections of 0.5 µl of AAV2/9-CaMKIIa-hM4Di-mCherry or AAV2/9-CaMKIIa-mCherry (PT-01008, 5.84 × 10¹² genome copies/ml, BrainVTA) into the pPVT (midline, 3.3 mm posterior to bregma and 5.6 mm ventral to the skull surface), and then SNI surgery was performed 18 d after AAV virus injection. Ten days later, the rats were given von Frey tests before and 30 min after CNO (C4759, 2 mg/kg, LKT Laboratories) administration intraperitoneally. The PWT was measured 40 min after the CNO injection. Finally, the rats were perfused to examine viral infections in the pPVT.
Fluorescence in situ hybridization (FISH) combined with retrograde tract tracing
FISH was used to observe the expression of vesicular glutamate transporters (VGLUT1 and VGLUT2) that are generally considered markers for glutamatergic neurons. Here, we first observed that the pPVT neurons were positive for VGLUT1 or VGLUT2 mRNA and then mainly examined whether the retrogradely labeled pPVT neurons projecting to the CeA expressed VGLUT2 mRNA.
For RNA probe preparation, the preparation methods of the digoxigenin-labeled RNA probes was the same as those described in Ge's article (Ciocchi et al., 2010). The complementary DNA fragment of VGLUT1 (nucleotides 152-1085; GenBank accession No. NM_182993.2; Watakabe et al., 2006) or VGLUT2 (848–2044; NM_080853.2; Nakamura et al., 2007) was cloned into a vector pBluescript II KS(+) (Stratagene). By using linearized plasmids (kindly presented by Hioki, Department of Brain Morphology, School of Medicine, Kyoto University) as template, we synthesized sense and antisense single-strand RNA probes with a digoxigenin RNA labeling kit (Roche Diagnostics).
For double labeling with FISH and immunofluorescence, the following hybridization procedure was conducted according to Hioki's literature (Hioki et al., 2010). Briefly, the rats injected with TMR into the right CeA were deeply anesthetized with sodium pentobarbital (40 mg/kg) and then perfused with 0.01 m PBS (pH 7.4) and 0.1 m phosphate buffer (PB; pH 7.4) treated with 0.1% (v/v) diethyl pyrocarbonate (DEPC; DH098-2, Genview). Then, the sections were hybridized under aseptic conditions to maintain an ribonuclease (RNase)-free state. The free-floating sections were prehybridized for 1–1.5 h in a prehybridization buffer, which consisted of 5× saline sodium citrate (SSC; 1× SSC = 0.15 m NaCl and 0.015 m sodium citrate, pH 7.0), 2% (w/v) blocking reagent (Roche Diagnostics), 50% (v/v) formamide, 0.1% (w/v) N-lauroylsarcosine (NLS), and 0.1% (w/v) sodium dodecyl sulfate (SDS). Then, 1 μg/ml of a digoxigenin-labeled VGLUT1 or VGLUT2 riboprobe was added to the prehybridization buffer and sections were incubated for 20–24 h at 58°C. After two washes in 2× SSC, 50% (v/v) formamide and 0.1% (w/v) NLS for 20 min at 58°C, the sections were incubated with 20 μg/ml RNase A for 30 min at 37°C in 10 mm Tris-HCl (pH 8.0), 1 mm ethylenediaminetetraacetic acid and 0.5 m NaCl, followed by two washes with 0.2× SSC containing 0.1% (w/v) NLS for 20 min at 37°C.
After the washing and RNase treatment steps, the hybridized sections were incubated overnight at room temperature (RT; 22–24°C) with a mixture of peroxidase-conjugated antidigoxigenin sheep antibody (1:1000, Roche Diagnostics catalog #11-207-733-910, RRID:AB_514500) and rabbit anti-TMR antibody (1:200, Invitrogen catalog #A6397, RRID:AB_1502299) in 0.1 M. Tris-HCl (pH 7.5)-buffered 0.9% (w/v) saline (TS7.5) containing 1% blocking reagent (TSB). To amplify the signals for VGLUT1 or VGLUT2 mRNA, we performed the biotinylated tyramine (BT)-glucose oxidase (GO) amplification method (Kuramoto et al., 2009) with a reaction mixture containing 1.25 μm BT, 3 μg/ml GO, 2 mg/ml β-D-glucose, and 1% bovine serum albumin (BSA) in 0.1 m PB for 30 min. The sections were then incubated with Alexa Fluor 594-conjugated donkey anti-rabbit IgG (1:500, Invitrogen catalog #A21207, RRID:AB_141637) in TSB for 4 h and then with FITC-avidin (1:1000, Vector catalog #A-2001, RRID:AB_2336455) in TSB for 2 h. The specificity of the hybridization reaction was verified by processing some sections treated with labeled sense probes instead of with antisense probes. Labeling was not observed under these conditions.
Electrophysiology
A week after TMR injection into the CeA and SNI model, the rats weighing 80–100 g were anesthetized with pentobarbital sodium (50 mg/kg, i.p.) and then decapitated. Coronal slices (400 μm) containing the pPVT were cut at 2–4°C on a vibrating microtome (Leica VT 1200s) in sucrose artificial CSF (sucrose-aCSF), which contained the following: 2.5 mm KCl, 1.2 mm NaH2PO4, 26 mm NaHCO3, 220 mm sucrose, 6 mm MgSO4, 0.5 mm CaCl2, and 10 mm glucose with a pH of 7.4. Sucrose-aCSF solutions were bubbled with carbogen gas (95% O2 and 5% CO2). Then, the brain slices were transferred to a submerged recovery chamber with oxygenated normal-sodium aCSF containing the following: 124 mm NaCl, 2.5 mm KCl, 2 mm MgSO4, 1 mm NaH2PO4, 25 mm NaHCO3, 2 mm CaCl2, and 37 mm glucose. The slices were incubated for 2 h at RT before recording.
The slices were transferred to a recording chamber (volume: 0.5 ml) that was mounted on a fixed-stage upright microscope (BX51W1, Olympus). The slices were continuously perfused with normal-aCSF bubbled with carbogen gas at a rate of 2–3 ml/min. The patch pipettes were constructed with a P-97 micropipette puller (Sutter Instruments) from borosilicate glass capillary tubes (outside diameter: 1.5 mm, inside diameter: 0.84 mm with microfilaments, 1B150F-4, World Precision Instruments). The pipette resistances were 3–5 MΩ when filled with the internal pipette solution, which contained the following: 130 mm K-gluconate, 5 mm NaCl, 15 mm KCl, 0.4 mm EGTA, 10 mm HEPES, 4 mm Mg-ATP, and 0.2 mm Tris-GTP. This solution was titrated to pH 7.3 with KOH. The osmolality of the pipette solutions was adjusted to 290–300 mOsm. Whole-cell patch-clamp recordings were made from TMR-containing neurons projecting to the CeA that were visualized by epifluorescence using a tetramethyl rhodamine isothiocyanate (TRITC) filter set (U-HGLGPS, Olympus) with a monochrome CCD camera (IR-1000E, DAGE-MTI) and monitor. The neurons were recorded using a Multiclamp 700B amplifier (Molecular Devices). The pCLAMP software (v. 10.02, Molecular Devices) was used to acquire and analyze the data. The signals were low-pass filtered at 2.6 kHz, digitized at 10 kHz (Digidata 1322A, Molecular Devices), and saved on a computer for offline analysis. Before collecting the data, the neurons were given at least 3 min to stabilize. Spontaneous EPSCs (sEPSCs) and the minimum current required to elicit an action potential (rheobase current) were used to investigate SNI-induced changes in neuronal excitability in the pPVT. The sEPSCs of neurons retrogradely labeled with TMR were voltage-clamped and recorded at −60 mV after blocking GABAergic transmission by picrotoxin (100 mm, Sigma), a GABAA receptor antagonist. The rheobase current was measured in current-clamp mode by injecting pulse steps of depolarizing current (steps of 5 pA for 15 ms) until action potentials were induced. The threshold of action potentials was measured at the beginning of the fastest rising phase. In all recordings, the initial access resistance was ≤30 MΩ and monitored throughout the experiment. Data were discarded if the access resistance changed by >15% during the experiment. Seven (control group) or six (SNI group) rats were used for electrophysiology recordings. One to two coronal brain slices (400 μm for each) containing the pPVT were cut from one animal, and only one neuron in the pPVT was recorded for the electrophysiology from each slice.
To identify the morphologic properties of the recorded neurons, 0.2% biocytin (Sigma) was added to the recording pipette solution. After recording, the brain slices were immediately fixed in 4% paraformaldehyde made with 0.1 m PB for 4 h at RT. In addition, brain slices were subsequently stored in 30% sucrose solution overnight at 4°C. After a thorough washing with PBS, the tissue was incubated with a rabbit anti-TMR antibody, 1:200 (Invitrogen catalog #A6397, RRID:AB_1502299), for 24 h followed by an incubation in a mixture of FITC-avidin, 1:1000 (Vector catalog #A-2001, RRID:AB_2336455), and Alexa Fluor 594-conjugated donkey anti-rabbit IgG, 1:500 (Invitrogen catalog #A21207, RRID:AB_141637), antibodies in PBS for 4–6 h at RT.
Virus injections and optogenetics
To optogenetically (Park and Carmel, 2016; Rajasethupathy et al., 2016) activate the pPVT-CeA pathway, a volume of 0.3 μl AAV2/9-CaMKIIa-ChR2(E123T/T159C)-mCherry (PT-0005, 4.30 × 10¹² genome copies/ml, BrainVTA) was injected into the right pPVT. The light-sensitive protein channel rhodopsin (ChR2) can induce the opening of cation channels, promote neuronal depolarization, and then evoke an action potential to activate neurons under the excitation of blue light (the maximum excitation peak is near 470 nm). AAV2/9-CaMKIIa-mCherry (PT-01008, 5.84 × 10¹² genome copies/ml, BrainVTA) was used as a control virus. The rats were allowed to survive for five weeks. Then, all rats were anesthetized with isofluorane by an animal anesthesia machine (HSIV-130105055, Shanghai Raymain Information Technology Co, Ltd.), and fiber optic ferrules (0.22 NA, 200-μm core, 13-mm length, Doric Lenses) were then implanted into the right CeA (the depth was 0.2 mm more superficial than that for the brain stereotaxic injection), for which the power density at the tip was 15–20 mW as detected by the optical power meter (Q8230, ADVANTEST). Five days later, photostimulation was performed on the rats with fiber optic ferrules in the CeA by connecting the ferrule to a fiber optic cable with a rotary joint (Doric lenses), and then attaching to a fiber-coupled 473-nm blue laser (BL473T8-150FC, Shanghai Laser and Optics Co) with an ADR-800A adjustable power supply by another fiber optic cable. The output laser power from the fiber optic cable was measured by using a photometer (Thor Labs) and set to ∼15 mW/mm2, as the power loss through the ferrule-cable connection was 10–20%. The rats were acclimated for 30 min before receiving stimulation in the advanced brain function laboratory. For von Frey tests, a 15-s stimulation (473 nm at 20 Hz, 15-ms pulse, 15 mW/mm2) with a 10-s break following each stimulation was performed for each animal until the mechanical thresholds were detected. Finally, the rats were perfused, and virus injections were further observed.
Brain tissue preparation
After deep anesthesia with pentobarbital sodium (50 mg/kg, i.p.), the rats were perfused with 150 ml of 0.01 m PBS (pH 7.4) followed by 500 ml of 4% (w/v) paraformaldehyde in 0.1 m PB (pH 7.4) for ∼1.5 h. Subsequently, brains were removed and immersed in 30% (w/v) sucrose solution (4°C) for at least 48 h. The injection sites for tracers were coronally cut into 40 µm sections and sites containing projections were cut into 35-µm-thick sections. Sections were cut on a freezing microtome (CM1950, Leica).
Immunohistochemistry study
In the present study, fluorescent tracer injections were observed directly under an epifluorescence microscope (BX-60; Olympus), and a nickel-diaminobenzidine (DAB)-H2O2 technique was applied to visualize the sites of the BDA injections into the CeA. If the injection sites were successful, brain slices of the projection sites were selected for further study. All the antisera used here are listed in Table 1.
Table 1.
Antisera used for DAB technique and multilabeling immunofluorescence staining
| Group | Primary antisera | Secondary antisera | Tertiary antisera |
|---|---|---|---|
| NeuN/GFAP | Rabbit anti-NeuN (1:200, Cellsignal, catalog #12943S, RRID:AB_2630395) Mouse anti-GFAP (1:200, Millipore, catalog #ab MAB3580, RRID:AB_94936) |
Alexa Fluor 594 donkey anti-rabbit (1:500, Invitrogen, catalog #A21207, RRID:AB_141637) Alexa Fluor 488 donkey anti-mouse (1:500, Invitrogen, catalog #A21202, RRID:AB_141607) |
|
| BDA* | - | - | Avidin-biotinylated peroxidase complex (1:200, Vector, catalog #PK-6101, RRID:AB_2336820) |
| FG/BDA | Rabbit anti-FG (1:500, Millipore, catalog #AB153-I, RRID:AB_2632408) |
Alexa Fluor 488 donkey anti-rabbit (1:500, Invitrogen, catalog #A21206, RRID:AB_2535792) | Alexa Fluor 594 avidin (1:1000, Invitrogen, catalog #A-21135, RRID:AB_2535774) |
| FG/FOS | Rabbit anti-FG (1:500, Millipore, catalog #AB153-I, RRID:AB_2632408) Mouse anti-FOS (1:500, Abcam, catalog #ab208942, RRID:AB_2747772) |
Alexa Fluor 488 donkey anti-mouse (1:500, Invitrogen, catalog #A21202, RRID:AB_141607) Alexa Fluor 594 donkey anti-rabbit (1:500, Invitrogen, catalog #A21207, RRID:AB_141637) |
- |
| FG/ BDA/ FOS |
Rabbit anti-FG (1:500, Millipore, catalog #AB153-I, RRID:AB_2632408) Mouse anti-FOS (1:500, Abcam, catalog #ab208942, RRID:AB_2747772) |
Alexa Fluor 594 donkey anti-mouse (1:500, Invitrogen, catalog #A21203, RRID:AB_2535789) Alexa Fluor 647 donkey anti-rabbit (1:500, Invitrogen, catalog #A31571, catalog #RRID:AB_162542) |
FITC-avidin (1:1000, Vector, catalog #A-2001, RRID:AB_2336455) |
*Nickel-DAB-H2O2 reaction.
Nickel-DAB-H2O2 techniques were only used for the BDA injection and projection sites in our experiment. The primary and secondary antisera involved were omitted for BDA staining because it was biotinylated. Brain slices were incubated with an avidin-biotinylated peroxidase complex for 2–4 h at RT. Subsequently, the slices were allowed to react for 15–30 min in 20% (w/v) DAB reagent by adding 0.3% (v/v) H2O2. The 20% (w/v) DAB reagent for four to five brain sections was prepared by dissolving 1 mg of DAB (48596LMV, Sigma) in 5 ml of 0.05 m. Tris-HCl (pH 7.6) with 10% (v/v) nickel ammonium sulfate.
Immunofluorescent histochemical methods were used to evaluate the double-labeling of NeuN/GFAP and FG/FOS in the pPVT and FG/BDA in the CeA and the triple-labeling of FG/BDA/FOS in the CeA. Briefly, the sections were incubated with primary antisera for 18–24 h at 4°C in 0.01 m PBS containing 1% (v/v) normal donkey serum, 0.3% (v/v) Triton X-100, 0.02% (w/v) sodium azide, and 0.12% (w/v) carrageenan (pH 7.4). Then, the sections were incubated with secondary antisera (fluorescein-labeled IgG) for 6–8 h at 4°C. If necessary, the sections were incubated with tertiary antisera for 2–4 h in 0.01 m PBS with 0.3% (v/v) Triton X-100 at 4°C.
In the negative control experiments, the primary antisera were omitted, and the other steps were the same as those for the experimental groups.
Electron microscopy observation
An electron microscopic analysis of pre-embedding immunoperoxidase labeling (Lu et al., 2015) was used to reveal the synaptic connections between BDA-immunopositive terminals and neurons retrogradely labeled with FG in the CeA. One week after the tracer injections, the rats were deeply anesthetized and transcardially perfused with 150 ml of 0.01 m PBS and then 500 ml of 0.1 m PB containing 4% (w/v) paraformaldehyde, 0.1% (v/v) glutaraldehyde, and 15% (w/v) saturated picric acid for ∼0.5 h. Subsequently, brains were removed immediately, postfixed for 2–4 h, and cut into 50-µm coronal sections by a vibratome (Microslicer DTM-1000; Dosaka EM). The injection sites were checked under an epifluorescence microscope. Only animals that received successful injections into both the pPVT and vlPAG were used for additional experiments.
The sections were placed into 0.1 m PB containing 25% (w/v) sucrose and 10% (v/v) glycerol for 30 min and freeze-thawed with liquid nitrogen for 2–3 s. The sections were then blocked in 20% (v/v) normal donkey serum for 40 min at RT. For double immunolabeling of FG/BDA, the sections were incubated with rabbit anti-FG IgG for 24 h at a concentration of 1:200 (Millipore catalog #AB153-I, RRID:AB_2632408) at 4°C, then further incubated overnight at RT with goat anti-rabbit IgG antibody conjugated to 1.4-nm gold particles at a concentration of 1:200 (Nanoprobes catalog #2003, RRID:AB_2687591). The antisera were diluted in 0.05 m. Tris-buffered saline (TBS; pH 7.4) containing 2% (v/v) normal donkey serum. Subsequently, the sections were processed for silver enhancement with an HQ Silver kit (Nanoprobes) and then incubated with an ABC reagent (Vector) diluted to a concentration of 1:100 in 50 m TBS for 3–4 h at RT for a DAB reaction.
Next, the sections underwent osmification with 1% OsO4 in 0.1 m PB for 25 min, counterstaining with 1% uranyl acetate, and dehydration before being embedded flat in Durcupan resin (Fluka) and mounted on silane-coated glass slides. After polymerization for 48 h at 60°C, small pieces containing the CeA were cut into 70-nm-thick sections on an ultramicrotome (Reichert-Nissei Ultracut S, Leica). The ultrathin sections were then imaged.
Anatomical tracing by recombinant rabies virus (RV)-based and cell-type-specific retrograde transsynaptic tracing techniques
To identify the specific neurons within the vlPAG targeted by the pPVT-CeA pathway, we used a technique combining a Cre-dependent, cell-type-specific anterograde-tracing virus with the recombinant RV-based retrograde transsynaptic tracing (Wickersham et al., 2007; Callaway and Luo, 2015) in VGLUT2-ires-Cre mice. Here, the elongation factor 1-α (Ef1a) promotor, a wide expression promoter, was used. To ensure the viruses were expressed in Cre mice, the double-floxed inverse orientation (DIO) was needed in conjunction with the Cre recombinase. For anterograde tracing, the AAV2/9-Ef1a-DIO-EYFP virus was injected into the right pPVT. For retrograde transsynaptic tracing, the recombinant RV system was injected into the right side of the vlPAG in sequence. The RV, whose glycoprotein (G) gene is deleted from the genome (RVΔG), cannot spread across synapses. G complementation enables the transsynaptic spread of RVΔG to presynaptic neurons. The virus particles formed by the RV were packed with the fusion protein of the envelope protein (EnvA) of the recombinant avian sarcoma virus, which can specifically recognize the EnvA receptor TVA to specifically infect cells. With the aid of helper viruses (AAV-Ef1a-DIO-EGFP-TVA and AAV-Ef1a-DIO-RVG), RV-EnvA-ΔG can be used to perform cell-type-specific retrograde transsynaptic tracing in specific types of neurons. The viruses involved and the specific steps were introduced as follows. On day 1, 0.2 µl of AAV2/9-Ef1a-DIO-EYFP (PT-0023, 7.29 × 10¹² genome copies/ml, BrainVTA) was stereotaxically injected into the right pPVT (1.58 mm posterior to the bregma, 0.05 mm lateral to the midline, and 3.05 mm ventral into the skull surface) and the helper virus mixture (1:1) of AAV2/9-Ef1a-DIO- EGFP-TVA (PT-0021, 7.32 × 10¹² genome copies/ml, BrainVTA) and AAV2/9-Ef1a-DIO-RVG (PT-0023, 7.29 × 10¹² genome copies/ml, BrainVTA) was stereotaxically injected into the right vlPAG (4.60 mm posterior to the bregma, 0.05 mm lateral to the midline, and 2.90 mm ventral to the skull surface) of VGLUT2-ires-Cre mice, which allowed EGFP-TVA and RVG to be selectively expressed in VGLUT2-containing neurons. On day 21, 0.2 µl of RV-EnvA-ΔG-dsRed [R01002, 2.20 × 10⁸ infectious units (IFU)/ml, BrainVTA] was injected into the vlPAG at the same injection site in a biosafety-level-2 environment. The mice were allowed to survive for 7 d and then were transcardially perfused with 4% paraformaldehyde in PB; their brains were extracted for observation by confocal laser scanning microscopy.
Image acquisition
The immunohistochemical images were captured under a light microscope (AH-3, Olympus) and saved as TIFF files. The ultrathin sections for pre-embedding immunoperoxidase labeling were examined with a JEM-1230 electron microscope (JEOL) and the digital micrographs were captured with a Gatan 832 CCD camera (Gatan). The digital images were manipulated and modified (5–10% contrast enhancement) in Photoshop CS2 and then saved as TIFF files. Single-labeled immunofluorescent images were obtained with an epifluorescence microscope (BX-60, Olympus). The double-labeled and triple-labeled immunofluorescent slices involved in the immunofluorescence histochemical staining, electrophysiology, in situ hybridization, and anatomic tracing by the recombinant RV-based and cell-type-specific retrograde transsynaptic tracing techniques were taken using a confocal laser scanning microscope (CLSM; FV1000, Olympus). Digital images were captured by FLUOVIEW software (FV10-ASW 1.7, Olympus), and saved in an OIB format (image format in FLUOVIEW software), and ultimately converted into TIFF files.
Statistical analysis
Two-way repeated measures ANOVA with a post hoc analysis of the Bonferroni method was used to determine statistical significance in behavioral experiment outcomes including chemical lesions, chemogenetic manipulation results and optogenetic findings. The quantitative analysis of the NeuN-labeled neurons, TMR-labeled and TMR/VGLUT2 mRNA double-labeled neurons and FG-positive and FG/FOS-positive neurons in the pPVT were estimated by stereological methods (Coggeshall, 1992). The analysis was performed as described previously (Polgár et al., 2004) by using a modification of the optical dissector method with the aid of Stereo Investigator software (MicroBright-Field). A χ2 test was used to test the significant difference in the percentage of FG retrogradely labeled neurons that expressed FOS between sham and SNI animals. The electrophysiological data were expressed as means ± SDs and n refers to the number of recorded neurons. The cumulative probabilities of the inter-event intervals and the amplitudes of the sEPSCs were compared using the Kolmogorov–Smirnov test. An independent two-sample t test was used to analyze the differences between two groups (for example, the difference in the rheobase current between the SNI and the sham groups); p < 0.05 was considered significant. All statistical analyses were performed with GraphPad Prism 7.04 software.
Results
Lesioning or the inhibition of pPVT neurons attenuated SNI-induced mechanical allodynia
To examine the role of pPVT neurons in central nociceptive processing and modulation, we injected KA into the pPVT to lesion local neurons in the rats. One sample of the rostro-caudal extent of the lesion sites and its representative pictures from the same rat are shown in Figure 1A,B. The NeuN-labeled neurons (red) were counted to display the lesion effect (Fig. 1B–G). The corresponding quantitative analysis demonstrated that the number of NeuN-labeled neurons in the SNI + KA group was significantly less than that in the SNI + saline group (t(10) = 17.03, p < 0.001, t test; Fig. 1H). Astrocyte proliferation was also observed after KA lesions (Fig. 1F1,F2). In the current study, the rats with SNI surgery showed long-lasting mechanical allodynia starting on postoperative day (POD) four and peaking on POD10 (F(6,35) = 5.123, p = 0.0007, two-way ANOVA with Bonferroni correction; Fig. 1I). Lesioning pPVT neurons resulted in a small but significant reduction in SNI-induced behavioral hypersensitivity from POD 7 to POD 10 (F(6,35) = 2.576, p = 0.0358, two-way ANOVA with Bonferroni correction; Fig. 1I) although the PWTs in the SNI+KA group were still significantly lower than those of sham rats (F(6,35) = 3.673, p = 0.0062, two-way ANOVA with Bonferroni correction; Fig. 1I).
Figure 1.
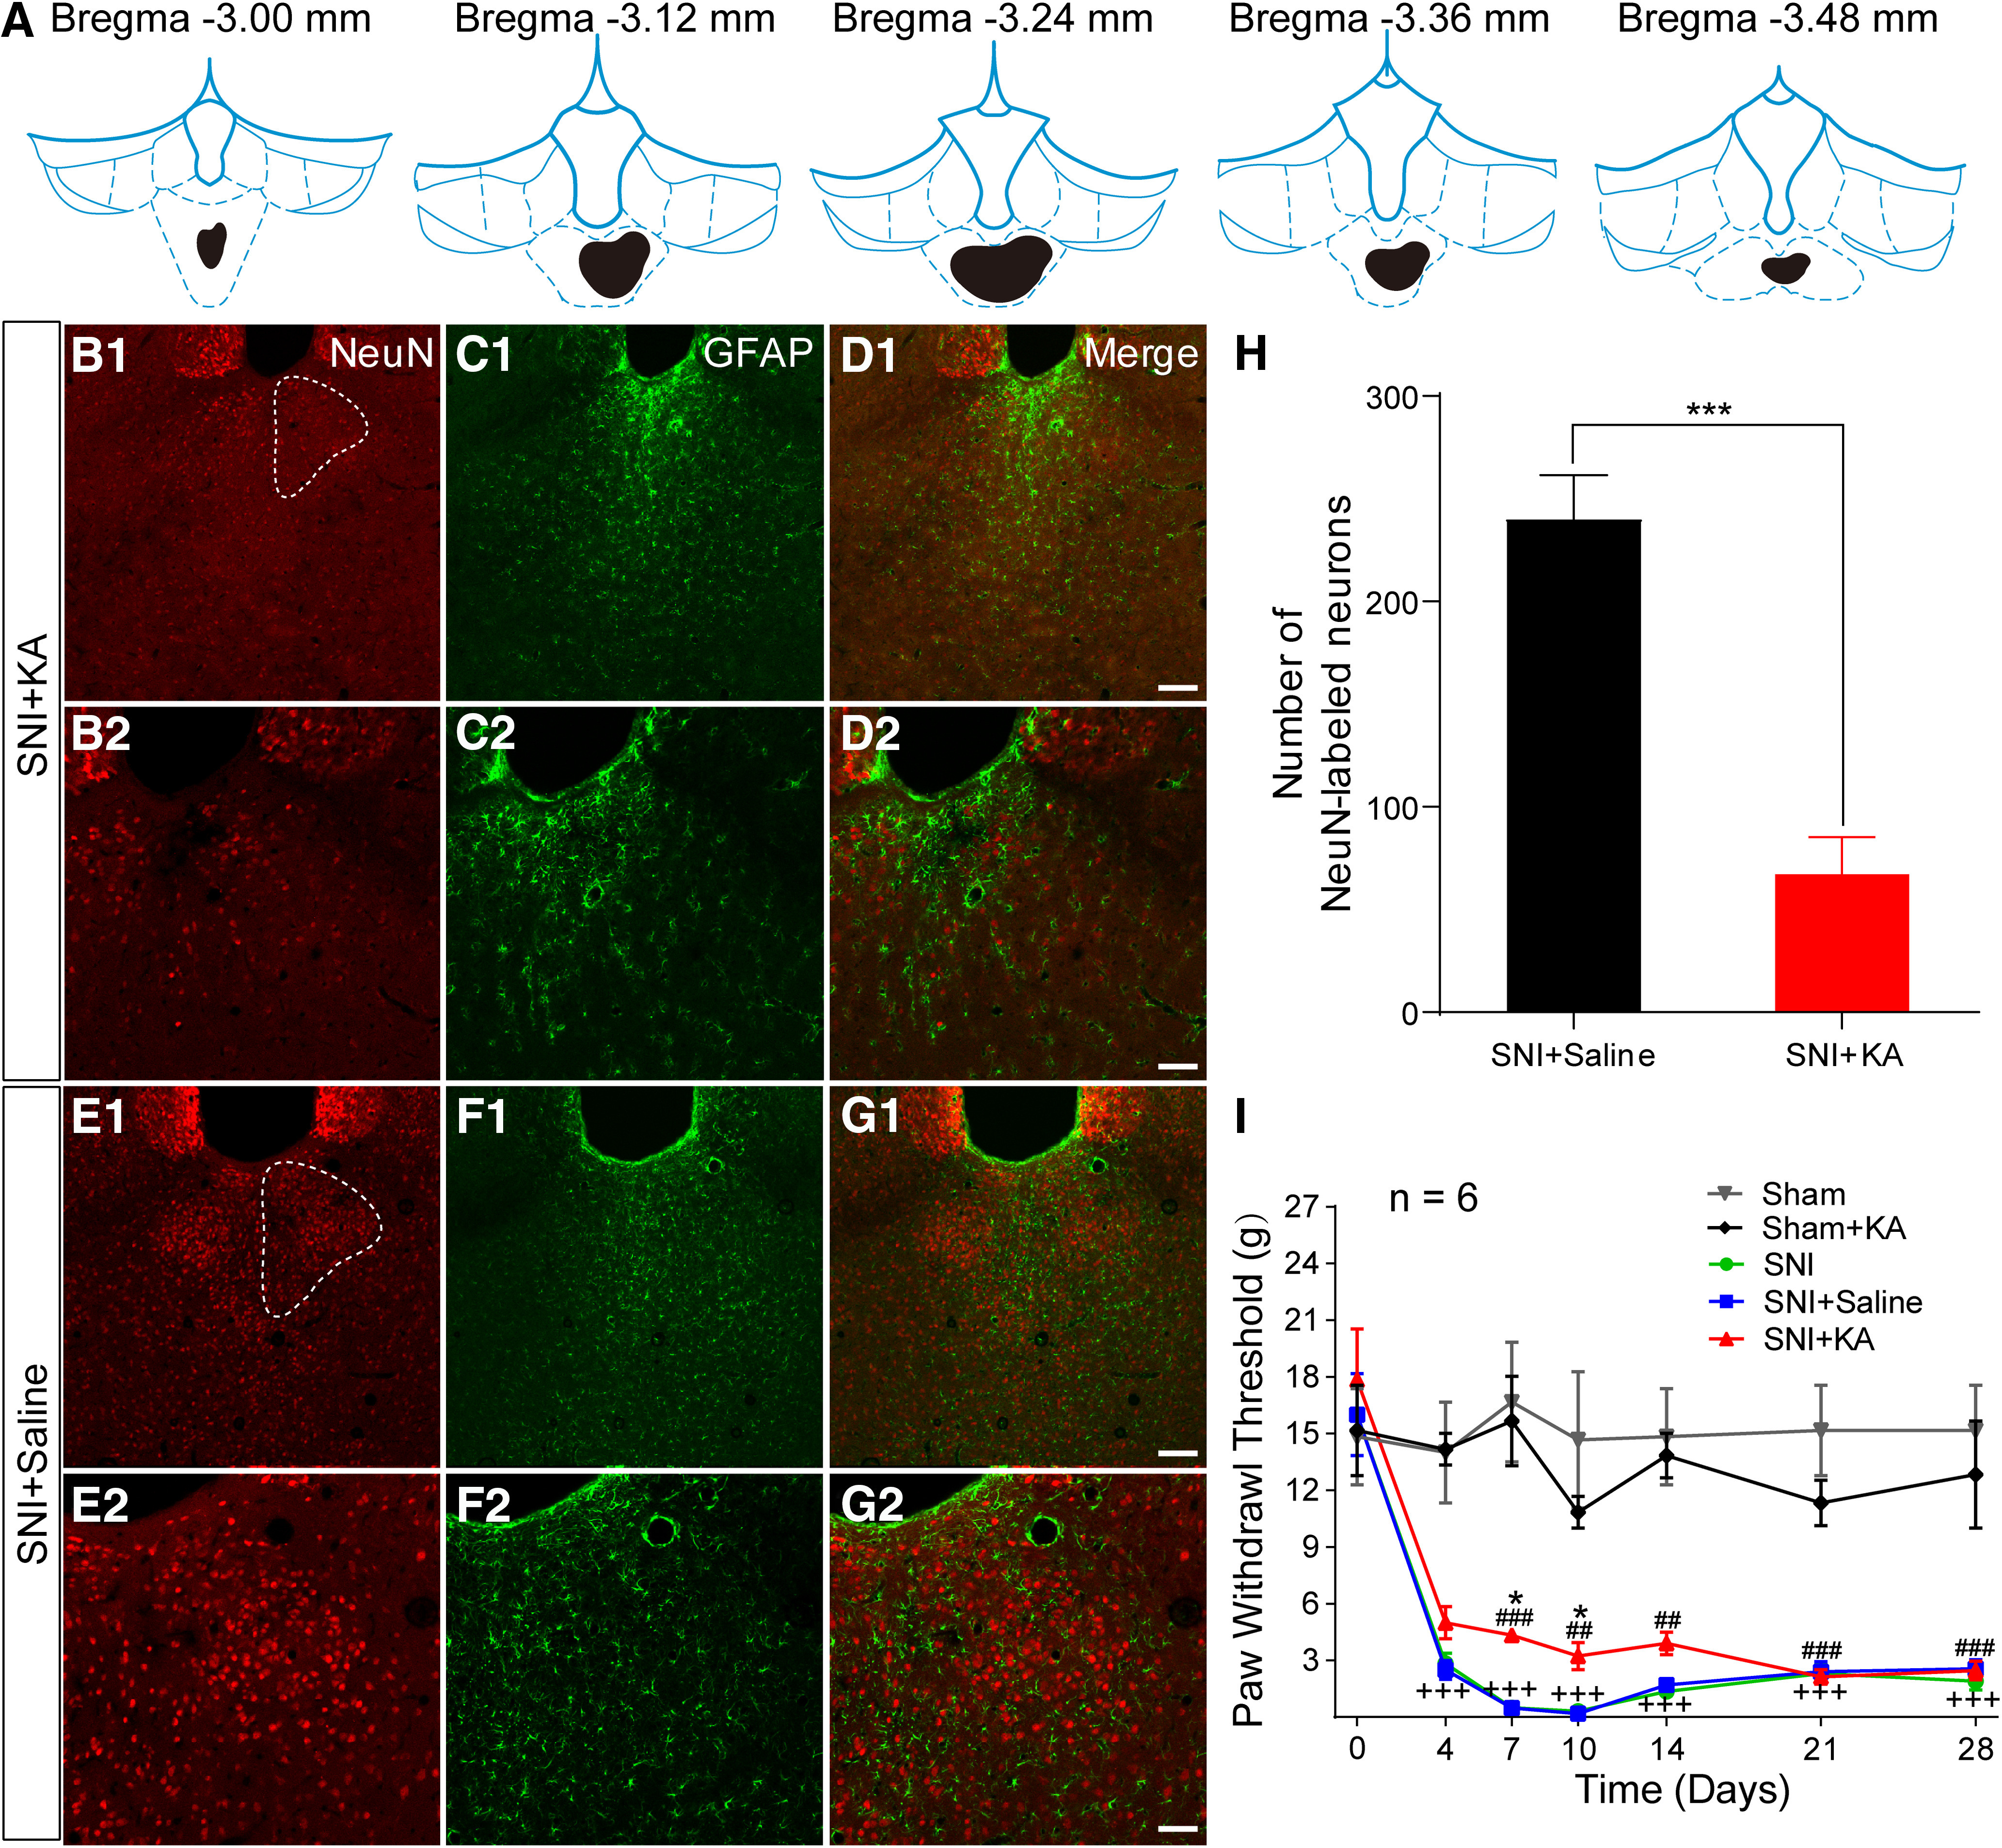
Lesion of the pPVT by KA injection modulates neuropathic pain. A, The drawing showing the rostro-caudal extent of KA injection (black). B1, B2, The NeuN-labeled neurons in SNI + KA in the pPVT (white dotted outline in B1). B–D, Representative images from the same rat as A. C1, C2, The GFAP-labeled astrocytes in SNI + KA in the pPVT. D1, D2, The merged pictures of B, C. E1, E2, The NeuN-labeled neurons in SNI + saline in the pPVT (white dotted outline in E1). F1, F1, The GFAP-labeled astrocytes in SNI + saline in the pPVT. G1, G1, The merged pictures of E, F. Scale bars = 100 µm (D1, G1; applied in B1, C1, E1, F1) and 50 µm (D2, G2; applied in B2, C2, E2, F2). H, Quantitative analysis of the number of NeuN-labeled neurons in the pPVT; *p < 0.001, SNI + KA versus SNI + saline. I, The PWTs in rats by von Frey tests from the post-SNI operation days 4–28 (n = 6 in each group); +++p < 0.001, SNI versus sham; *p < 0.05, SNI + KA versus SNI + saline; ##p < 0.01, ###p < 0.001, SNI + KA versus sham.
Next, we used DREADDs to test whether selective inhibition of pPVT neurons in the rats inhibited SNI-induced behavioral responses (Fig. 2A). The AAV-hM4Di injection sites in the pPVT were shown in Figure 2B,C. Notably, the administration of CNO on day 10 after the SNI completely blocked mechanical allodynia (hM4Di-CNO vs hM4Di-saline by post-saline/CNO: F(1,10) = 58.54, p < 0.001; post-saline/CNO vs pre-saline/CNO in the hM4Di-CNO group: F(1,10) = 43.11, p < 0.001; hM4Di-CNO vs mCherry-CNO by post-CNO: F(1,10) = 42.27, p < 0.001; SNI-post CNO vs baseline-post-CNO in the hM4Di-CNO: F(1,10) = 2.704, p = 0.0662, two-way ANOVA with Bonferroni correction; Fig. 2D), further supporting that active pPVT neurons mediate the development of neuropathic pain.
Figure 2.
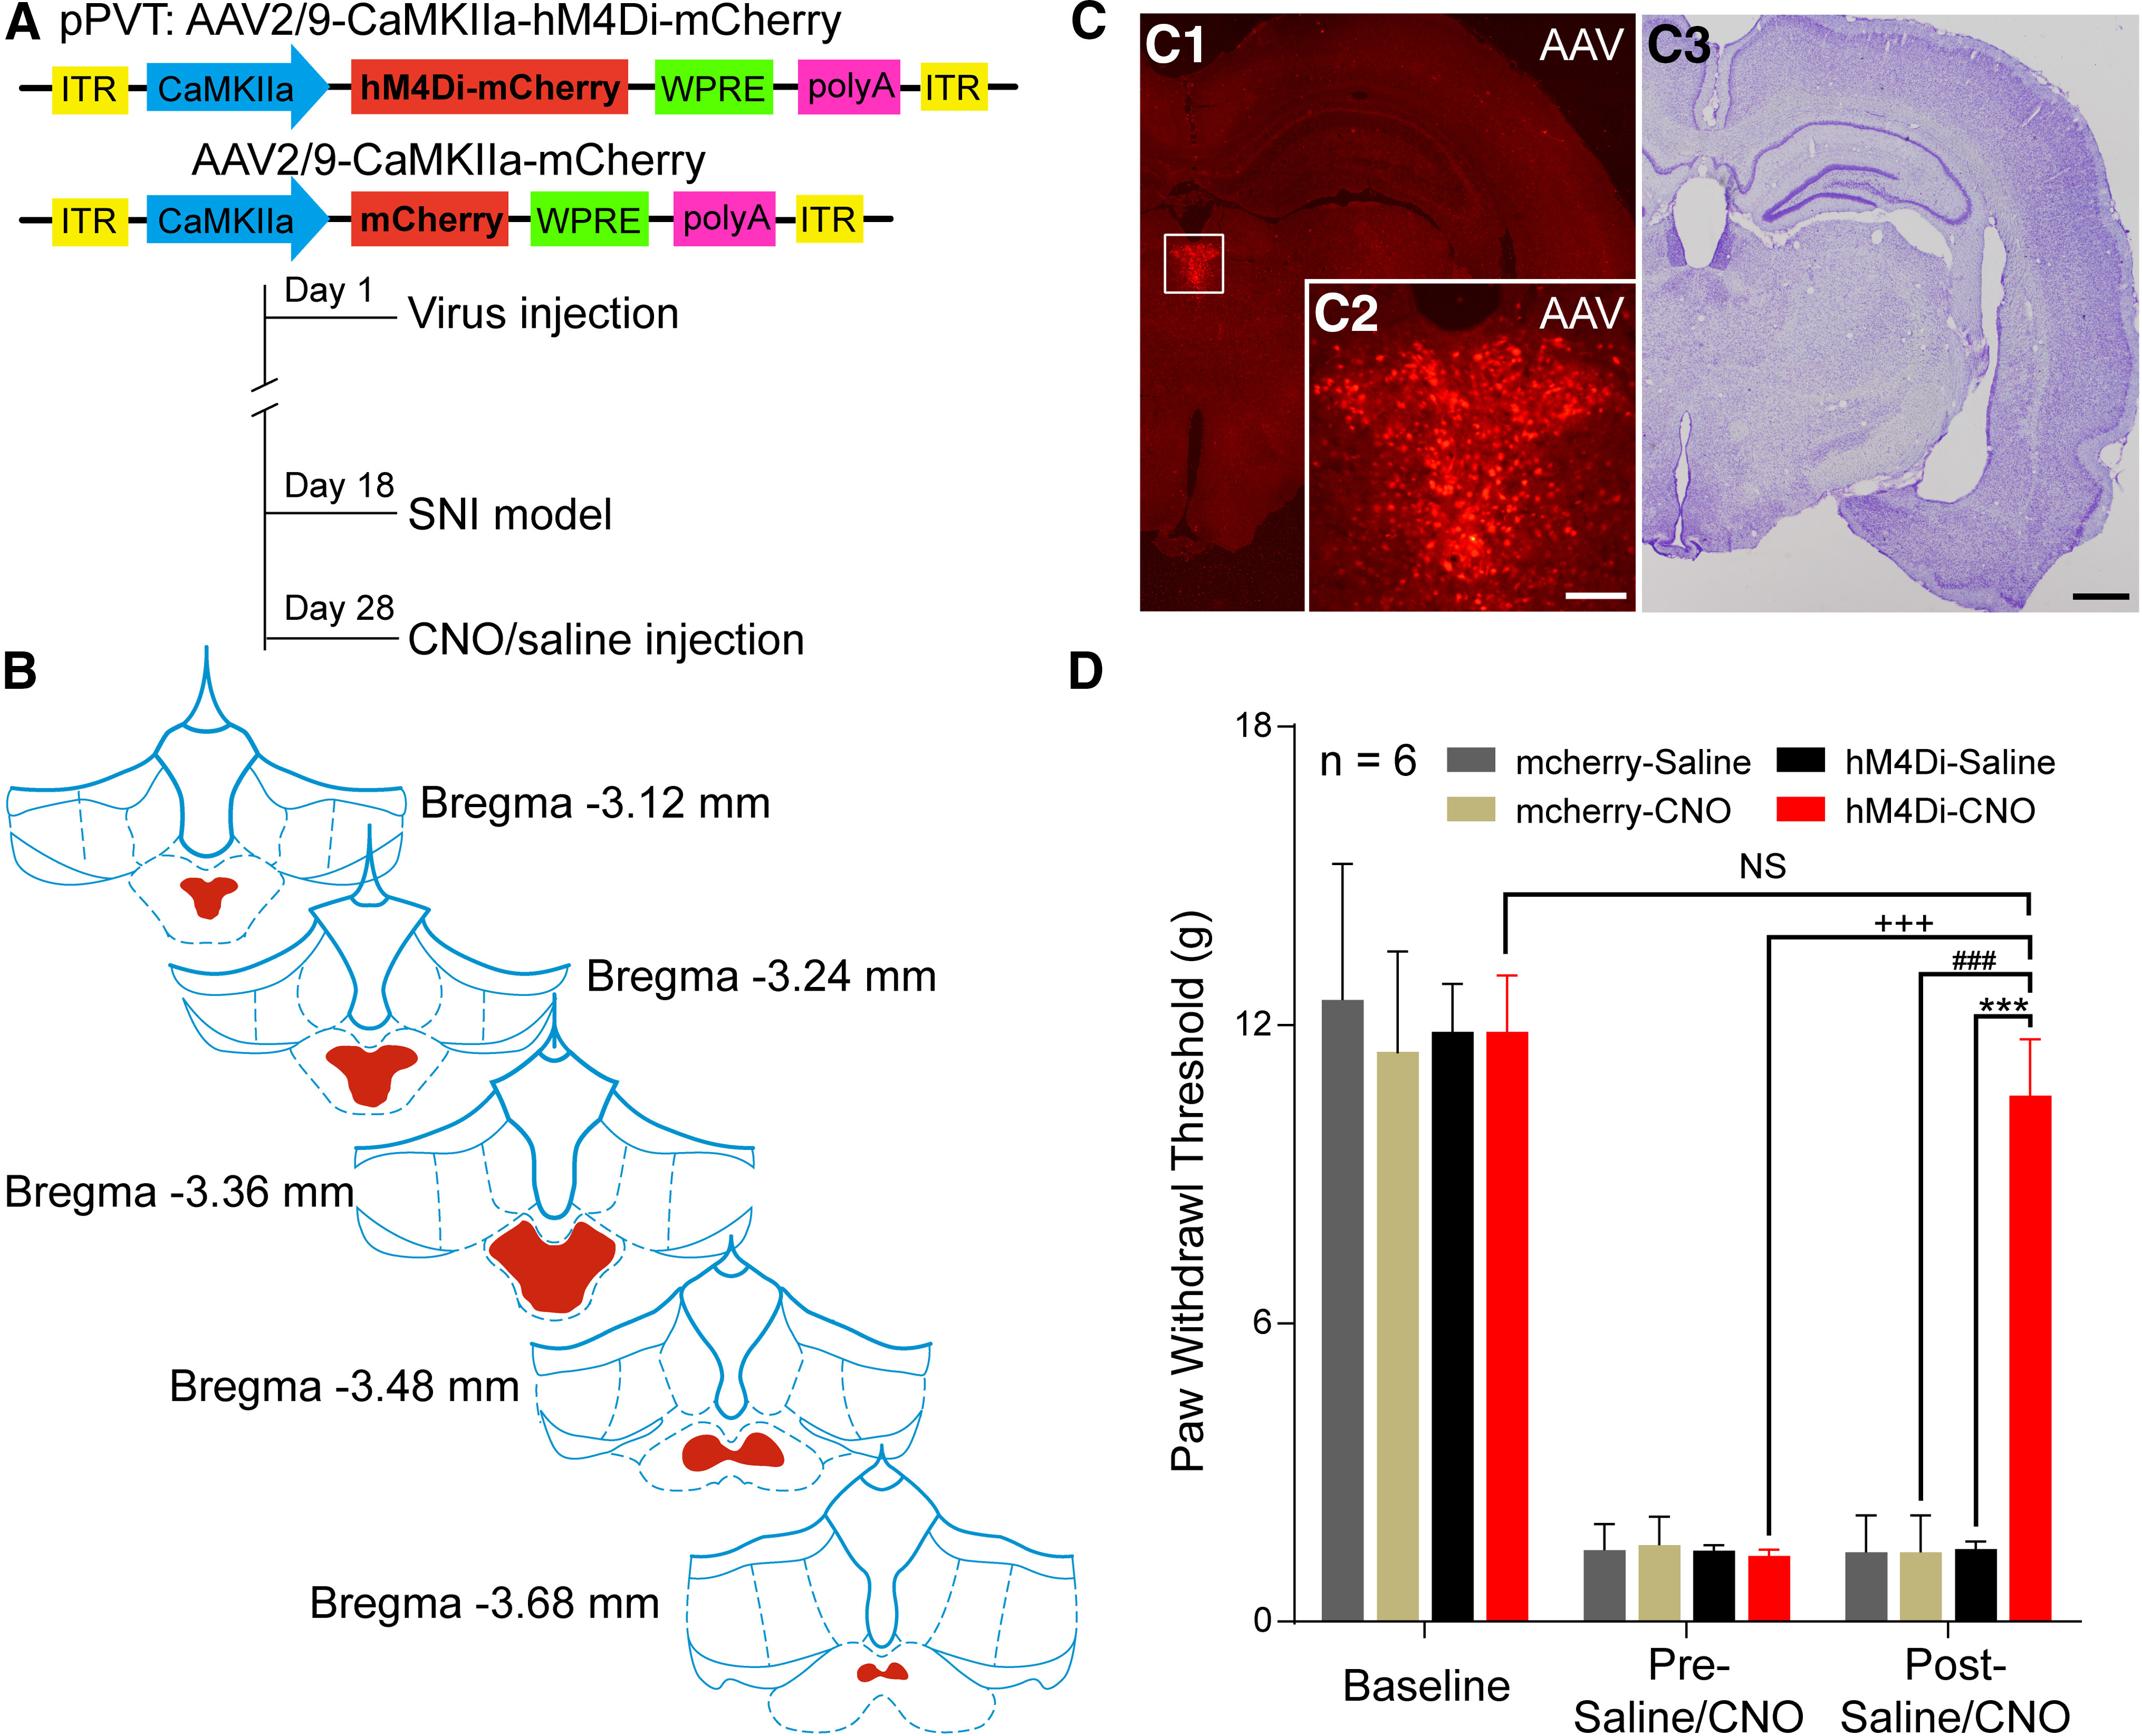
Inhibition of the pPVT by chemocogenetics modulates neuropathic pain. A, The constructs as well as the sequences of the adeno-associated viruses (AAV2/9-CaMKIIa-hM4Di-mCherry and AAV2/9-CaMKIIa-mCherry) and the experimental procedures. B, Expression of hM4Di-mCherry (red) throughout the pPVT in consecutive coronal brain section. C, Representative injection sites at the largest extent in C1 (high magnification in C2, from the same rat as B) and Nissl's staining in C3. Scale bars = 200 µm (C3; applied in C1) and 100 µm (C2). D, CNO administration results in a significant increase in PWTs in SNI rats following microinjection of AAV2/9-CaMKIIa-hM4Di-mCherry (n = 6 in each group); ***p < 0.001, hM4Di-CNO versus hM4Di-saline; +++p < 0.001, post-CNO versus pre-CNO in hM4Di-CNO group; ###p < 0.001, hM4Di-CNO versus mcherry-CNO; NS, non-significant; p > 0.05, post-CNO of SNI versus baseline in hM4Di-CNO group.
The pPVT-CeA projection neurons in the pPVT express VGLUT2 mRNA
Previous reports show that the CeA has emerged as an important brain center for pain modulation and has dense fibrous connections with the PVT. To explore the downstream circuit-mediated pPVT-involved descending nociceptive facilitation pathway, after FG was microinjected into the right CeA of the rats (Fig. 3A,B1,B2), neurons retrogradely labeled with FG were observed in the ipsilateral PVT, especially in the pPVT (Fig. 3C1,C2), providing morphologic evidence of the pPVT-CeA neuronal circuit in the rats.
Figure 3.
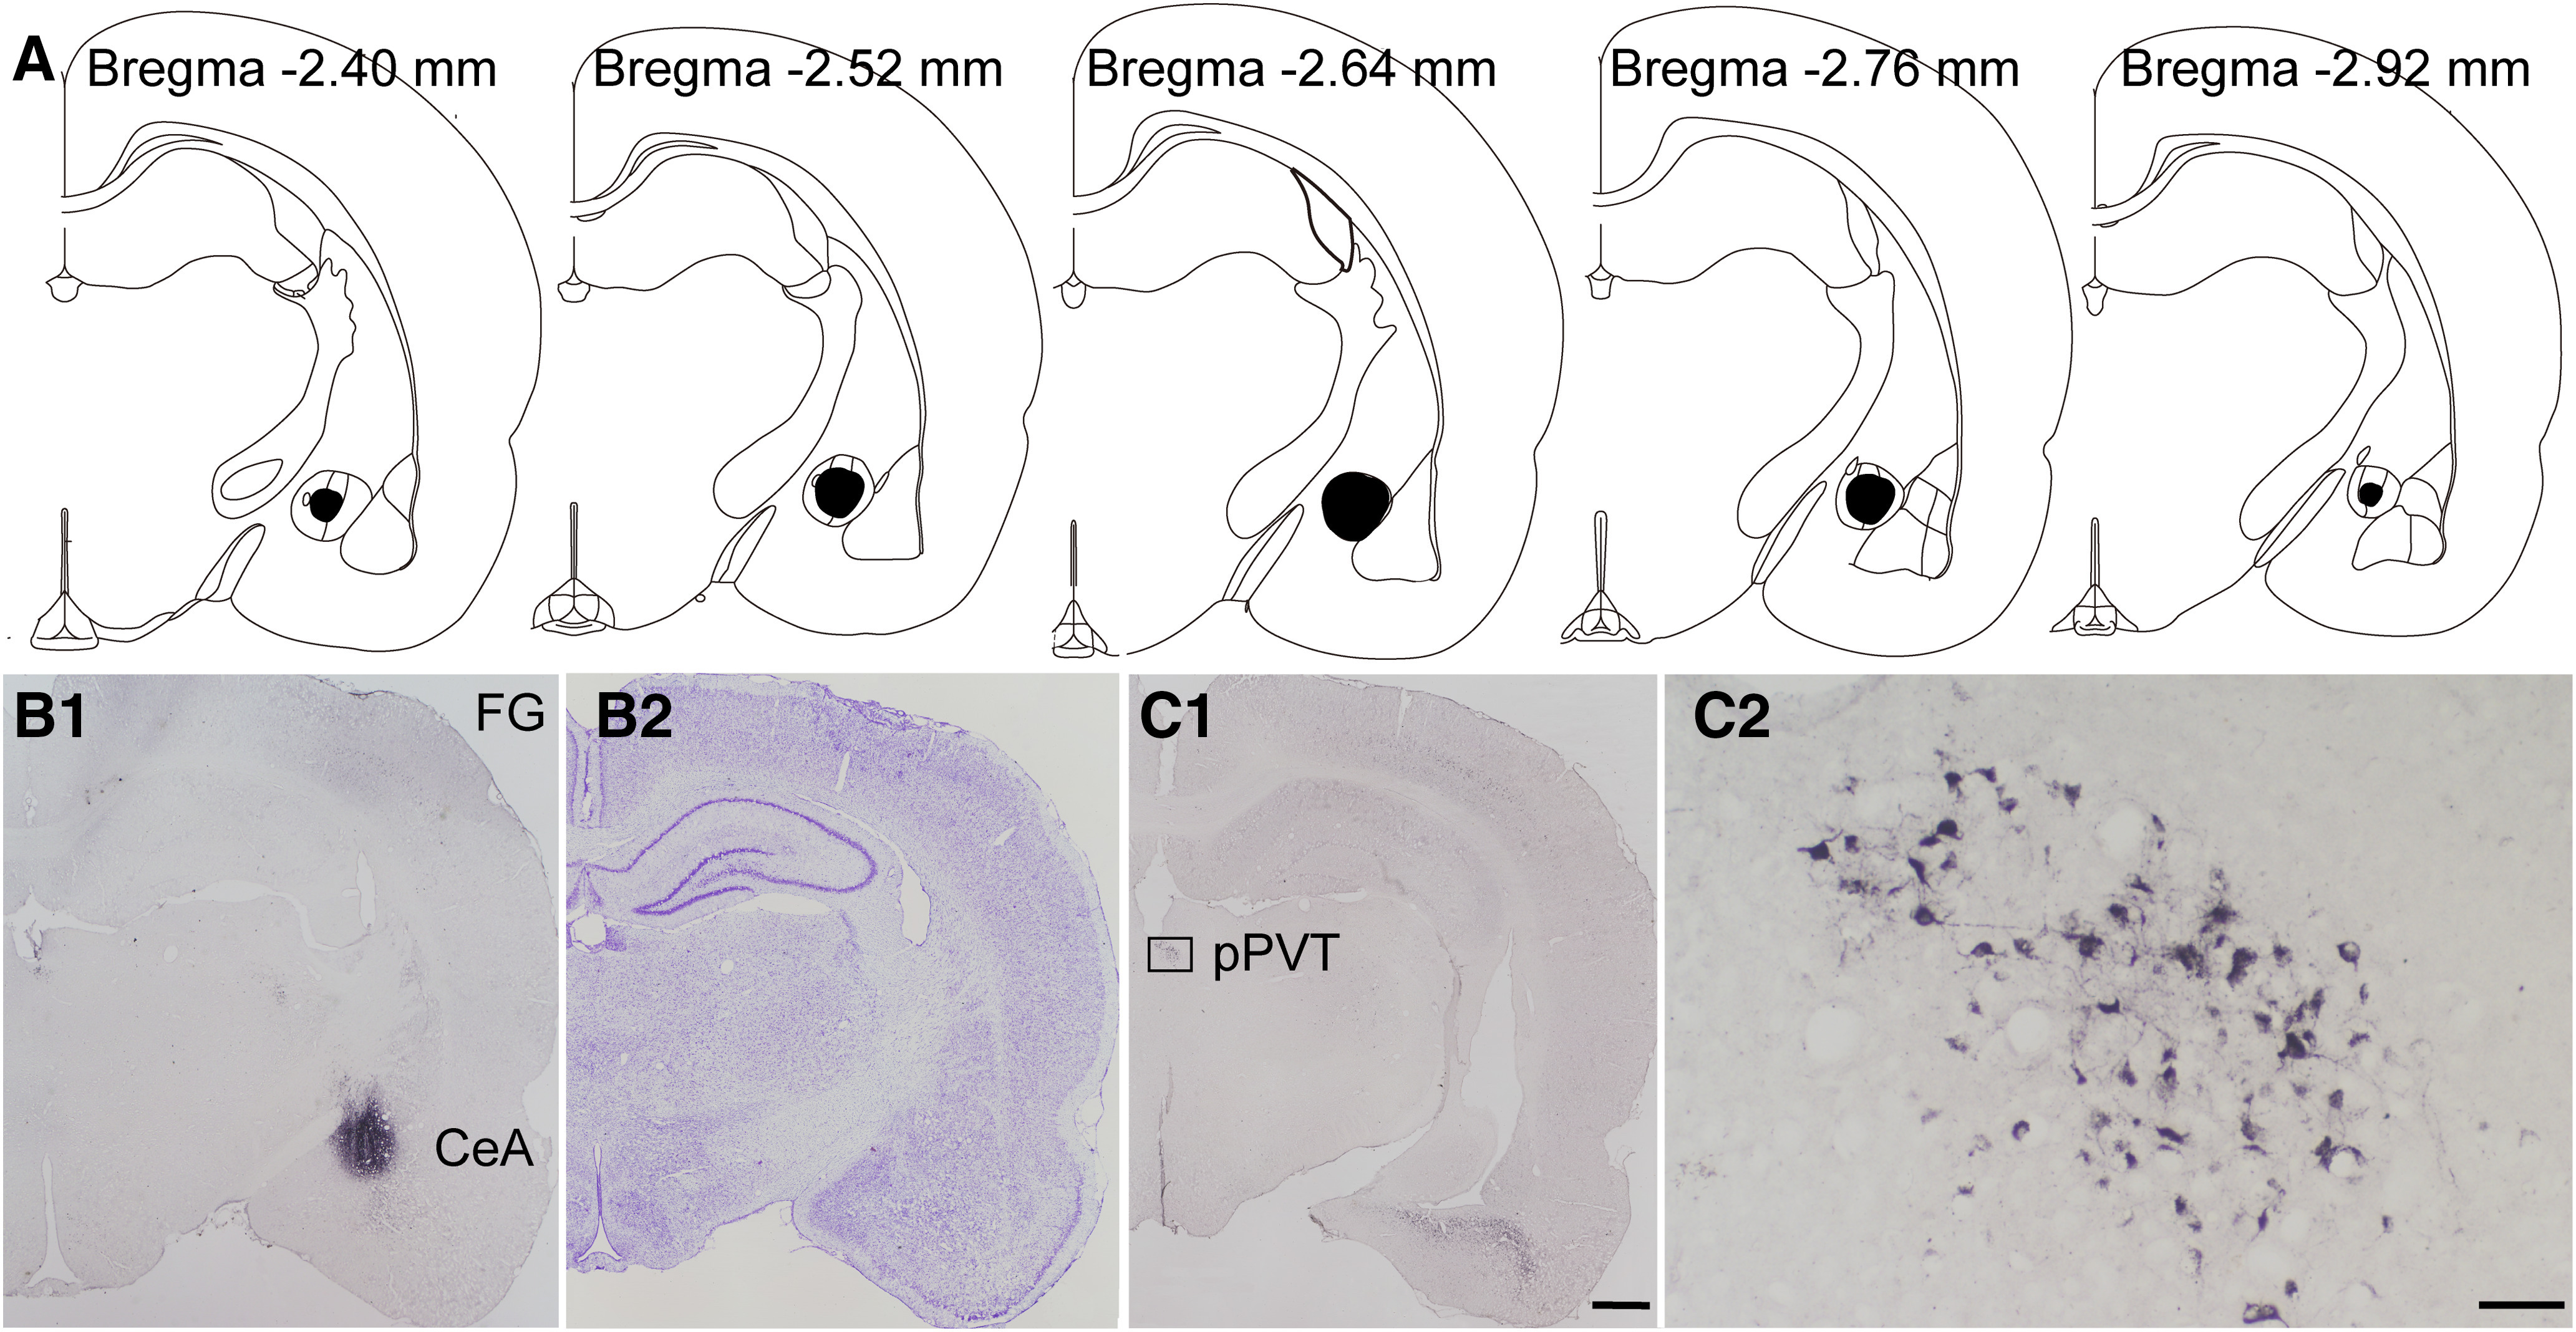
The FG retrogradely labeled neurons from CeA to pPVT in the rats. A, The rostro-caudal extent of FG injection sites in the CeA (black) in consecutive coronal brain section. B1, B2, Representative injection at the largest extent in the CeA and Nissl's staining of the adjacent section. C1, C2, The FG-labeled neurons in the pPVT in C1 and enlarged in C2. Scale bars = 200 µm (C1; applied in B1, B2) and 50 µm (C2). A–C are coming from the same rat.
Additionally, we used FISH to identify whether CeA-projecting pPVT neurons were glutamatergic. As shown in Figure 4A1–A4, we found that many neurons in the pPVT were positive for VGLUT2 mRNA but not for VGLUT1 mRNA. Subsequently, visualizing the TMR injected into the CeA (Fig. 4B1–B3), we determined that ∼98% of the TMR-labeled CeA-projecting neurons (red) in the pPVT expressed VGLUT2 mRNA (green; Fig. 4C–F). No VGLUT2 mRNA-expressing cells were observed when the sections were treated with labeled sense probes (Fig. 4G–I).
Figure 4.

Fluorescent photomicrographs demonstrate the distributions of the VGLUT1 and VGLUT2 mRNA-containing neurons and TMR/VGLUT2 mRNA double labeled neurons in the pPVT after TMR was injected into the CeA. A1, A2, The distribution of VGLUT1 mRNA in the pPVT. A3, A4, The distribution of VGLUT2 mRNA in the pPVT. The white rectangular areas in A1, A3 are enlarged and displayed in A2, A4, respectively. Scale bars = 200 µm (A3; applied in A1) and 100 µm (A4; applied in A2). 3v: the third ventricle; MHb: medial habenular nucleus. B1, The rostro-caudal extent of TMR injection sites in the CeA (red) in consecutive coronal brain section. B2, B3, Representative TMR injection site in the CeA and Nissl's staining of the adjacent section. Scale bar = 200 µm (F2; applied in F1). C1, C2, The TMR-labeled neurons (red) in the pPVT. D1, D2, The VGLUT2 mRNA positive neurons (green) in the pPVT. E1, E2, The TMR/VGLUT2 mRNA double-labeled neurons (inset, white arrows, enlarged by the white dotted square area in E2). C2–E2, Enlarged by the area in the white frame in E1. Scale bars = 50 µm (E1; applied in C1, D1), 20 µm (E2; applied in C2, D2), and 10 µm (E2, inset). B–E are coming from the same rat F, the percentage of TMR-labeled neurons that expressed VGLUT2 mRNA. G–I, The negative control of TMR/VGLUT2 mRNA double-labeled neurons in the pPVT. No TMR/VGLUT2 mRNA double-labeled neurons are observed when the labeled sense probes instead of antisense probes was used. Scale bar = 100 µm (I; applied in G, H).
SNI increased the excitability of pPVT-CeA projection neurons
We used FOS staining to examine neuronal responses to the nerve injury in the pPVT in the rats (Fig. 5A–F) and found that nearly 92.1% of the FG-labeled CeA-projecting pPVT neurons (red) expressed FOS protein (green) in the SNI group and 28.6% expressed FOS protein in the sham group (Fig. 5G). There was a significant difference between sham and SNI groups in the percentage of FG retrogradely labeled neurons that express FOS (χ2 = 31.104, p < 0.001, χ2 test; Fig. 5G), indicating the more activation of the pPVT-CeA neuronal pathway after SNI model.
Figure 5.
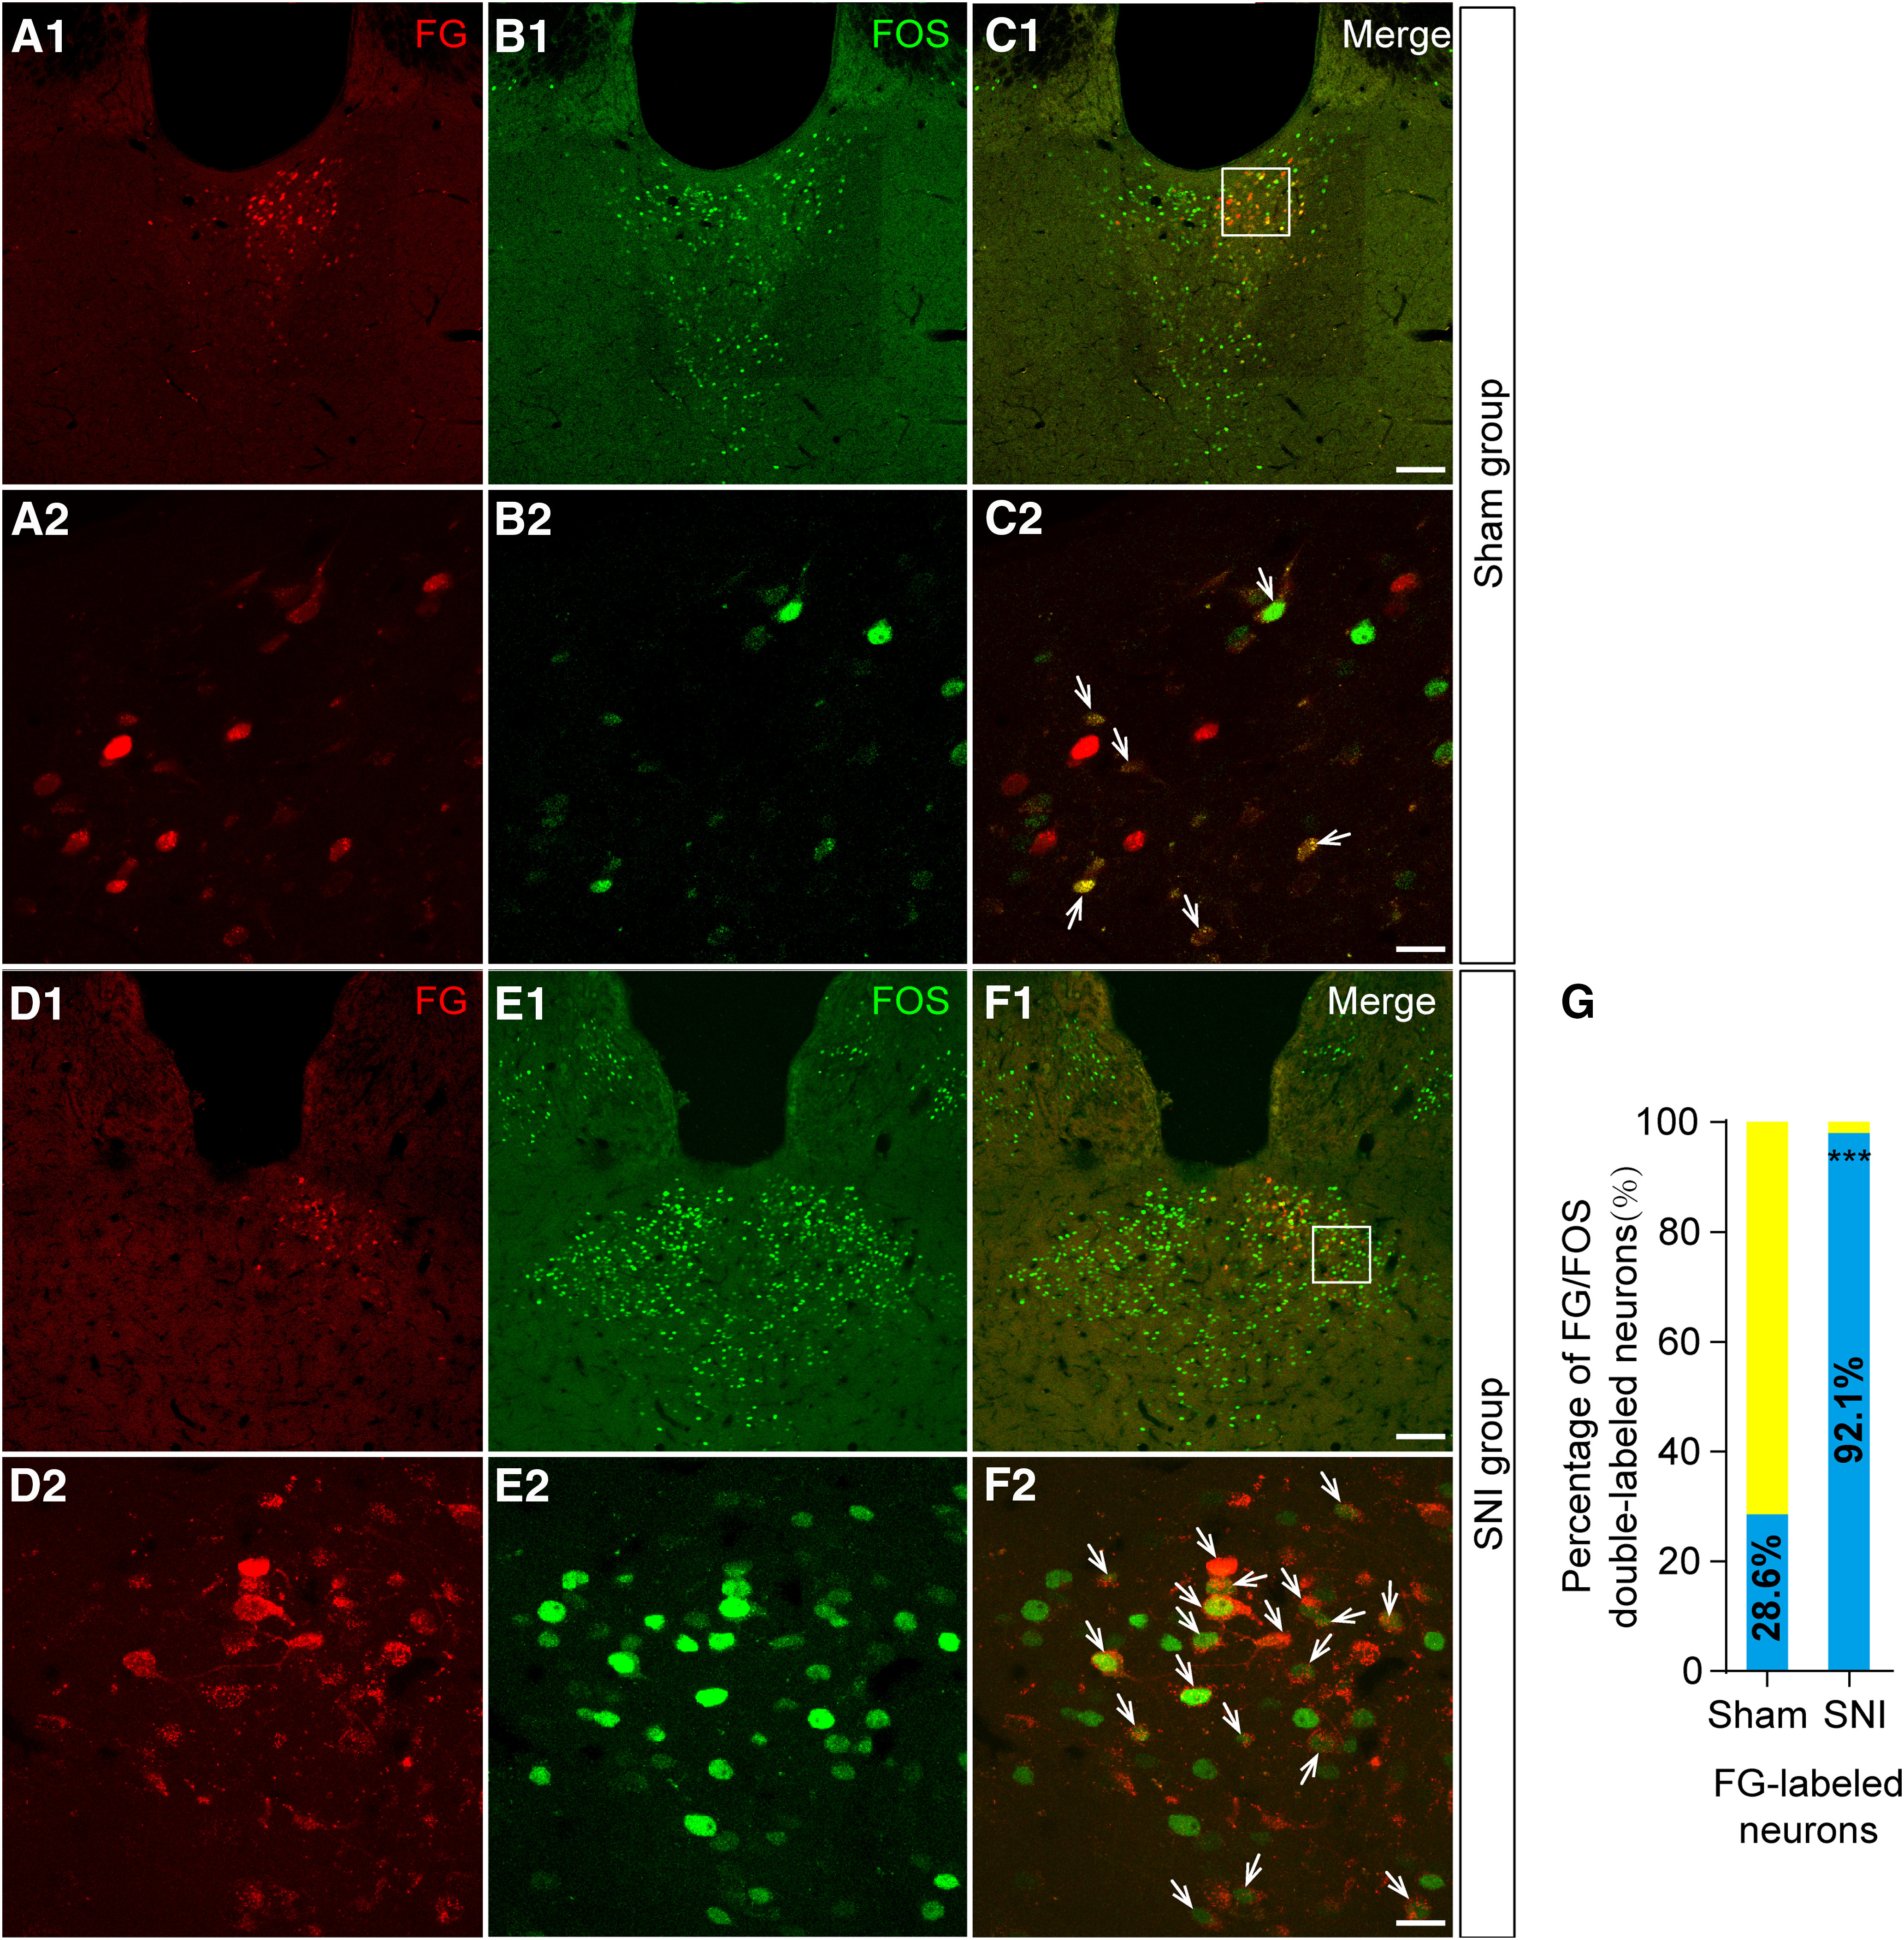
Fluorescent photomicrographs demonstrate the distributions of the FG/FOS-labeled neurons in the pPVT after FG was injected into the CeA. A1, A2, The FG-labeled neurons (red) in the pPVT in sham group. B1, B2, The FOS-labeled neurons (green) in the pPVT in sham group. C1, C2, The FG/FOS double-labeled neurons (white arrows in C2) in the pPVT. The white square area in C1 is enlarged and displayed in A2–C2. D1, D2, The FG-labeled neurons (red) in the pPVT in SNI group. E1, E2, The FOS-labeled neurons (green) in the pPVT in SNI group. F1, F2, The FG/FOS double-labeled neurons (white arrows in F2) in the pPVT. The white square area in F1 is enlarged and displayed in D2–F2. Scale bars = 100 µm (C1, F1; applied in A1, B1, D1, E1) and 20 µm (C2, F2; applied in A2, B2, D2, E2). G, The percentage of FG/FOS double-labeled neurons in the pPVT in sham and SNI groups. There is a significant difference (between sham and SNI animals) in the percentage of FG retrogradely labeled neurons that express FOS; ***p < 0.001.
Thus, we performed whole-cell patch-clamp recordings on pPVT-CeA projection neurons in the rats. Biocytin was injected into the recorded projecting neurons labeled with TMR (red) in the pPVT to confirm that the recorded neurons (green) were pPVT-CeA projection neurons (Fig. 6).
Figure 6.
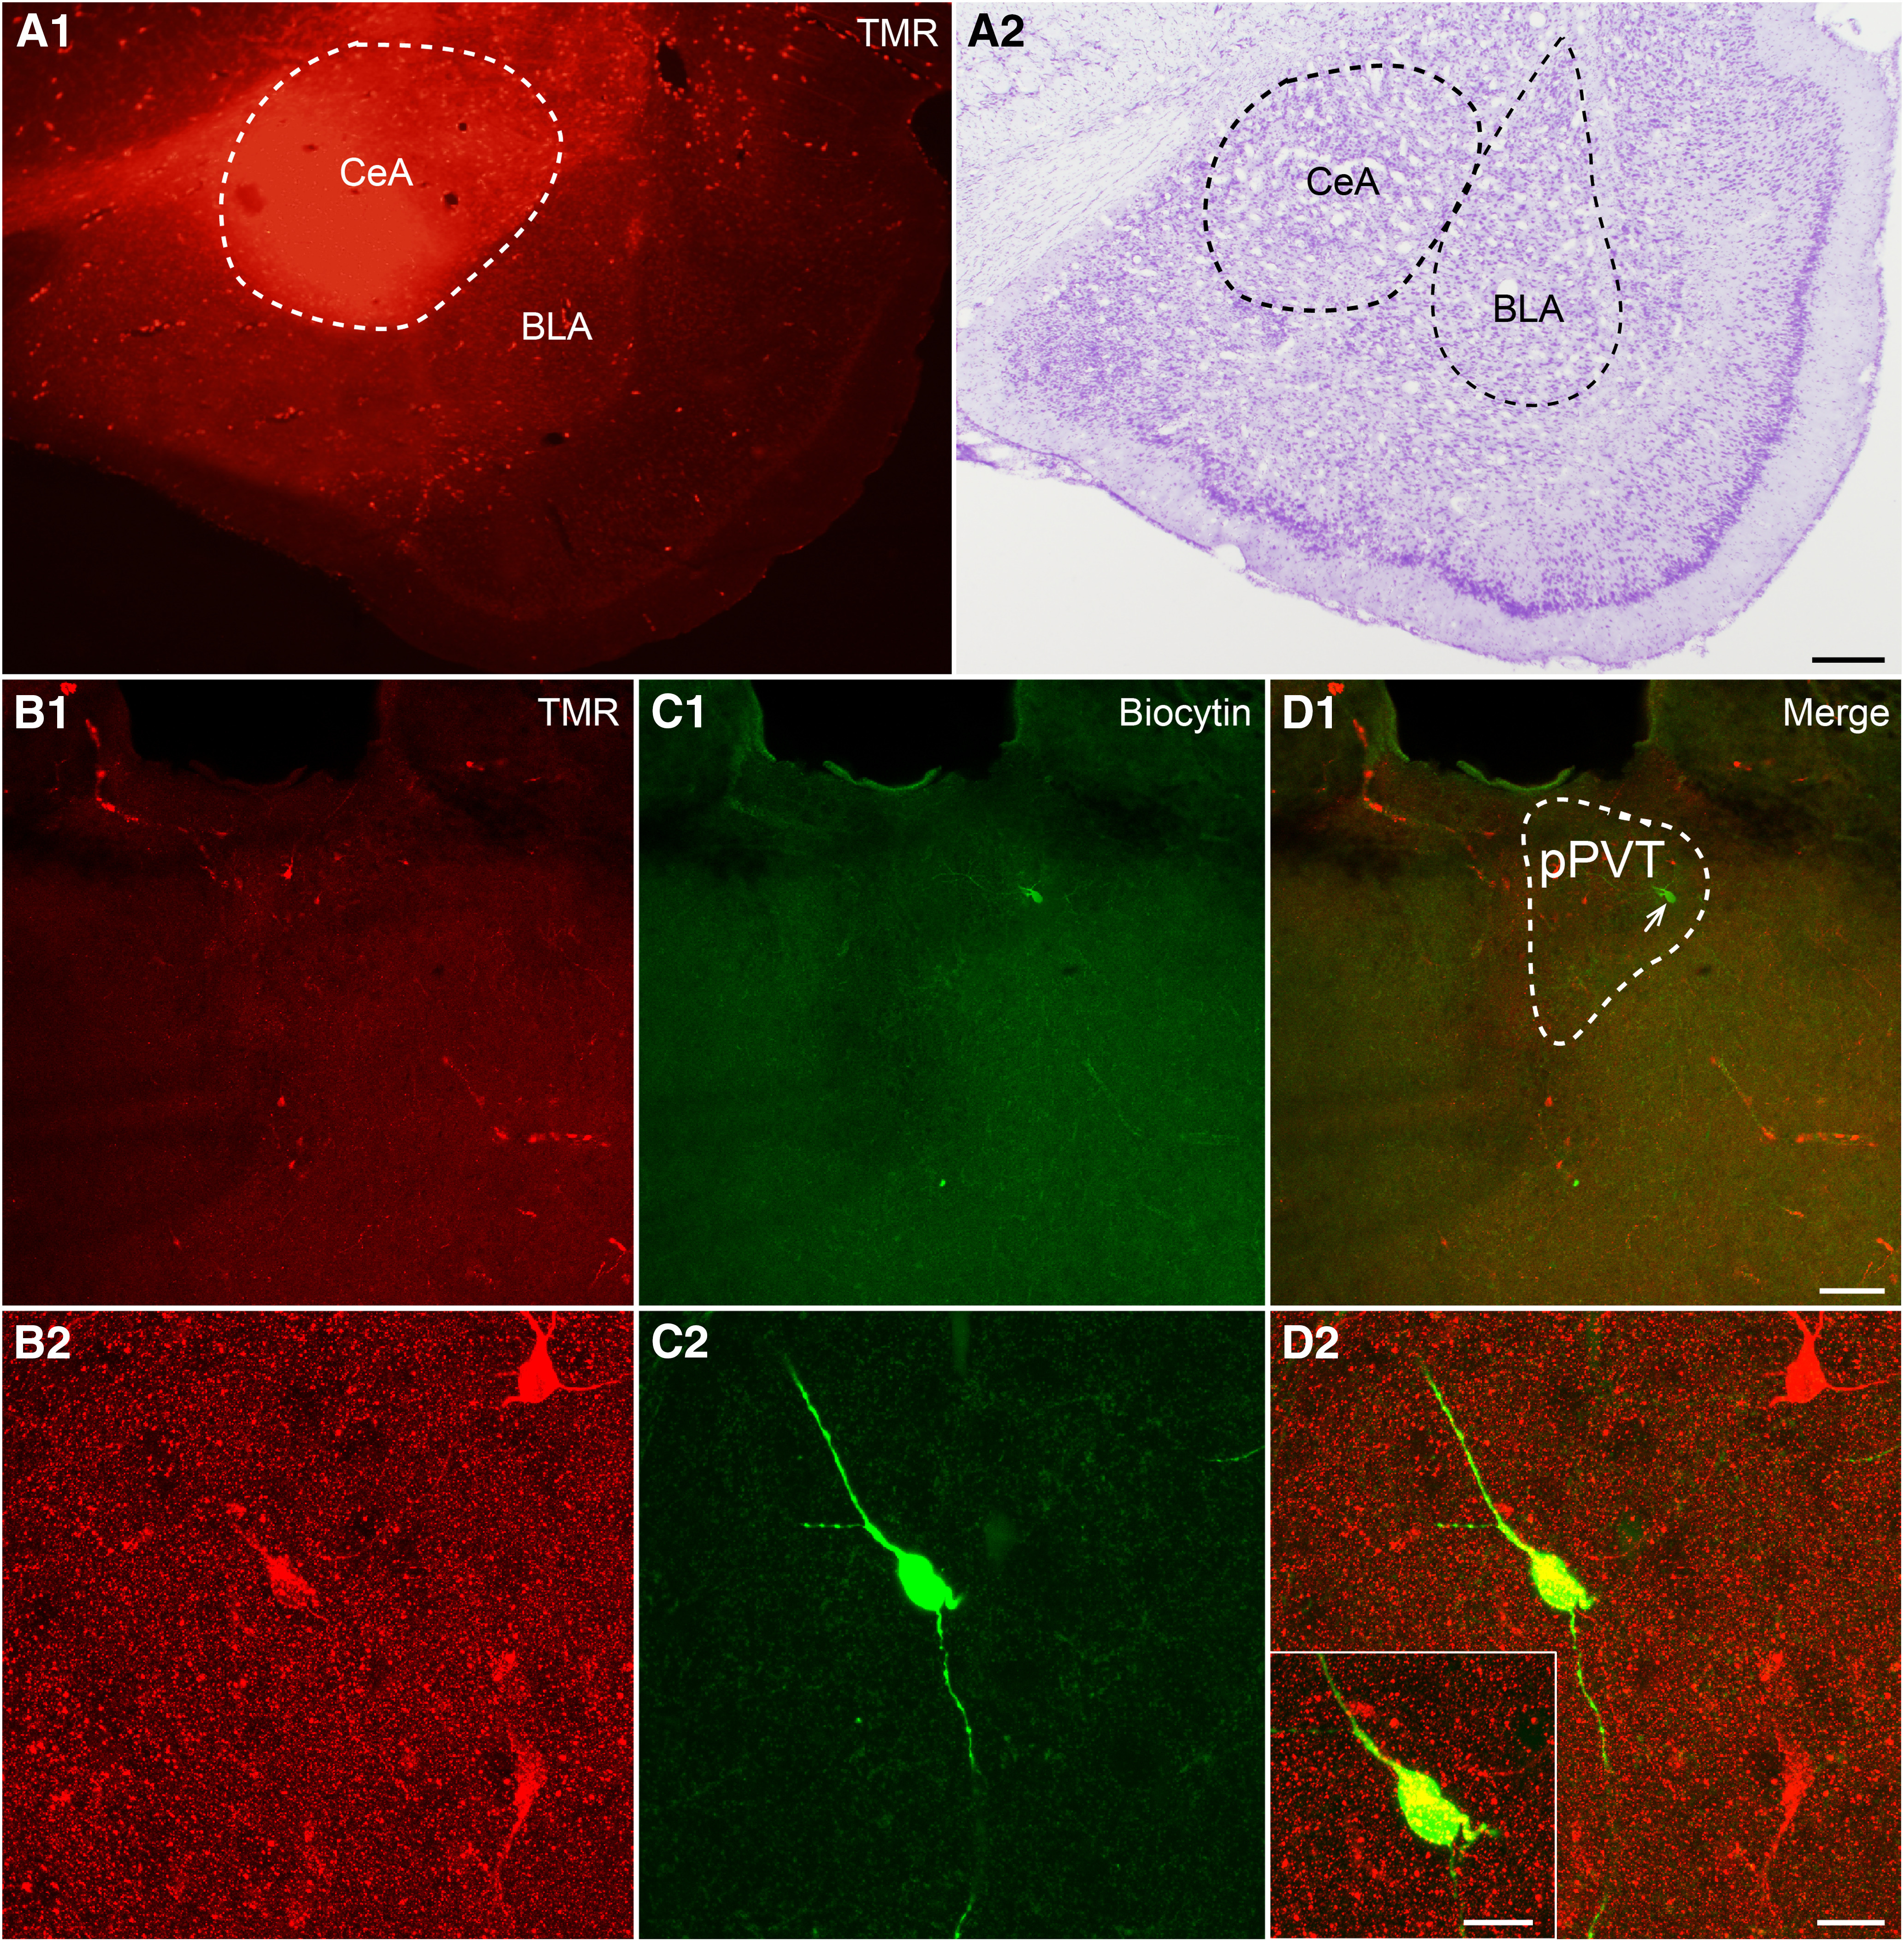
The injection site of TMR in the CeA and recorded pPVT-CeA projecting neuron for electrophysiology. A1, A2, The injection site of TMR in the CeA and Nissl's staining of the adjacent slice. Scale bar = 50 µm (A2; applied in A1). B1, B2, TMR retrogradely labeled neurons (red) in the pPVT at low and high magnifications. C1, C2, The recorded neuron, filled with biocytin and visualized with FITC-conjugate avidin (green). D1, D2, Merged images showing that the biocytin-filled neuron is the TMR retrogradely labeled neuron. Scale bars = 100 µm (D1; applied in B1, C1), 20 µm (D2; applied in B2, C2), and 10 µm (D2, inset).
Compared with the sham group, both the amplitude and frequency of sEPSCs were increased in the SNI group (Fig. 7A–C). The sEPSC amplitude increased from –14.61 ± 2.84 pA in the sham group (n = 10) to –19.33 ± 6.36 pA in the SNI group (n = 9; p < 0.01, Kolmogorov–Smirnov test; Fig. 7C, left). The sEPSC frequency was also significantly increased from 3.75 ± 2.08 Hz in the sham group (n = 10) to 5.7 ± 3.66 Hz in the SNI group (n = 9; p < 0.01, Kolmogorov–Smirnov test; Fig. 7C, right).
Figure 7.

The excitability of pPVT-CeA projecting neurons is increased in neuropathic pain rats. A, Sample traces of sEPSCs of recorded pPVT-CeA projecting neurons in the sham and SNI groups. B, Cumulative distributions of the amplitudes (left) and inter-event intervals (right) of the sEPSC of the sham group (n = 10, black line) and the SNI group (n = 9, red line). The mean cumulative distribution of the sEPSC amplitude in the SNI group is significantly shifted to higher amplitudes (**p < 0.01), and the mean cumulative distribution of the sEPSC interevent intervals in the SNI group is significantly shifted to shorter durations (**p < 0.01). C, Graph showing that the sEPSC amplitude and frequency are significantly increased in the SNI group (**p < 0.01). D, Sample traces of minimal depolarizing current induced action potential in the sham group and the SNI group. E, Graph showing that SNI decreases the rheobase current (**p < 0.01), and increases the mean RMP (*p < 0.05), with no significantly change in the firing threshold and spike amplitude.
To further investigate specific neuronal excitability, we recorded TMR labeled CeA-projecting pPVT neurons. aCSF with 10 μm CNQX, 100 μm AP-5, and 100 μm picrotoxin was used to eliminate the influence of excitatory and inhibitory transmission. The rheobase current (the minimum current required to elicit an action potential) was measured by using current-clamp mode, and sample traces for the sham and SNI groups were shown in Figure 7D. Compared with the sham group (n = 11), the rheobase current in the SNI group (n = 10) was significantly decreased from a mean of 23.6 ± 5.9 to 16 ± 3.9 pA (t(17) = 3.426, p = 0.003, t test; Fig. 7E, left panel). Meanwhile, the mean resting membrane potential (RMP) was increased from −66.5 ± 8 mV in the sham group to –59.4 ± 4.3 mV in the SNI group (t(17) = –2.467, p = 0.023, t test; Fig. 7E). However, there were no significant changes in the firing threshold (−33 ± 4.8 mV in the SNI group vs −32.2 ± 5.4 mV in the sham group, t(17) = 0.225, p = 0.825, t test; Fig. 7E) or spike amplitude (−69 ± 9.2 mV in the SNI group vs −69.9 ± 8.8 mV in the sham group, t(17) = 0.913, p = 0.373, t test; Fig. 7E). These results indicated that the excitability of the pPVT-CeA projecting neurons was increased in neuropathic pain conditions.
Optogenetic activation of the pPVT-CeA pathway induced mechanical allodynia
We employed an optogenetic approach to activate the pPVT-CeA pathway in the rats and observed its effects on the mechanical nociceptive threshold (Fig. 8A). The mCherry-expressing axonal terminals were observed in the CeA (Fig. 8C3) after an intra-pPVT injection of AAV virus (Fig. 8B,C1,C2); the optic fiber was placed just above the CeA (Fig. 8C3,C4). Activation of the pPVT-CeA pathway by blue light significantly decreased the PWTs in naive rats (light on vs light off in ChR2-mCherry group: F(1,10) = 6.996, p = 0.0245, two-way ANOVA with Bonferroni correction; Fig. 8D). The animals that received the virus without ChR2 expression did not show any differences while the light was on (ChR2-mCherry vs mCherry in the light on state: F(1,10) = 5.883, p = 0.0357, two-way ANOVA with Bonferroni correction; Fig. 8D). Therefore, in naive rats, specific activation of the pPVT-CeA pathway is sufficient to evoke mechanical allodynia.
Figure 8.
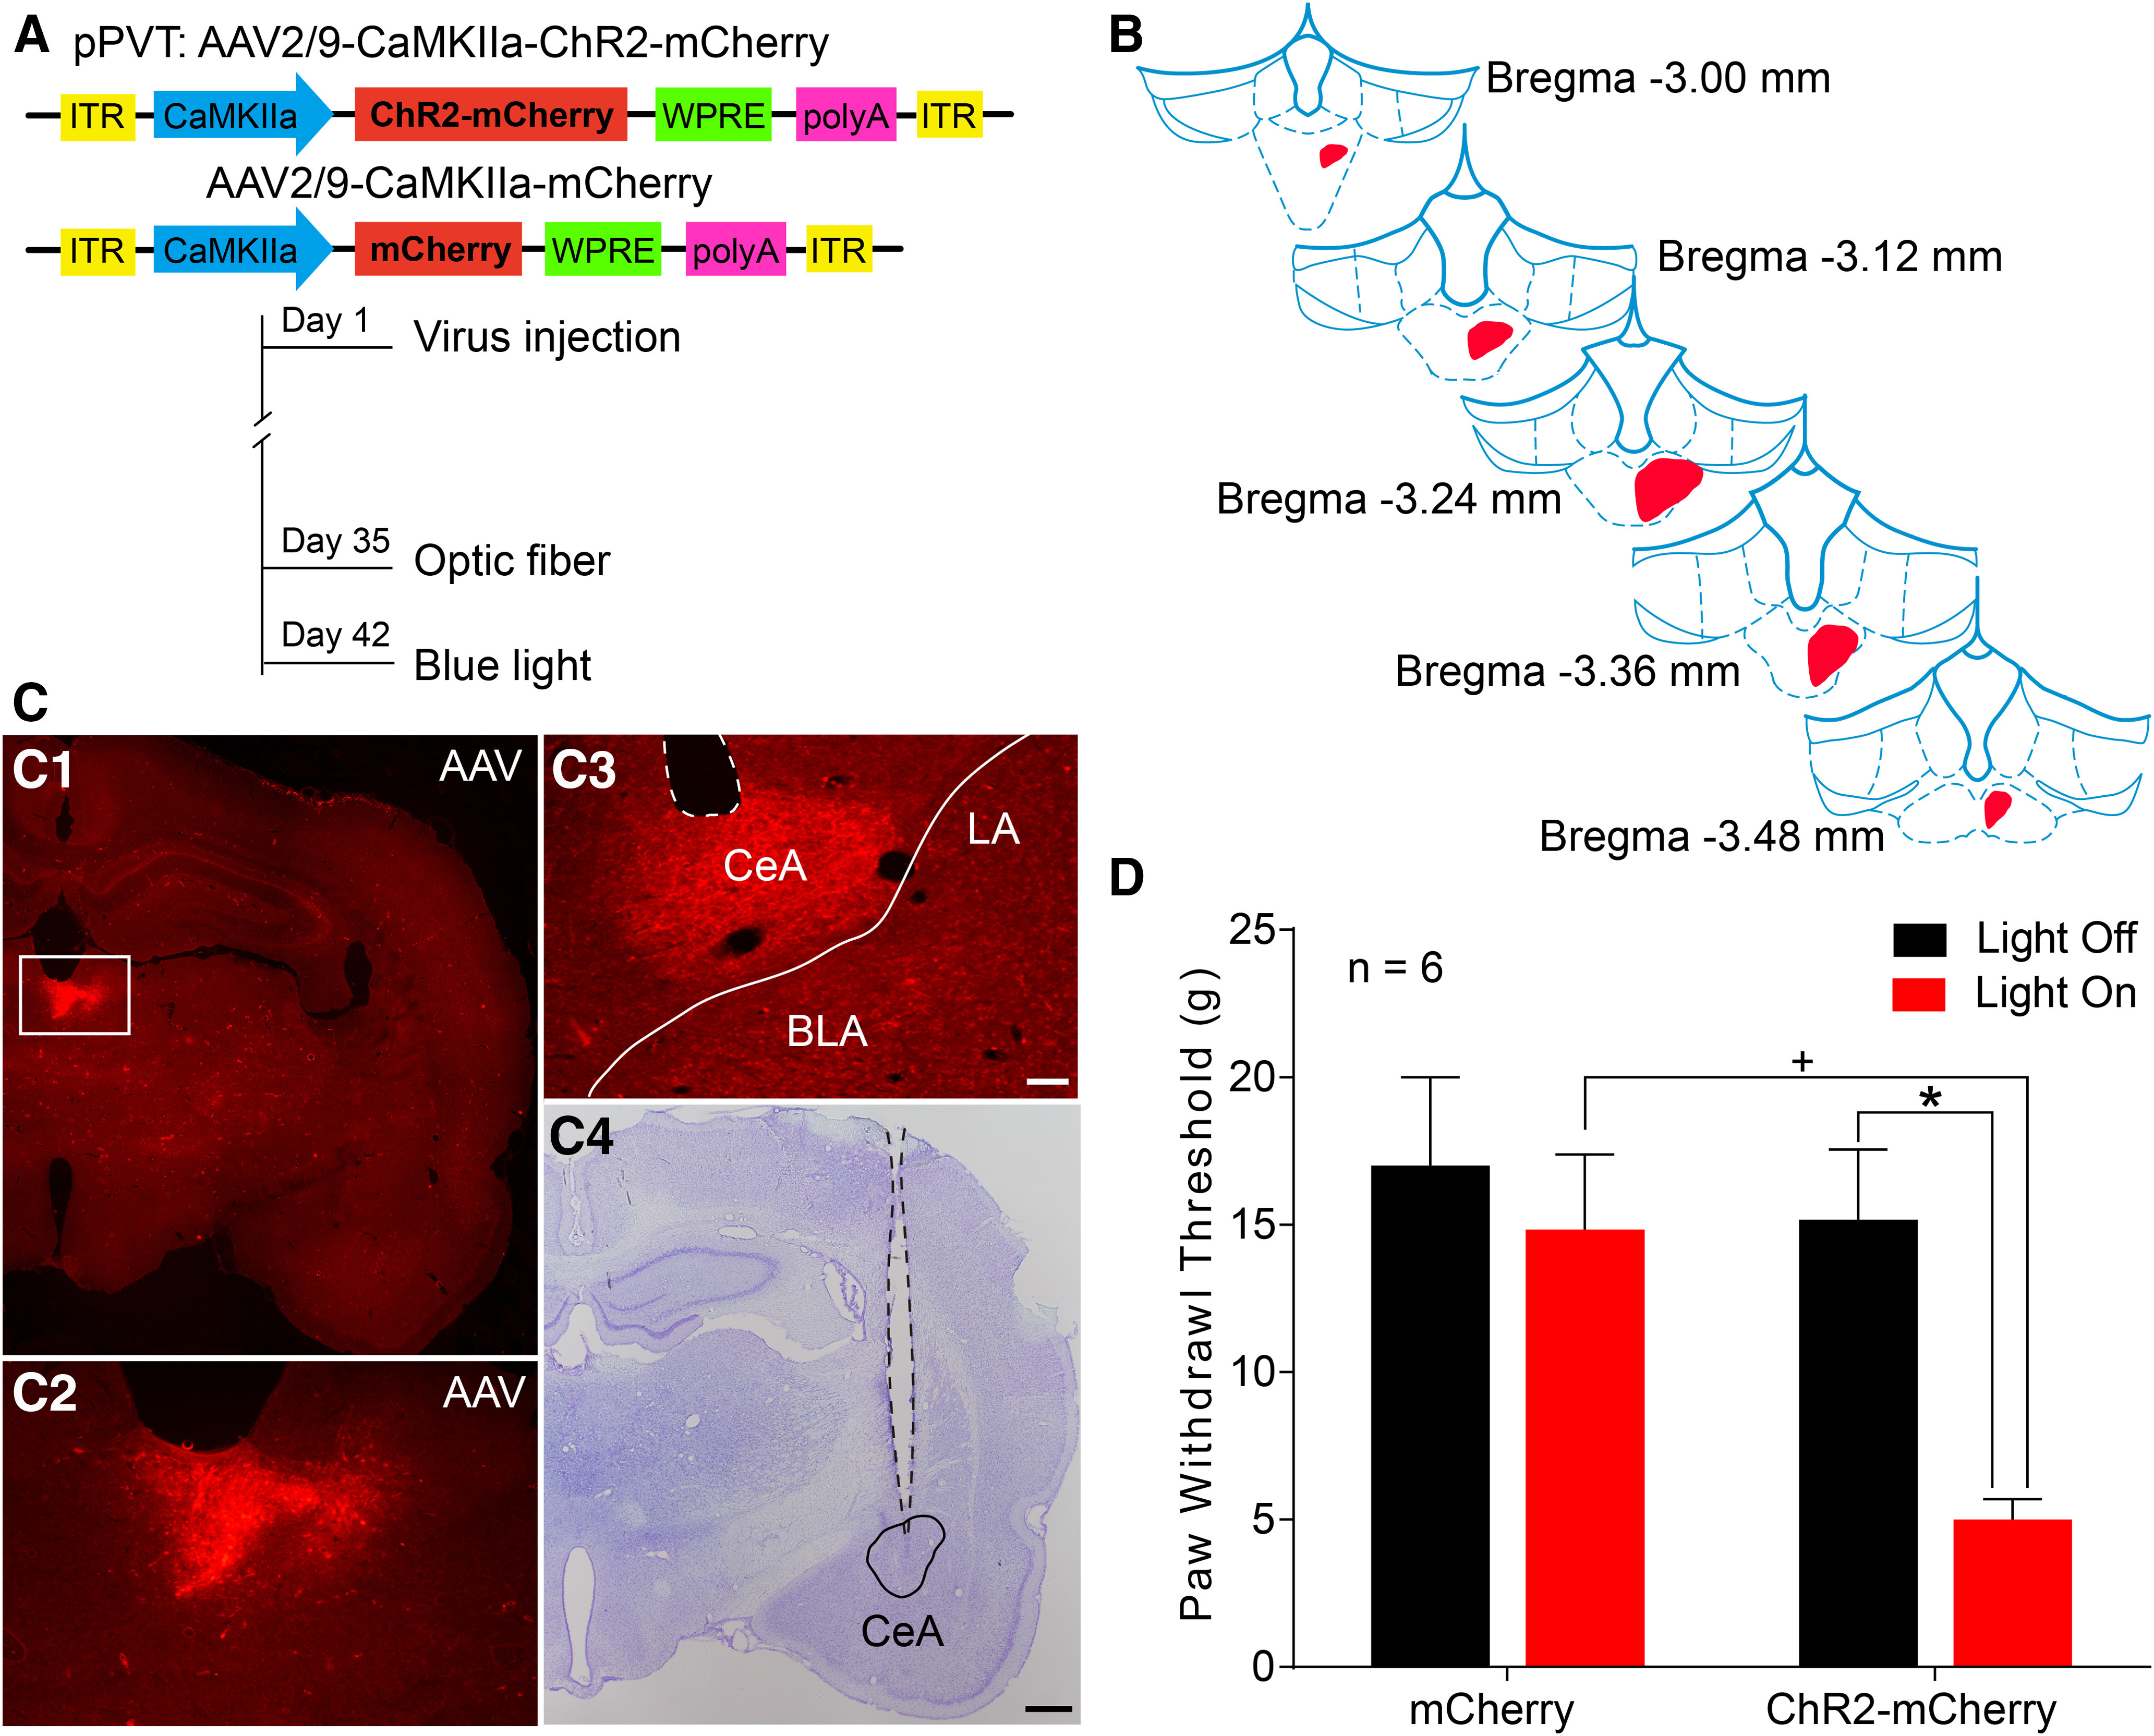
Optogenetic activation of the pPVT-CeA pathway induces mechanical allodynia. A, The constructs as well as the sequences of the adeno-associated viruses (AAV2/9-CaMKIIa-ChR2-mCherry and AAV2/9-CaMKIIa-mCherry) and the experimental procedures. B, The rostro-caudal extent of the virus injection sites in the right pPVT (red) in consecutive coronal brain section. C, Representative images of virus injection sites in the right pPVT (the area in the white frame in C1 is magnified in C2) and virus labeled axonal fibers and terminals in the CeA (C3). The optic fiber trace and its tip site are shown in C3 (white dotted outline) and C4 (black dotted outline). B, C are coming from the same rat. LA: lateral nucleus of amygdala; BLA: basolateral nucleus of amygdala. Scale bars = 200 µm (C4; applied in C1) and 100 µm (C3; applied in C2). D, Light activation of the PVT-CeA pathway results in a significant decrease in the PWTs in naive rats (n = 6 in each group); *p < 0.05, light on versus light off in ChR2-mcherry group; +p < 0.05, ChR2-mCherry versus mCherry in state of light on.
Morphologic evidence for the involvement of the pPVT-CeA-vlPAG pathway in pain modulation
To further study the downstream target of the pPVT-CeA pathway, we investigated the vlPAG based on its role as a key site for the integration of descending nociceptive signals and the connections with the CeA to outline the pPVT-CeA-vlPAG pathway by immunofluorescence and electron microscopy. After BDA was injected into the CeA of the rats (Fig. 9A,B1,B2), projecting BDA axonal fibers were observed in the PAG, particularly in the vlPAG (Fig. 9C1,C2).
Figure 9.
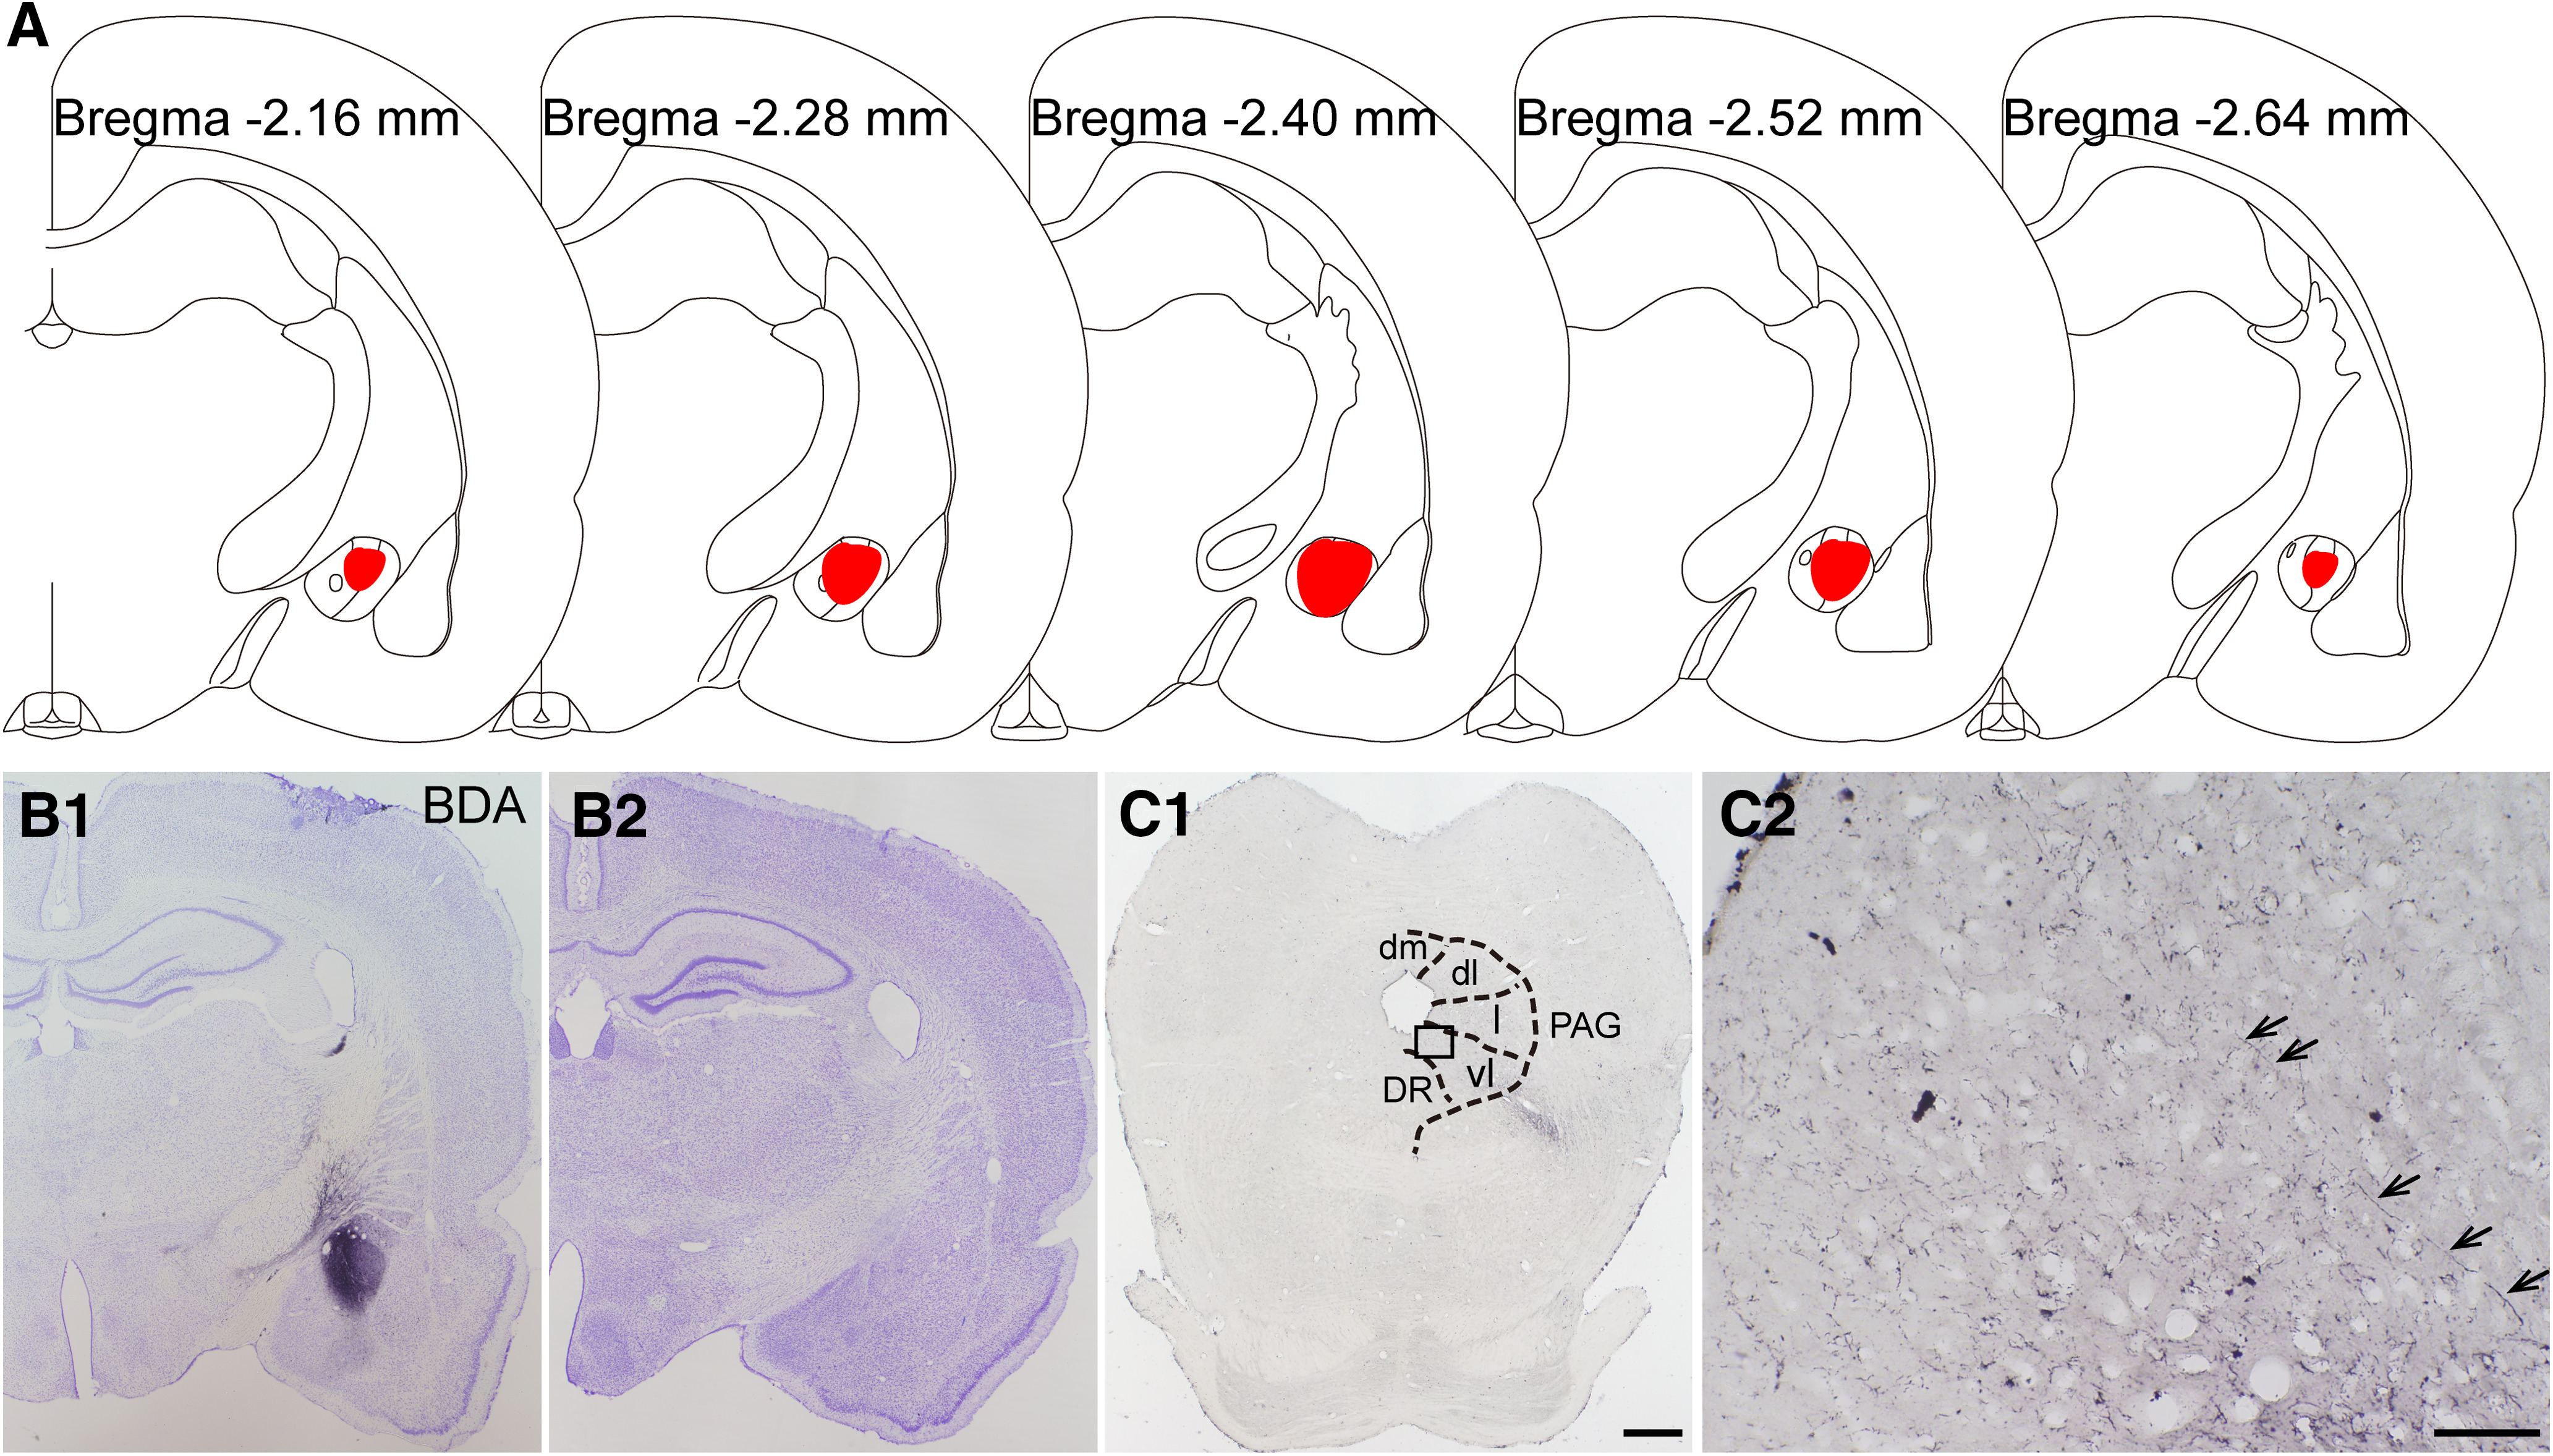
The results of anterograde nerve tract tracing by BDA from CeA to vlPAG in the rats. A, The rostro-caudal extent of BDA injection sites in the CeA (red) in consecutive coronal brain section. B1, B2, The BDA injection site in the CeA and Nissl's staining of the adjacent section. C1, C2, The BDA labeled axonal terminals (black arrows) in the vlPAG. The black square area in C1 is enlarged and displayed in C2. A–C are coming from the same rat. dm: dorsomedial subregion of the PAG; dl: dorsolateral subregion of the PAG; l: lateral subregion of the PAG; vl: ventrolateral subregion of the PAG; DR: dorsal raphe nucleus. Scale bars = 200 µm (C1; applied in B1, B2) and 50 µm (C2).
Combining the anterograde tracer BDA that was injected into the pPVT with the retrograde tracer FG that was injected into the vlPAG of the rats, the representative injection sites were shown in Figure 10A2,B2. The rostro-caudal extent of the related images were displayed in Figure 10A1,B1. The neurons retrogradely labeled with FG (green; Fig. 10C) mainly occupied the medial part (CeM) of the CeA and were also observed in the lateral (CeL) and capsular parts (CeC) of the CeA. The BDA-labeled fibers and terminals (red) were found sparsely in the CeA, especially in the CeL and CeC, respectively (Fig. 10C). The high-power images showed that BDA-labeled fibers and terminals (red) contacted FG-labeled neurons (green) in the CeA (Fig. 10D–F).
Figure 10.

Neuronal connectivity on the pPVT-CeA-vlPAG pathway. A1, The rostro-caudal extent of BDA injection sites in the pPVT (black) in consecutive coronal brain section. B1, The rostro-caudal extent of FG injection sites in the vlPAG (black) in consecutive coronal brain section. A2, Representative photomicrograph showing the injection site of BDA into the right pPVT (black). 3v: the third ventricle. B2, Representative photomicrograph showing the injection site of FG into the right vlPAG (bright color). Aq: aqueduct. Scale bar = 200 µm (A2, B2). C1, C2, The distribution of BDA-labeled axon terminals (red) and FG-labeled neurons (green) in the CeA. CeC: capsular part of the CeA; CeL: lateral part of the CeA; CeM: the medial part of the CeA. Scale bars = 100 µm (C1) and 50 µm (C2). D1, D2, The FG-labeled neurons in the CeA after tracer was injected into the vlPAG. E1, E2, The BDA-labeled fibers and axonal terminals in the CeA projected from the pPVT. F1, F2, The connections between BDA-labeled axonal terminals and FG-labeled neurons (white arrows in F2). The white square area in F1 is enlarged and displayed in D2–F2. Scale bars = 20 µm (F1; applied in D1, E1) and 10 µm (F2; applied in D2, E2). A–F are coming from the same rat. G, H, The asymmetric synapses (black arrowheads) are formed by BDA anterogradely labeled axonal terminals (Ax-BDA) and FG-labeled postsynaptic dendrites (Den-FG). Scale bar = 250 nm (G, H).
Furthermore, electron microscopy confirmed the synaptic connections between the BDA-labeled axon terminals and FG-labeled neurons in the CeA (Fig. 10G,H). Specifically, BDA-labeled axonal terminals made asymmetric synapses with FG-labeled dendrites in the CeA, suggesting that the axon terminals from the pPVT might make excitatory synapses with the CeA neurons projecting to the vlPAG.
To investigate the role of the pPVT-CeA-vlPAG pathway in the pain transmission process, we conducted FOS immunostaining to observe neuronal activity in the CeA of the rats with SNI. We found FOS expression (red) in some CeA neurons that received pPVT input (BDA-labeled axonal terminals, green) and projected to the vlPAG (FG-labeled neurons, blue; Fig. 11).
Figure 11.
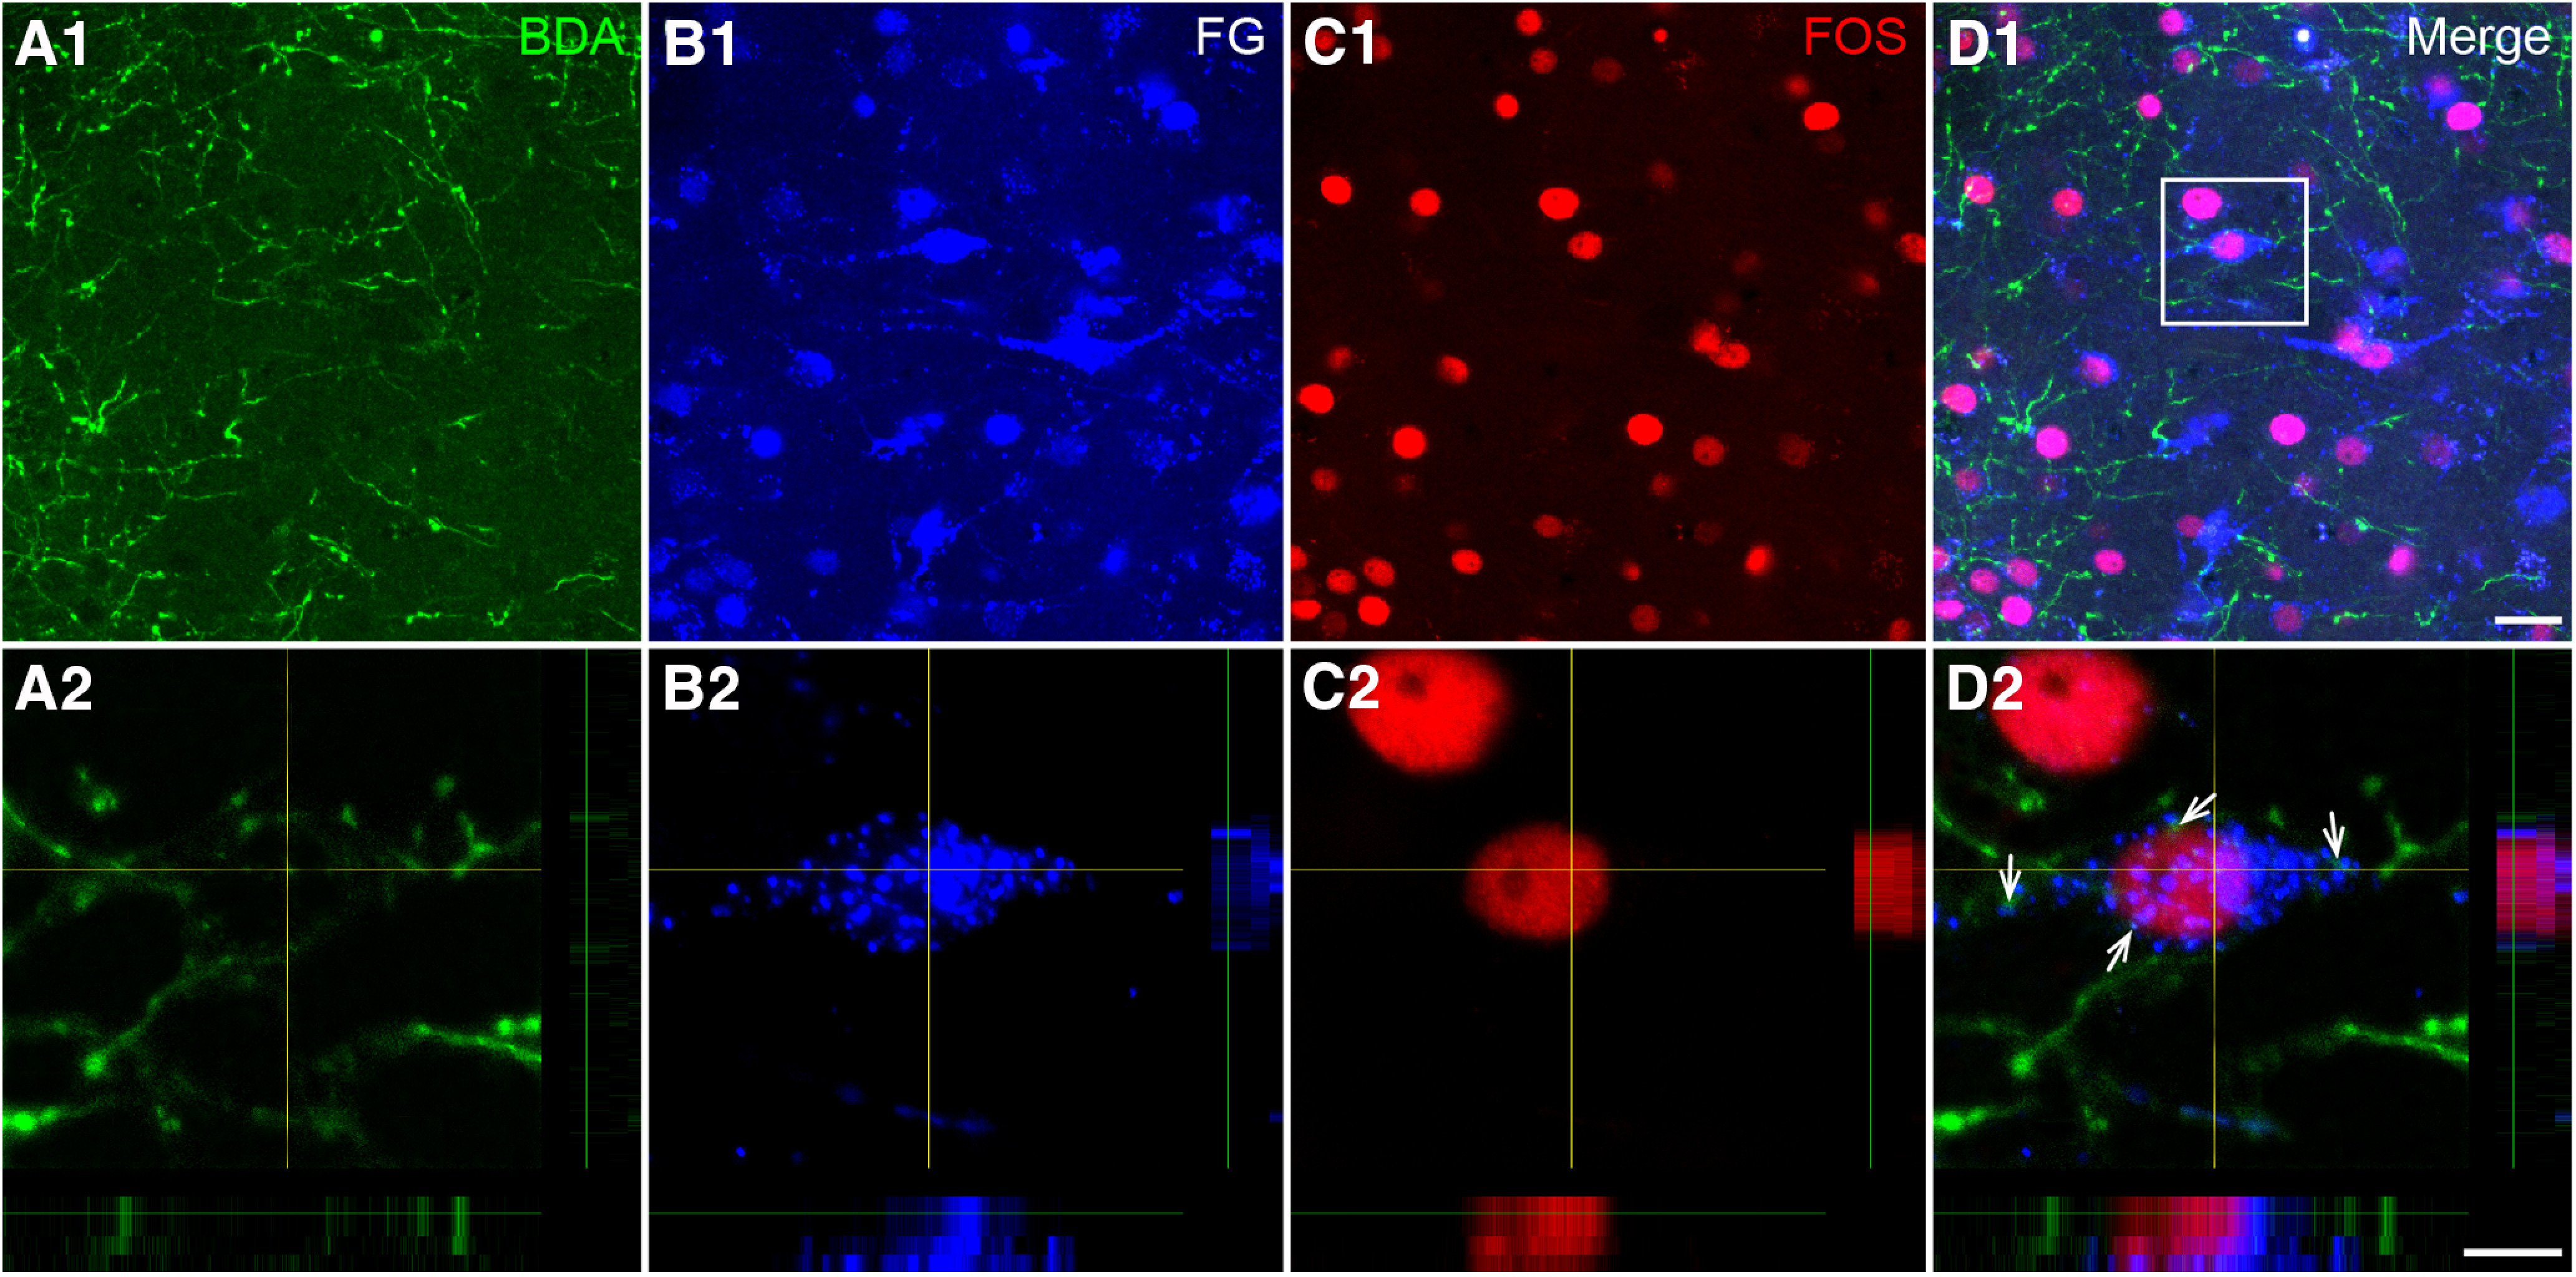
Activation of the pPVT-CeA-vlPAG neural pathway indicated by FOS staining in the CeA. A1, A2, The BDA-labeled axonal terminals (green) observed in the CeA coming from the pPVT. B1, B2, The FG-labeled neuronal somata and processes (blue) in the CeA retrogradely labeled from the vlPAG. C1, C2, The FOS-labeled NeuNs (red). D1, D2, The FG/FOS double-labeled neurons surrounded by BDA-labeled fibers (white arrows in D2). The white square area in D1 is enlarged and displayed in A2–D2. A2–D2 show a projection of four optical sections and the total distance in the z-axis is 4.5 μm. Scale bars = 20 µm (D1; applied in A1–C1) and 10 µm (D2; applied in A2–C2).
Glutamatergic neurons in the vlPAG are downstream targets of the pPVT-CeA pathway
Considering that the majority of the fibers projecting from the pPVT to the CeA were glutamatergic and most of the CeA projection neurons were GABAergic inhibitory neurons (Lu et al., 2015; Tovote et al., 2016), we hypothesized that the neurons downstream of the pPVT-CeA pathway in the vlPAG produced analgesia so that the pPVT-CeA-vlPAG pathway could play a facilitating role in pain transmission. It has been shown in a previous study that glutamatergic neurons are important analgesic neurons in the vlPAG (Tovote et al., 2016). Next, the VGLUT2-ires-Cre mice were used to evaluate whether these vlPAG neurons receiving CeA input were excitatory. The specific procedures and viruses are shown in Figure 12A,B. The Cre-dependent AAV2/9-EYFP anterograde virus was injected into the pPVT (Fig. 12C1), and the anterogradely labeled axonal terminals (green) from the pPVT were obviously distributed in the CeA and BLA (Fig. 12D1–D3). In addition, after an injection of Cre-dependent AAV2/9-TVA RVG and Rabies-EnvA-ΔG into the vlPAG of the VGLUT2-ires-Cre mice (Fig. 12C2), we found that retrograde transsynaptic labeled neurons (red) were observed in the CeA, especially in the CeM, which indicated that projection fibers from CeA neurons contacted glutamatergic neurons in the vlPAG (Fig. 12E1–E3). Importantly, we further observed that the virus-labeled glutamatergic axonal terminals from the pPVT closely contacted the Rabies-labeled CeA neurons (Fig. 12F1–F3).
Figure 12.

Fluorescent photomicrographs observation of the pPVT-CeA-vlPAG pathway. A, B, Schematic diagrams of the experimental procedure, the constructs and sequences of the adeno-associated viruses (AAV2/9-Ef1α-DIO-EYFP) and the rabies-based viruses. C, The virus injection sites in the pPVT (green, C1) and the vlPAG (yellow, C2). C2, VGLUT2 starter cells are labeled in yellow, and presynaptic partners throughout the brain are labeled in red. 3v: the third ventricle; Aq: aqueduct; dm: dorsomedial subregion of the PAG; dl: dorsolateral subregion of the PAG; l: lateral subregion of the PAG; vl: ventrolateral subregion of the PAG; DR: dorsal raphe nucleus. Scale bar = 200 µm (C2; applied in C1). D1–D3, The pPVT projecting glutamatergic terminals in the CeA (green). E1–E3, The dsred-labeled presynaptic projection neurons in the CeA. F1–F3, The connections (white arrows in F3) between the pPVT projecting glutamatergic terminals and the CeA-vlPAG projection neurons. The white square area in F2 is enlarged and displayed in D3–F3. C–F are coming from the same mouse. Scale bars = 100 µm (F1; applied in D1, E1), 10 µm (F2; applied in D2, E2), and 5 µm (F3; applied in D3, E3).
Discussion
The present study defined a pPVT-CeA-vlPAG neural pathway through which descending nociceptive facilitation was generated. It was demonstrated that the inactivation of pPVT neurons attenuated SNI-induced neuropathic pain. In contrast, pPVT-CeA projecting neurons were activated, and their excitability increased in SNI rats. Optogenetic activation of the pPVT projection fibers in the CeA produced mechanical hypersensitivity in naive rats. In addition, we established a pPVTGlu+-CeA-vlPAGGlu+ descending nociceptive pathway, which showed that CeA neurons received glutamatergic pPVT projections and sent projections to the glutamatergic neurons in the vlPAG to contribute to neuropathic pain signaling.
The PVT is now notable not only for its extensive brain connectivity (Chen and Su, 1990; Bubser and Deutch, 1998) but also for its involvement in stress (Bhatnagar et al., 2002), anxiety-like responses (Li et al., 2010), fear (Li et al., 2014; Penzo et al., 2015), etc. Recently, the function of the PVT in nociception transmission and modulation was disclosed in visceral pain (Jurik et al., 2015) and chronic musculoskeletal pain (Chen et al., 2010). However, the underlying neuronal circuit and specific mechanism are rarely reported. The PVT receives projections from some nuclei located in the brainstem, such as the lateral subnucleus of the parabrachial nucleus (PBN; Krout and Loewy, 2000b; Liang et al., 2016) and PAG (Krout and Loewy, 2000a). The PBN is considered an important relay point for nociceptive information being sent to the forebrain (Fulwiler and Saper, 1984). The brain stem inputs to the PVT suggest that it has a role in pain transmission and regulation. In the present study, we found that lesion or inhibition of the pPVT neurons can effectively alleviate mechanical allodynia in SNI rats, which indicates that the pPVT participates in the transmission or regulation of pain signals and causes an increase in pain behaviors. It was shown that inhibiting the activities of pPVT neurons by DREADDs reversed the PWTs of SNI rats to baseline but lesioning pPVT neurons with KA did not completely relieve the mechanical allodynia induced by SNI. To exclude the effect of CNO metabolites on the central nervous system, a control virus was included in the experiment. However, CNO administration in the SNI-mCherry group did not affect the mechanical allodynia. It is known that KA can nonspecifically damage all neurons in the injected area. However, the virus with the CaMKIIa promotor can specifically silence excitatory neurons. The different effects of the two methods may be attributed to the different phenotypes of influenced neurons. Moreover, we observed glial proliferation in the pPVT after KA lesion, which may also be responsible for the different effects on sensory thresholds. The MDs participate in the descending facilitation of mechanical hyperalgesia and the VMs are specifically involved in the descending inhibition of heat hyperalgesia. Therefore, the MD and VM nuclei have been verified to function as novel nociceptive discriminators to form two distinct endogenous systems in the control of mechanically evoked and heat-evoked noxious responses (You et al., 2013). Although we did not analyze the function of the pPVT in thermal allodynia, our results show that inhibiting pPVT neurons could reduce mechanical allodynia and that the pPVT could function to activate the endogenous descending facilitation system.
Previous studies have shown detailed depiction of the brain regions innervated by PVT, which include the nucleus accumbens (NAc), BNST, and CeA (Moga et al., 1995; Li and Kirouac, 2008; Vertes and Hoover, 2008; Kirouac, 2015). Our anatomic results showed that the pPVT had dense connections with the CeL, which bore a high resemblance to that in previous neuroanatomical reports (Dong et al., 2017). Two retrograde tracers, i.e., FG and TMR, were used in our study to trace the pPVT-CeA pathway. Compared with TMR, FG has a better tracking effect, and FG-labeled neurons are more clearly defined. Therefore, we used FG as a tracer to observe the distribution of retrogradely labeled neurons in the pPVT after CeA injection. However, FG is sensitive to temperature changes, and the expression of FG decreases when the hybridization temperature is 50–60°C. Therefore, TMR was used for the FISH study. In addition, considering that FG's toxicity may affects the survival and activity of neurons during electrophysiological recording (Garrett et al., 1991), we also chose TMR as the retrograde tracer in this study (Carr et al., 1994).
The CeA receives nociceptive information from the PBN (Neugebauer and Li, 2003) and shows responses to noxious stimuli. Inhibiting amygdala activity with lesions or pharmacologic interventions decreases pain-related behaviors in different pain models (Pedersen et al., 2007; Fu and Neugebauer, 2008; Ren et al., 2013). In contrast, increasing amygdala activity can increase pain in normal rats (Han et al., 2010; Kolber et al., 2010). Previous reports have shown that long-term facilitation is only observed in the right amygdala in acute and inflammatory pain models (Carrasquillo and Gereau, 2007; Ji and Neugebauer, 2009). Neuropathic pain can cause sustained discharge enhancement in the right amygdala, but there is only transient activity enhancement in the left amygdala (Gonçalves and Dickenson, 2012). The mechanism involved in this left-right difference is not clear. The nociceptive information the SDH can be transmitted to the contralateral CeA through the PBN (Todd, 2010). Therefore, in this study, the SNI operation was operated on the left side, and stereotactic injections and electrophysiology recordings in the CeA were performed on the right side.
In the present study, FOS staining showed that pPVT-CeA projection neurons were activated after SNI. In addition, an in vitro electrophysiology study also showed that the excitability of pPVT-CeA projection neurons was increased in neuropathic animals. Behaviorally, optogenetic activation of the pPVT projection fibers in the CeA induced hypersensitivity in naive rats. It has been reported that PVT neurons are mainly excitatory glutamatergic neurons (Hur and Zaborszky, 2005; Kirouac, 2015). In our study, we confirmed that the excitatory glutamatergic neurons in the pPVT that projected to the CeA were positive for VGLUT2 mRNA. It is well proven that the CeA contains medium-size spiny, GABAergic inhibitory neurons (McDonald, 1982; Cassell et al., 1986; Swanson and Petrovich, 1998; Fang et al., 2018). Collectively, our data suggest that the pPVT excitatory glutamatergic neurons send projections to the CeA GABAergic neurons and that the PVT-CeA pathway is involved in descending regulation of nociception.
The PAG plays a vital role in upstream and downstream nociceptive integration and transmission (Millan, 2002; François et al., 2017). The vlPAG is regarded as the most effective portion that mediates stimulation and stress-induced analgesia (Millan, 2002) and is a key downstream target of CeA neurons (Tershner and Helmstetter, 2000). Dense connections between the CeA and vlPAG were also observed in this study. Therefore, we confirmed the pPVT-CeA-vlPAG pathway by neural pathway tracing combined with electron microscopy. The CeA neurons in the pPVT-CeA-vlPAG pathway were activated by SNI, which indicated that the pPVT might trigger the endogenous descending facilitation of nociception through connectivity with CeA-vlPAG projection neurons. Subsequently, we traced the pPVTGlu+-CeA-vlPAGGlu+ pathway between the CeA projection neurons and the glutamatergic neurons of the vlPAG, which showed that the VGLUT2+ vlPAG neurons were the target of the pPVT-CeA pathway. Glutamatergic vlPAG neurons with a marked analgesic effect have been verified (Tovote et al., 2016). Our results concluded that VGLUT2 glutamatergic neurons in the pPVT and vlPAG in the pPVT-CeA-vlPAG pathway play an important role in nociceptive descending facilitation. In the present study, rats were the main research subject. However, the VGLUT2-ires-Cre transgenic mice were used to identify the types of pPVT and vlPAG neurons on the pPVT-CeA-vlPAG pathway. The existences of the pPVT-CeA and CeA-vlPAG pathways have been reported in these two species (Rizvi et al., 1991; Li and Kirouac, 2008; Do-Monte et al., 2015). Moreover, based on our neuronal tract tracing results of Figures 10 (rats) and 12 (mice), the similar fiber connections on the pPVT-CeA-vlPAG pathway are found in the brains of rats and mice.
Recently, the PVT has received more attention about its involvement in fear, feeding, and controlling wakefulness. The present study further highlights the pPVT as a key nucleus that mediates nociceptive information modulation and the circuit from pPVT to CeA to PAG decreases descending inhibition of pain. Inactivation of this circuit might be a direct and useful therapeutic method to alleviate chronic pain. However, further studies are necessary to elucidate the different roles and interactions of distinct types of neurons in this pathway involved in pain modulation.
Footnotes
This work was supported by National Natural Science Foundation of China Grants 81620108008 and 81371239 (to Y.-Q.L.), 31671087 and 31871061 (to Y.-L.D.), and 81801099 (to J.-B.Y.) and by the Shandong Provincial Natural Science Foundation Grant ZR2018PH017 (to S.-H.L.).
The authors declare no competing financial interests.
References
- Armbruster BN, Li X, Pausch MH, Herlitze S, Roth BL (2007) Evolving the lock to fit the key to create a family of G protein-coupled receptors potently activated by an inert ligand. Proc Natl Acad Sci USA 104:5163–5168. 10.1073/pnas.0700293104 [DOI] [PMC free article] [PubMed] [Google Scholar]
- Bhatnagar S, Huber R, Nowak N, Trotter P (2002) Lesions of the posterior paraventricular thalamus block habituation of hypothalamic-pituitary-adrenal responses to repeated restraint. J Neuroendocrinol 14:403–410. 10.1046/j.0007-1331.2002.00792.x [DOI] [PubMed] [Google Scholar]
- Bubser M, Deutch AY (1998) Thalamic paraventricular nucleus neurons collateralize to innervate the prefrontal cortex and nucleus accumbens. Brain Res 787:304–310. 10.1016/s0006-8993(97)01373-5 [DOI] [PubMed] [Google Scholar]
- Callaway EM, Luo L (2015) Monosynaptic circuit tracing with glycoprotein-deleted rabies viruses. J Neurosci 35:8979–8985. 10.1523/JNEUROSCI.0409-15.2015 [DOI] [PMC free article] [PubMed] [Google Scholar]
- Carr PA, Noga BR, Nance DM, Jordan LM (1994) Intracellular labeling of cat spinal neurons using a tetramethylrhodamine-dextran amine conjugate. Brain Res Bull 34:447–451. 10.1016/0361-9230(94)90017-5 [DOI] [PubMed] [Google Scholar]
- Carrasquillo Y, Gereau RW (2007) Activation of the extracellular signal-regulated kinase in the amygdala modulates pain perception. J Neurosci 27:1543–1551. 10.1523/JNEUROSCI.3536-06.2007 [DOI] [PMC free article] [PubMed] [Google Scholar]
- Cassell MD, Gray TS, Kiss JZ (1986) Neuronal architecture in the rat central nucleus of the amygdala: a cytological, hodological, and immunocytochemical study. J Comp Neurol 246:478–499. 10.1002/cne.902460406 [DOI] [PubMed] [Google Scholar]
- Chen S, Su HS (1990) Afferent connections of the thalamic paraventricular and parataenial nuclei in the rat–a retrograde tracing study with iontophoretic application of Fluoro-Gold. Brain Res 522:1–6. 10.1016/0006-8993(90)91570-7 [DOI] [PubMed] [Google Scholar]
- Chen WK, Liu IY, Chang YT, Chen YC, Chen CC, Yen CT, Shin HS, Chen CC (2010) Ca(v)3.2 T-type Ca2+ channel-dependent activation of ERK in paraventricular thalamus modulates acid-induced chronic muscle pain. J Neurosci 30:10360–10368. 10.1523/JNEUROSCI.1041-10.2010 [DOI] [PMC free article] [PubMed] [Google Scholar]
- Ciocchi S, Herry C, Grenier F, Wolff SB, Letzkus JJ, Vlachos I, Ehrlich I, Sprengel R, Deisseroth K, Stadler MB, Müller C, Lüthi A (2010) Encoding of conditioned fear in central amygdala inhibitory circuits. Nature 468:277–282. 10.1038/nature09559 [DOI] [PubMed] [Google Scholar]
- Coggeshall RE. (1992) A consideration of neural counting methods. Trends Neurosci 15:9–13. 10.1016/0166-2236(92)90339-a [DOI] [PubMed] [Google Scholar]
- Decosterd I, Woolf CJ (2000) Spared nerve injury: an animal model of persistent peripheral neuropathic pain. Pain 87:149–158. [DOI] [PubMed] [Google Scholar]
- Do-Monte FH, Quiñones-Laracuente K, Quirk GJ (2015) A temporal shift in the circuits mediating retrieval of fear memory. Nature 519:460–463. 10.1038/nature14030 [DOI] [PMC free article] [PubMed] [Google Scholar]
- Dong X, Li S, Kirouac GJ (2017) Collateralization of projections from the paraventricular nucleus of the thalamus to the nucleus accumbens, bed nucleus of the stria terminalis, and central nucleus of the amygdala. Brain Struct Funct 222:3927–3943. [DOI] [PubMed] [Google Scholar]
- Fang Q, Li Z, Huang GD, Zhang HH, Chen YY, Zhang LB, Ding ZB, Shi J, Lu L, Yang JL (2018) Traumatic stress produces distinct activations of GABAergic and glutamatergic neurons in amygdala. Front Neurosci 12:387. 10.3389/fnins.2018.00387 [DOI] [PMC free article] [PubMed] [Google Scholar]
- Farrell MS, Roth BL (2013) Pharmacosynthetics: reimagining the pharmacogenetic approach. Brain Res 1511:6–20. 10.1016/j.brainres.2012.09.043 [DOI] [PMC free article] [PubMed] [Google Scholar]
- François A, Low SA, Sypek EI, Christensen AJ, Sotoudeh C, Beier KT, Ramakrishnan C, Ritola KD, Sharif-Naeini R, Deisseroth K, Delp SL, Malenka RC, Luo L, Hantman AW, Scherrer G (2017) A brainstem-spinal cord inhibitory circuit for mechanical pain modulation by GABA and enkephalins. Neuron 93:822–839.e6. 10.1016/j.neuron.2017.01.008 [DOI] [PMC free article] [PubMed] [Google Scholar]
- Fu Y, Neugebauer V (2008) Differential mechanisms of CRF1 and CRF2 receptor functions in the amygdala in pain-related synaptic facilitation and behavior. J Neurosci 28:3861–3876. 10.1523/JNEUROSCI.0227-08.2008 [DOI] [PMC free article] [PubMed] [Google Scholar]
- Fulwiler CE, Saper CB (1984) Subnuclear organization of the efferent connections of the parabrachial nucleus in the rat. Brain Res 319:229–259. 10.1016/0165-0173(84)90012-2 [DOI] [PubMed] [Google Scholar]
- Garrett WT, McBride RL, Williams JK, Feringa ER (1991) Fluoro-Gold's toxicity makes it inferior to True Blue for long-term studies of dorsal root ganglion neurons and motoneurons. Neurosci Lett 128:137–139. 10.1016/0304-3940(91)90778-R [DOI] [PubMed] [Google Scholar]
- Gonçalves L, Dickenson AH (2012) Asymmetric time-dependent activation of right central amygdala neurones in rats with peripheral neuropathy and pregabalin modulation. Eur J Neurosci 36:3204–3213. 10.1111/j.1460-9568.2012.08235.x [DOI] [PubMed] [Google Scholar]
- Han JS, Li W, Neugebauer V (2005) Critical role of calcitonin gene-related peptide 1 receptors in the amygdala in synaptic plasticity and pain behavior. J Neurosci 25:10717–10728. 10.1523/JNEUROSCI.4112-05.2005 [DOI] [PMC free article] [PubMed] [Google Scholar]
- Han JS, Adwanikar H, Li Z, Ji G, Neugebauer V (2010) Facilitation of synaptic transmission and pain responses by CGRP in the amygdala of normal rats. Mol Pain 6:10. 10.1186/1744-8069-6-10 [DOI] [PMC free article] [PubMed] [Google Scholar]
- Heinricher MM, Tavares I, Leith JL, Lumb BM (2009) Descending control of nociception: specificity, recruitment and plasticity. Brain Res Rev 60:214–225. 10.1016/j.brainresrev.2008.12.009 [DOI] [PMC free article] [PubMed] [Google Scholar]
- Hioki H, Nakamura H, Ma YF, Konno M, Hayakawa T, Nakamura KC, Fujiyama F, Kaneko T (2010) Vesicular glutamate transporter 3-expressing nonserotonergic projection neurons constitute a subregion in the rat midbrain raphe nuclei. J Comp Neurol 518:668–686. 10.1002/cne.22237 [DOI] [PubMed] [Google Scholar]
- Hsu DT, Kirouac GJ, Zubieta JK, Bhatnagar S (2014) Contributions of the paraventricular thalamic nucleus in the regulation of stress, motivation, and mood. Front Behav Neurosci 8:73. 10.3389/fnbeh.2014.00073 [DOI] [PMC free article] [PubMed] [Google Scholar]
- Hur EE, Zaborszky L (2005) Vglut2 afferents to the medial prefrontal and primary somatosensory cortices: a combined retrograde tracing in situ hybridization study [corrected]. J Comp Neurol 483:351–373. 10.1002/cne.20444 [DOI] [PubMed] [Google Scholar]
- Ji G, Neugebauer V (2009) Hemispheric lateralization of pain processing by amygdala neurons. J Neurophysiol 102:2253–2264. 10.1152/jn.00166.2009 [DOI] [PMC free article] [PubMed] [Google Scholar]
- Jurik A, Auffenberg E, Klein S, Deussing JM, Schmid RM, Wotjak CT, Thoeringer CK (2015) Roles of prefrontal cortex and paraventricular thalamus in affective and mechanical components of visceral nociception. Pain 156:2479–2491. 10.1097/j.pain.0000000000000318 [DOI] [PubMed] [Google Scholar]
- Kaneko T, Saeki K, Lee T, Mizuno N (1996) Improved retrograde axonal transport and subsequent visualization of tetramethylrhodamine (TMR)-dextran amine by means of an acidic injection vehicle and antibodies against TMR. J Neurosci Methods 65:157–165. 10.1016/0165-0270(95)00162-x [DOI] [PubMed] [Google Scholar]
- Kirouac GJ. (2015) Placing the paraventricular nucleus of the thalamus within the brain circuits that control behavior. Neurosci Biobehav Rev 56:315–329. 10.1016/j.neubiorev.2015.08.005 [DOI] [PubMed] [Google Scholar]
- Kolaj M, Zhang L, Hermes ML, Renaud LP (2014) Intrinsic properties and neuropharmacology of midline paraventricular thalamic nucleus neurons. Front Behav Neurosci 8:132. 10.3389/fnbeh.2014.00132 [DOI] [PMC free article] [PubMed] [Google Scholar]
- Kolber BJ, Montana MC, Carrasquillo Y, Xu J, Heinemann SF, Muglia LJ, Gereau RW (2010) Activation of metabotropic glutamate receptor 5 in the amygdala modulates pain-like behavior. J Neurosci 30:8203–8213. 10.1523/JNEUROSCI.1216-10.2010 [DOI] [PMC free article] [PubMed] [Google Scholar]
- Krout KE, Loewy AD (2000a) Periaqueductal gray matter projections to midline and intralaminar thalamic nuclei of the rat. J Comp Neurol 424:111–141. [DOI] [PubMed] [Google Scholar]
- Krout KE, Loewy AD (2000b) Parabrachial nucleus projections to midline and intralaminar thalamic nuclei of the rat. J Comp Neurol 428:475–494. [DOI] [PubMed] [Google Scholar]
- Kuramoto E, Furuta T, Nakamura KC, Unzai T, Hioki H, Kaneko T (2009) Two types of thalamocortical projections from the motor thalamic nuclei of the rat: a single neuron-tracing study using viral vectors. Cereb Cortex 19:2065–2077. 10.1093/cercor/bhn231 [DOI] [PubMed] [Google Scholar]
- Li S, Kirouac GJ (2008) Projections from the paraventricular nucleus of the thalamus to the forebrain, with special emphasis on the extended amygdala. J Comp Neurol 506:263–287. 10.1002/cne.21502 [DOI] [PubMed] [Google Scholar]
- Li S, Kirouac GJ (2012) Sources of inputs to the anterior and posterior aspects of the paraventricular nucleus of the thalamus. Brain Struct Funct 217:257–273. 10.1007/s00429-011-0360-7 [DOI] [PubMed] [Google Scholar]
- Li Y, Dong X, Li S, Kirouac GJ (2014) Lesions of the posterior paraventricular nucleus of the thalamus attenuate fear expression. Front Behav Neurosci 8:94. 10.3389/fnbeh.2014.00094 [DOI] [PMC free article] [PubMed] [Google Scholar]
- Li Y, Li S, Wei C, Wang H, Sui N, Kirouac GJ (2010) Orexins in the paraventricular nucleus of the thalamus mediate anxiety-like responses in rats. Psychopharmacology (Berl) 212:251–265. 10.1007/s00213-010-1948-y [DOI] [PubMed] [Google Scholar]
- Liang SH, Yin JB, Sun Y, Bai Y, Zhou KX, Zhao WJ, Wang W, Dong YL, Li YQ (2016) Collateral projections from the lateral parabrachial nucleus to the paraventricular thalamic nucleus and the central amygdaloid nucleus in the rat. Neurosci Lett 629:245–250. 10.1016/j.neulet.2016.07.017 [DOI] [PubMed] [Google Scholar]
- Lu YC, Chen YZ, Wei YY, He XT, Li X, Hu W, Yanagawa Y, Wang W, Wu SX, Dong YL (2015) Neurochemical properties of the synapses between the parabrachial nucleus-derived CGRP-positive axonal terminals and the GABAergic neurons in the lateral capsular division of central nucleus of amygdala. Mol Neurobiol 51:105–118. 10.1007/s12035-014-8713-x [DOI] [PubMed] [Google Scholar]
- McDonald AJ. (1982) Cytoarchitecture of the central amygdaloid nucleus of the rat. J Comp Neurol 208:401–418. 10.1002/cne.902080409 [DOI] [PubMed] [Google Scholar]
- Millan MJ. (2002) Descending control of pain. Prog Neurobiol 66:355–474. 10.1016/s0301-0082(02)00009-6 [DOI] [PubMed] [Google Scholar]
- Moga MM, Weis RP, Moore RY (1995) Efferent projections of the paraventricular thalamic nucleus in the rat. J Comp Neurol 359:221–238. 10.1002/cne.903590204 [DOI] [PubMed] [Google Scholar]
- Nakamura K, Watakabe A, Hioki H, Fujiyama F, Tanaka Y, Yamamori T, Kaneko T (2007) Transiently increased colocalization of vesicular glutamate transporters 1 and 2 at single axon terminals during postnatal development of mouse neocortex: a quantitative analysis with correlation coefficient. Eur J Neurosci 26:3054–3067. 10.1111/j.1460-9568.2007.05868.x [DOI] [PubMed] [Google Scholar]
- Nakao A, Takahashi Y, Nagase M, Ikeda R, Kato F (2012) Role of capsaicin-sensitive C-fiber afferents in neuropathic pain-induced synaptic potentiation in the nociceptive amygdala. Mol Pain 8:51. 10.1186/1744-8069-8-51 [DOI] [PMC free article] [PubMed] [Google Scholar]
- Neugebauer V, Li W (2003) Differential sensitization of amygdala neurons to afferent inputs in a model of arthritic pain. J Neurophysiol 89:716–727. 10.1152/jn.00799.2002 [DOI] [PubMed] [Google Scholar]
- Park HG, Carmel JB (2016) Selective manipulation of neural circuits. Neurotherapeutics: 311–324. 10.1007/s13311-016-0425-7 [DOI] [PMC free article] [PubMed] [Google Scholar]
- Paxinos GC, Watson C (2007) The rat brain in stereotaxic coordinates, Ed 6 San Diego: Elsevier Academic Press. [Google Scholar]
- Pedersen LH, Scheel-Kruger J, Blackburn-Munro G (2007) Amygdala GABA-A receptor involvement in mediating sensory-discriminative and affective-motivational pain responses in a rat model of peripheral nerve injury. Pain 127:17–26. [DOI] [PubMed] [Google Scholar]
- Penzo MA, Robert V, Tucciarone J, De Bundel D, Wang M, Van Aelst L, Darvas M, Parada LF, Palmiter RD, He M, Huang ZJ, Li B (2015) The paraventricular thalamus controls a central amygdala fear circuit. Nature 519:455–459. 10.1038/nature13978 [DOI] [PMC free article] [PubMed] [Google Scholar]
- Polgár E, Gray S, Riddell JS, Todd AJ (2004) Lack of evidence for significant neuronal loss in laminae I-III of the spinal dorsal horn of the rat in the chronic constriction injury model. Pain 111:144–150. 10.1016/j.pain.2004.06.011 [DOI] [PubMed] [Google Scholar]
- Rajasethupathy P, Ferenczi E, Deisseroth K (2016) Targeting neural circuits. Cell 165:524–534. 10.1016/j.cell.2016.03.047 [DOI] [PMC free article] [PubMed] [Google Scholar]
- Ren W, Kiritoshi T, Grégoire S, Ji G, Guerrini R, Calo G, Neugebauer V (2013) Neuropeptide S: a novel regulator of pain-related amygdala plasticity and behaviors. J Neurophysiol 110:1765–1781. 10.1152/jn.00874.2012 [DOI] [PMC free article] [PubMed] [Google Scholar]
- Rizvi TA, Ennis M, Behbehani MM, Shipley MT (1991) Connections between the central nucleus of the amygdala and the midbrain periaqueductal gray: topography and reciprocity. J Comp Neurol 303:121–131. 10.1002/cne.903030111 [DOI] [PubMed] [Google Scholar]
- Swanson LW, Petrovich GD (1998) What is the amygdala? Trends Neurosci 21:323–331. 10.1016/s0166-2236(98)01265-x [DOI] [PubMed] [Google Scholar]
- Tershner SA, Helmstetter FJ (2000) Antinociception produced by mu opioid receptor activation in the amygdala is partly dependent on activation of mu opioid and neurotensin receptors in the ventral periaqueductal gray. Brain Res 865:17–26. 10.1016/s0006-8993(00)02179-x [DOI] [PubMed] [Google Scholar]
- Todd AJ. (2010) Neuronal circuitry for pain processing in the dorsal horn. Nat Rev Neurosci 11:823–836. 10.1038/nrn2947 [DOI] [PMC free article] [PubMed] [Google Scholar]
- Tovote P, Esposito MS, Botta P, Chaudun F, Fadok JP, Markovic M, Wolff SB, Ramakrishnan C, Fenno L, Deisseroth K, Herry C, Arber S, Lüthi A (2016) Midbrain circuits for defensive behaviour. Nature 534:206–212. 10.1038/nature17996 [DOI] [PubMed] [Google Scholar]
- Vertes RP, Hoover WB (2008) Projections of the paraventricular and paratenial nuclei of the dorsal midline thalamus in the rat. J Comp Neurol 508:212–237. 10.1002/cne.21679 [DOI] [PubMed] [Google Scholar]
- Watakabe A, Ohsawa S, Hashikawa T, Yamamori T (2006) Binding and complementary expression patterns of semaphorin 3E and plexin D1 in the mature neocortices of mice and monkeys. J Comp Neurol 499:258–273. 10.1002/cne.21106 [DOI] [PubMed] [Google Scholar]
- Whissell PD, Tohyama S, Martin LJ (2016) The use of DREADDs to deconstruct behavior. Front Genet 7:70. 10.3389/fgene.2016.00070 [DOI] [PMC free article] [PubMed] [Google Scholar]
- Wickersham IR, Lyon DC, Barnard RJ, Mori T, Finke S, Conzelmann KK, Young JA, Callaway EM (2007) Monosynaptic restriction of transsynaptic tracing from single, genetically targeted neurons. Neuron 53:639–647. 10.1016/j.neuron.2007.01.033 [DOI] [PMC free article] [PubMed] [Google Scholar]
- You HJ, Lei J, Niu N, Yang L, Fan XL, Tjølsen A, Li Q (2013) Specific thalamic nuclei function as novel 'nociceptive discriminators' in the endogenous control of nociception in rats. Neuroscience 232:53–63. 10.1016/j.neuroscience.2012.12.021 [DOI] [PubMed] [Google Scholar]
- Zimmermann M. (1983) Ethical guidelines for investigations of experimental pain in conscious animals. Pain 16:109–110. 10.1016/0304-3959(83)90201-4 [DOI] [PubMed] [Google Scholar]