

Abstract
Topological polar surface area (TPSA), which makes use of functional group contributions based on a large database of structures, is a convenient measure of the polar surface area that avoids the need to calculate ligand 3D structure or to decide which is the relevant biological conformation or conformations. We demonstrate the utility of TPSA in 2D-QSAR for 14 sets of diverse pharmacological activity data. Even though a large pool of reports showing the importance of the classic 2D descriptors such as calculated logP (ClogP) and calculated molar refractivity (CMR) exists in the 2D-QSAR literature, this is the first report to demonstrate the value of TPSA as a relevant descriptor applicable to a large, structurally and pharmacologically diverse set of classes of compounds. We also address the limitations of applicability of this descriptor for 2D-QSAR analysis. We observed a negative correlation of TPSA with activity data for anticancer alkaloids, MT1 and MT2 agonists, MAO-B and tumor necrosis factor-α inhibitors and a positive correlation with inhibitory activity data for telomerase, PDE-5, GSK-3, DNA-PK, aromatase, malaria, trypanosomatids and CB2 agonists.
Keywords: Antitumor agents, Structure-activity relationships, 2D-QSAR, GSK-3, Topological polar surface area (TPSA), Antimalarial agents, ClogP, CMR
Introduction
Polar surface area (PSA) has been a widely used molecular descriptor in the study of drug transport properties such as intestinal absorption [1] and blood-brain barrier (BBB) penetration. [2] It is the sum of the contributions to the molecular (usually van der Waals) surface area of polar atoms such as oxygen, nitrogen and their attached hydrogens. Calculation of PSA is complicated by the need to decide on and then to calculate accurately the appropriate 3D molecular geometry or ensemble of geometries for each molecule being studied [3]. In order to overcome this trouble, Ertl et al. [4] developed a very fast additive fragment method of calculating PSA especially for rapid virtual bioavailability screening of a very large collection of molecules. Since the first report of this topological polar surface area (TPSA), it has become extremely popular in medicinal chemistry for virtual screening [5–8] and for predicting ADME properties, including blood-brain barrier crossing tendency [9–18]. Recently, Ertl reviewed the use of polar surface area in medicinal chemistry research [19]. Since its publication, the main use of TPSA in medicinal chemistry has been for barrier crossing ADME predictions (the original concern of Ertl et al.) [4].
There have been very few reports on the use of TPSA as a descriptor for Hansch 2D-QSAR despite its great potential to encapsulate conveniently key aspects of a ligand molecule’s relative propensity for polar interactions with a specific target. Hansch 2D-QSAR is an effective way to study drug-receptor interactions, especially when the target structure is unknown [20, 21]. The published reports to date of use of TPSA in Hansch 2D-QSAR models of specific inhibition of receptors have been limited to studies of HERG potassium channel inhibition [22] and selective COX-2 inhibition [23, 24]. Some multiple linear-regression analyses (MLRA) for QSPR studies have appeared which make use of TPSA as a descriptor of blood-brain barrier crossing ability, [25, 26] aqueous solubility, [27] and toxicity [28, 29]. The few other QSAR studies which make use of TPSA do not use Hansch 2D-QSAR [30, 31]. In previous MLRA models employing TPSA (all of which used the unscaled TPSA), the coefficient C for TPSA in the reported models had an absolute value 0.01 < C < 0.05 and was positive for COX-2 inhibition, [23, 24] and toxicity [28] and negative for HERG channel inhibition [22] and BBB crossing [25, 26].
In the present effort, our objective was to use this simple 2D topological property as a QSAR descriptor in exploring the polar interactions for a wide range of biological targets and ligands. We report on statistically significant models for biological activity against many important targets including glycogen synthase kinase-3 (GSK-3), DNA-dependent protein kinase (DNA-PK), phosphodiesterase-5 (PDE-5), telomerase, monoamino oxidase-B (MAO-B), aromatase, melatonin MT1 and MT2 and cannabinoid CB2 receptors. Naturally a single descriptor is not usually sufficient in QSAR, so in some models we also study the influence of various physicochemical properties such as hydrophobic, electronic, steric and structural properties. Note that we also tried other data sets in which TPSA did not get selected as an important descriptor or the resulting model had r2 < 0.5.
Computational Methods
In general for any QSAR and QSPR modeling, ample statistical methods like linear regression, partial least squares, k-nearest neighbor, neural networks, genetic function approximations are available.[32] But we chose to use the conventional multiple regression analysis for this work due to its ease of interpretability and handiness to derive mechanistic information about the various drugs acting on several targets we considered. Also, multiple linear regression is the most commonly used technique for the Hansch type of QSAR we attempted in this work, especially when the size of the data sets is small.[33] TPSA was calculated using the “interactive calculation of molecular polar surface area” module from Daylight (www.daylight.com), in which the additive group contributions of Ertl et al. [4] have been implemented. Other than TPSA, we used two types of standard descriptors: indicator variables and physicochemical constants. An indicator variable designated as I with a relevant subscript was set to 1 if a particular substituent or chemical feature is present and to 0 if absent. Physicochemical constants—hydrophobic (π); electronic (σ), including resonance effect (R) or field/inductive effect (f); molar refractivity (MR); and hydrogen bond donor (HDR) or acceptor (HAR)—were taken from the literature [21, 34]. The substituent hydrophobicity constant (π) which we used from the literature is in fact measured experimentally. The hydrophobicity constant (πX) for any substituent X is calculated according to the equation, πX = logPX − logPH, where PX and PH are the partition coefficients of the reference compound with and without substituent respectively. The Hammett electronic parameter (σ) is calculated based on the influence of substituent X on the ionization of benzoic acid. The molar refractivity (MR) is a measure of the volume occupied by an atom or group of atoms and is calculated using the Lorenz-Lorentz equation. A correlation matrix was used to correlate the biological activity with TPSA and structural predictor variables. Descriptors with inter-correlation |r| > 0.6 were not included in the same QSAR model. Predictor variables with p > 0.05 were eliminated whilst deriving the QSAR models, in order to assure statistical reliability. Linear regression analysis was performed using Systat Version 11. The residuals for each model were checked to ensure an approximately normal distribution. The Student’s t-distribution was used to assess the significance of individual regression terms. Forward stepping regression was used to build the QSAR models, and in each of the models in which TPSA it is there because it was selected as an optimal descriptor by this automated procedure. This method initially generates a QSAR model containing only one variable, which is chosen to be the one with the highest t-statistic, and subsequent variables are added based on their relative importance, also as determined by t-statistics. The QSAR models were evaluated using standard statistical parameters including the correlation coefficient (r), coefficient of determination (r2), standard error of estimate (s) and Fischer F-value. The exact formulae used for the calculation of these statistical parameters are given in the Supporting Information. The figures within the parentheses following the coefficient terms are the standard error of regression terms and constants. The Durbin-Watson (DW) test, using 1% significance level, was employed to check the serial correlation in residuals.[35] For two models, DW is in the range in which it is not suitable for determining whether there is serial autocorrelation in the residuals. For Model 2 (calculated DW = 3.09; tabulated QL = 0.66 and QU = 1.24, so that 4 − QL = 3.34 and 4 − QU = 2.76), DW falls between 4 − QL and 4 − QU, so the DW statistic cannot be used to prove that there is no negative autocorrelation in the residuals. For Model 7 (calculated DW = 1.15; tabulated QL = 0.83 and QU = 1.26), DW falls between QL and QU, so the DW statistic cannot be used to prove that there is no positive autocorrelation in the residuals. But in neither Model 2 nor 7 does DW indicate the presence of serial autocorrelation (which would hold only if DW > 4 − QL or DW < QL). For all the other models, QL < DW < 4 −QL, indicating no serial autocorrelation.
A data point was considered as an outlier if its residual value exceeded twice the standard error of estimate of the model. Self-consistency of the derived models was verified using the leave-one-out (loo) process and the predictability of each model was assessed using cross-validated r2, called q2. The best measure of reliability of a Hansch 2D-QSAR model is a high q2, not just a high r2 which could be a result of over-fitting to data. In general a value of q2 > 0.5 is considered acceptable.[36, 37] In our regression models, prepared using forward-stepping, we did not exceed the ratio of 1:5 for descriptors:compounds, and hence the models are not over-fitted. Since the selection of individual descriptors was based on a Student’s t-statistical test, the resulting models are robust and do not need any further cross-validations such as jack-knifing or Y-randomization which are appropriate for models prepared for large datasets with a much greater number of descriptors in a given model.[38] For each data set, compounds are numbered in order of appearance in the original paper; those without well-defined activity are left out.
Results and Discussion
Table 1 gives an overview of all the QSAR models in this report. The observed, converted and predicted activity and values of TPSA and other descriptors used in the QSAR models are given in the subsequent tables.
Table 1.
Summary of QSAR models in this report, including information on the target (main disease target, activity target), ligands (chemical class, range of values in the log activity data, number of ligands) and the model details (number of outliers, number of descriptors, number of unique values for TPSA for that data set, TPSA regression coefficient, r2 and q2).
| QSAR Model | Disease | Activity Target | Ligand Structure | Activity Range | Ligands | Outliers | Descriptors | TPSA Variability | TPSA Coeff. | r2 | q2 |
|---|---|---|---|---|---|---|---|---|---|---|---|
| 1 | cancer | telomerase | flavonoid | 2.6 | 13 | 0 | 2 | 7 | 0.028 | 0.85 | 0.76 |
| 2 | cancer | aromatase | isoflavone | 0.84 | 15 | 1 | 2 | 4 | 0.007 | 0.89 | 0.81 |
| 3 | cancer | DNA | pyridoacridine alkaloid | 3 | 17 | 0 | 3 | 6 | −0.061 | 0.70 | 0.36 |
| 4 | cancer | DNA | naphthocarbazole | 3.95 | 15 | 2 | 2 | 8 | −0.013 | 0.75 | 0.57 |
| 5 | cancer | DNA-PK | Pyran(and thiopyran)-4-one | 0.78 | 14 | 2 | 2 | 5 | 0.010 | 0.80 | 0.69 |
| 6 | Alzheimer’s/diabetes | GSK-3 | maleimide | 2.06 | 67 | 1 | 5 | 9+ | 0.008 | 0.85 | 0.83 |
| 7 | Alzheimer’s/diabetes | GSK-3 | fused pyrazolo pyridines | 3.3 | 19 | 0 | 2 | 8 | 0.076 | 0.67 | 0.56 |
| 8 | Malaria | PfDHFR | pyrimethamine derivatives | 1.4 | 13 | 1 | 2 | 5 | 0.028 | 0.67 | 0.50 |
| 9 | trypanosomatids | substrates for P2 transporter | melamine-based nitroheterocycle | 4.24 | 12 | 2 | 2 | 10 | 0.051 | 0.83 | 0.72 |
| 10a | autoimmune inflammation | TNF-α | coumarin | 2.17 | 18 | 2 | 3 | 9 | 0.015 | 0.86 | 0.76 |
| 10b | autoimmune inflammation | TNF-α | coumarin | 2.17 | 12 | 2 | 2 | 9 | −0.021 | 0.83 | 0.68 |
| 11 | Alzheimer’s | ACE/MAO-B | coumarin | 2.69 | 17 | 1 | 2 | 4 | −0.030 | 0.88 | 0.73 |
| 12a | sleep | MT1 | fluoren-9-ylethyl amides | 2.26 | 12 | 0 | 2 | 2 | −0.120 | 0.70 | 0.48 |
| 12b | sleep | MT1 | fluoren-9-ylethyl amides | 2.26 | 12 | 2 | 3 | 2 | −0.122 | 0.95 | 0.88 |
| 12c | sleep | MT2 | fluoren-9-ylethyl amides | 2.26 | 12 | 2 | 3 | 2 | −0.044 | 0.93 | 0.76 |
| 13 | autoimmune disorder | cannabinoid-2 | triaryl bis-sulfone | 3.01 | 37 | 0 | 4 | 14 | 0.037 | 0.73 | 0.65 |
| 14 | erectile dysfunction | PDE5 | xanthine | 2.5 | 19 | 1 | 3 | 3 | 0.031 | 0.70 | 0.50 |
1. Telomerase inhibiting flavonoids
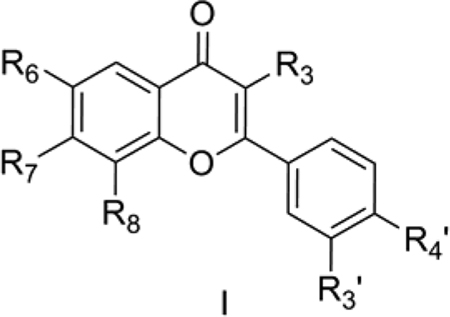
Menichincheri et al. [39] reported catecholic flavonoids (I) as telomerase inhibitors. We considered 13 of the flavonoids with well-defined biological activity for the present analysis. The catecholic flavonoids were reported to interact with telomerase. However there is a complete lack of detailed structural information about this ideal anticancer target. The different mechanisms of action of telomerase and its role in cancer chemotherapy have been recently reviewed by Calcagnile and Gisselsson [40]. Flavonoids have been considered in recent years as promising ligands for their use in cancer prevention and therapy [39].
QSAR Model 1:
pIC50 = 0.028 (±0.007) TPSA + 0.819 (±0.219) IR4OH + 2.194 (±0.679)
n = 13, r = 0.920, r2 = 0.847, s = 0.350, F = 27.72, p = 0.000, q2 = 0.756, DW = 2.08
Model 1 (Table 2) explains 84.7% of the variance in the observed activity. The predictive ability of the QSAR model is also good as measured by its cross-validated q2 = 0.76. The positive contribution of TPSA in the above model shows the importance of molecular interactions of polar groups like O- and N-centered fragments of catecholic flavonoids with the active site of telomerase enzyme. The indicator variable IR4OH was assigned a value of 1 when there is a -OH group at the R4 position of the benzopyran nucleus and 0 otherwise. We also considered other analogously defined indicator variables in the analysis including IR4OCH3, IR4NH2, IR3OH, IR3NH2, IR8OH, IR7OH and IR7OCH3, but they were not selected as most significant with the forward-stepping algorithm. The positive correlation of IR4OH suggests that a hydroxyl group at R4 of the benzopyran scaffold is conducive to telomerase inhibition.
Table 2.
Observed, converted and predicted Telomerase inhibitory activity, TPSA and structural indicator variable used for QSAR Model 1.
| Comp. No. | Observed Activity[a] | Converted Activity[b] | TPSA | IR4OH | Predicted Activity[b,c] |
|---|---|---|---|---|---|
| 1 | 0.2 | 6.70 | 111.13 | 1 | 6.02 |
| 2 | 3 | 5.52 | 90.90 | 1 | 5.57 |
| 3 | 36 | 4.44 | 70.67 | 0 | 3.98 |
| 4 | 50 | 4.30 | 90.90 | 0 | 4.83 |
| 5 | 11.7 | 4.93 | 89.13 | 0 | 4.63 |
| 6 | 11 | 4.96 | 100.13 | 0 | 5.00 |
| 7 | 7.8 | 5.11 | 100.13 | 1 | 5.97 |
| 8 | 0.82 | 6.09 | 111.13 | 1 | 6.12 |
| 9 | 0.6 | 6.22 | 111.13 | 1 | 6.10 |
| 10 | 0.8 | 6.10 | 111.13 | 1 | 6.12 |
| 11 | 0.13 | 6.89 | 134.92 | 1 | 6.72 |
| 12 | 7.4 | 5.13 | 100.71 | 0 | 4.98 |
| 13 | 3.6 | 5.44 | 122.71 | 0 | 5.77 |
IC50 (μM);
pIC50 (M);
Leave-one-out
2. Aromatase inhibiting isoflavones
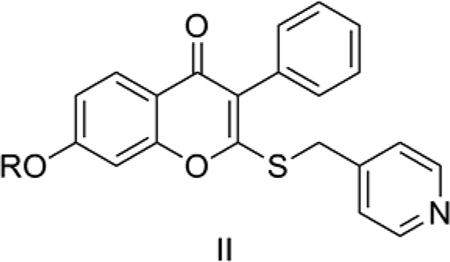
Su et al. [41] reported some isoflavones (II) as aromatase inhibitors. Aromatase, included in the cytochrome P450 superfamily, catalyzes the rate limiting step in estrogen biosynthesis. It is a validated target for the treatment of hormone-dependent breast cancer. We considered the reported aromatase inhibitory activity on human placental microsomes of 2-(4’-pyridylmethyl)thio, 7-alkyl- or aryl-substituted isoflavones reported by Su et al. [41]
QSAR Model 2:
pIC50 = 0.007 (±0.001) TPSA + 0.320 (±0.036) CMR + 1.770 (±0.540)
n = 14, r = 0.942, r2 = 0.888, s = 0.094, F = 43.47, p = 0.000, q2 = 0.807, DW = 3.09
Model 2 (Table 3) explains 88.8% of the variance in the observed activity. The predictive ability of the QSAR model is very good as measured by its cross-validated q2 = 0.81. TPSA shows a positive correlation with the aromatase inhibitory activity of the isoflavones. This is due to the favorable effect of nitro groups (in 2, 3 and 4), irrespective of their positions ortho, meta or para to the 7-benzyloxy functionality, which in fact resulted in 2-fold enhancement in activity as observed by Su et al. [41] 2, 3 and 4 had the highest TPSA (98.15) among the isoflavones we considered, whereas the lead compound 1 had the lowest TPSA (52.33). The above QSAR Model 2 was obtained after removing 1 as an outlier. 1 is the lead compound with R = 7-benzyl in the general structure shown above (II). The positive contribution of CMR shows that bulkier substituents are favorable for the activity. The most active compound 14 (IC50 = 79 nM), a bulky biphenyl analog, had the highest CMR (15.88) of any in the series. 14 was found to be active both in the placental microsome assay as well as in a SK-BR-3 breast cancer cell line assay [41]. Our observations are consistent with SAR data by Su et al., [41] which suggests the necessity of a bulky hydrophobic group at the 7-position to aid passage through the cell membrane in order to be able to inhibit aromatase activity.
Table 3.
Observed, converted and predicted Aromatase inhibitory activity, TPSA and CMR used for QSAR Model 2.
| Comp. No. | Observed Activity[a] | Converted Activity[b] | TPSA | CMR | Predicted Activity[b,c] |
|---|---|---|---|---|---|
| 1 | 210 | 6.68 | 52.33 | 13.37 | - |
| 2 | 138 | 6.86 | 98.15 | 13.98 | 6.92 |
| 3 | 113 | 6.95 | 98.15 | 13.98 | 6.88 |
| 4 | 132 | 6.88 | 98.15 | 13.98 | 6.91 |
| 5 | 112 | 6.95 | 52.33 | 15.06 | 6.93 |
| 6 | 90 | 7.05 | 52.33 | 15.06 | 6.91 |
| 7 | 359 | 6.44 | 52.33 | 13.84 | 6.56 |
| 8 | 243 | 6.61 | 61.56 | 13.99 | 6.66 |
| 9 | 161 | 6.79 | 61.56 | 13.99 | 6.65 |
| 10 | 553 | 6.26 | 52.33 | 13.47 | 6.47 |
| 11 | 337 | 6.47 | 52.33 | 13.39 | 6.38 |
| 12 | 213 | 6.67 | 52.33 | 14.15 | 6.64 |
| 13 | 233 | 6.63 | 52.33 | 13.86 | 6.54 |
| 14 | 79 | 7.10 | 52.33 | 15.88 | 7.30 |
| 15 | 378 | 6.42 | 65.22 | 13.16 | 6.41 |
IC50 (nM);
pIC50 (M);
Leave-one-out
3. Antitumor marine pyridoacridines alkaloids
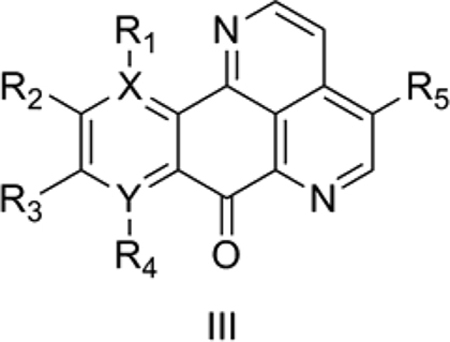
Delfourne et al. [42] reported pyrido[4,3,2-de][1,7] or [1,10]-phenanthrolin-7-ones of the marine pyridoacridine alkaloids class as potential antitumor agents. The common scaffold investigated by Delfourne et al., [42] which includes the common moiety of the two marine pyridoacridine alkaloids ascididemin and meridine, is shown below (III). More than 50 pyridoacridine alkaloids with diverse biological activity are known to date. For our QSAR analysis, we used IC50 data for reduction in growth of the human cancer U-87MG cell line from Delfourne et al. [42].
QSAR Model 3:
pIC50(U-87MG) = −0.061 (±0.023) TPSA + 1.447 (±0.312) IR5OCH3 + 1.451 (±0.368) IR1OCH3 + 9.236 (±1.465)
n = 17, r = 0.839, r2 = 0.704, s = 0.521, F = 10.29, p = 0.001, q2 = 0.359, DW = 2.21
Model 3 (Table S1) explains 70.4% of the variance in the observed activity but has a relatively poor predictive value as indicated by q2 < 0.4. The model shows a negative correlation of TPSA with activity. The highest TPSA of 75.97 was for 6, which differs from 15 (which is 1000 times more active than 6) in lacking a OCH3 group and in having an OH instead of another OCH3. Since 15 also has a relatively high TPSA, it is an exception to the negative correlation of TPSA with activity. The predicted activity of Model 3 for 6 and 15 are each off by nearly one log unit, but the model fits the remaining compounds well. The indicator variables IR5OCH3 and IR1OCH3 were given a value of 1 for compounds with a methoxyl group at R5 and R1, respectively, and 0 otherwise. A positive correlation of these two indicator variables suggests a favorable effect of methoxyl groups at the R5 and R1 positions for antitumor activity, as found in 15.
4. Anticancer Naphthocarbazoles
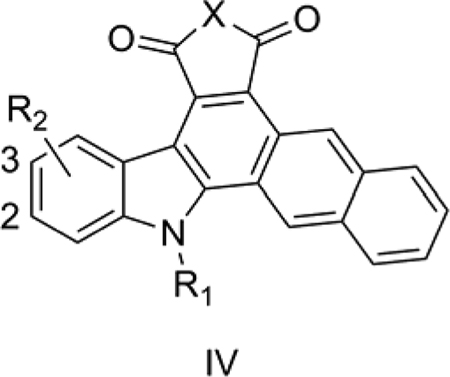
Routier et al. [43] reported some naphthocarbazoles (IV) with significant cytotoxic properties toward cancer cells. IV is one of the modified structures obtained from the indolocarbazole skeleton found in indolo[2,3-α]pyrrolo[3,4-c]carbazole alkaloids, some of which have been found to have significant antitumor, antiviral and antimicrobial activity. The most active compound of the series, 15, has a glycerol-like side chain together with an indolic hydroxyl group at the 2-position of IV. Routier et al. [43] proposed that binding of IV to DNA leads to the antiproliferative activity. IV failed to show any significant activity against CDK-5, GSK-3β or topoisomerases (IC50 > 10 μM). We used the reported in vitro antiproliferative activity (IC50) against a human prostate cancer cell line (DU145) for the present QSAR analysis. [43]
QSAR Model 4:
pIC50(DU145) = −0.013 (±0.005) TPSA −1.123 (±0.206) IXNCH3 + 7.435 (±0.435)
n = 13, r = 0.865, r2 = 0.748, s = 0.308, F = 14.86, p = 0.001, q2 = 0.570, DW = 2.34
Model 4 (Table 4) explains 74.8% of the variance in the observed activity. QSAR Model 4 was obtained after removing 15 and 3 as outliers; since these are the most active and inactive compounds, respectively, their removal limits the value of Model 4. In fact, a simple plot of TPSA vs. log activity shows a positive correlation if these outliers are retained. But once the outliers are removed, Model 4 shows that TPSA is negatively correlated with the anticancer activity of these congeners. The negative contribution of the indicator variable IXNCH3 suggests that NCH3 substitution is not favorable for the activity. This is consistent with the SAR observation of Routier et al. [43] that N-hydrophilic substitution increases the cytotoxicity compared to NCH3.
Table 4.
Observed, converted and predicted activity of DNA binding naphthocarbazoles, TPSA and structural variable used in QSAR Model 4.
| Comp. No. | Observed Activity[a] | Converted Activity[b] | TPSA | IXNCH3 | Predicted Activity[b,c] |
|---|---|---|---|---|---|
| 1 | 1.1 | 5.96 | 44.00 | 1 | 5.66 |
| 2 | 4.7 | 5.33 | 47.24 | 1 | 5.86 |
| 3 | 59.7 | 4.22 | 44.00 | 1 | - |
| 4 | 2.31 | 5.64 | 84.46 | 1 | 5.08 |
| 5 | 0.290 | 6.54 | 58.10 | 0 | 6.78 |
| 6 | 6.8 | 5.17 | 75.09 | 1 | 5.42 |
| 7 | 4.7 | 5.33 | 75.09 | 1 | 5.37 |
| 8 | 0.108 | 6.97 | 78.33 | 0 | 6.35 |
| 9 | 0.25 | 6.60 | 78.33 | 0 | 6.42 |
| 10 | 0.29 | 6.54 | 78.33 | 0 | 6.43 |
| 11 | 0.76 | 6.12 | 78.33 | 0 | 6.50 |
| 12 | 0.63 | 6.20 | 107.33 | 0 | 6.04 |
| 13 | 1.11 | 5.95 | 107.35 | 0 | 6.11 |
| 14 | 2.13 | 5.67 | 115.55 | 0 | 6.11 |
| 15 | 0.0068 | 8.17 | 115.55 | 0 | - |
IC50 (μM);
pIC50 (M);
Leave-one-out
5. DNA-PK inhibiting monocyclic pyran and thiopyran-4-ones
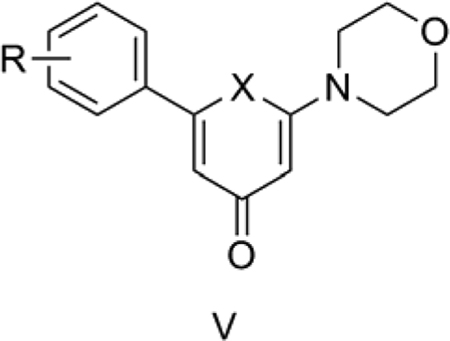
Hollick et al. [44] reported 6-aryl-2-morpholin-4-yl-4H-pyran (and thiopyran)-4-ones (V) as inhibitors of DNA-PK (protein kinase). DNA-PK is a DNA repair enzyme that is differentially expressed in normal and tumor cells. It is also an important component of the double strand break repair machinery of DNA. It is a serine/threonine kinase and a member of the phosphatidylinositol 3-kinase-related kinase (PIKK) family. Chromenone LY294002 [45] and NU7441 [46] are known DNA-PK inhibitors with IC50 = 1.4 and 0.23 μM respectively. Such inhibitors have the potential to be used in conjunction with radiation and other chemotherapy in the treatment of cancer.
QSAR Model 5:
pIC50 = 0.010 (±0.003) TPSA + 0.284 (±0.075) I4OCH3 + 5.856 (±0.120)
n = 12, r = 0.896, r2 = 0.803, s = 0.092, F = 18.29, p = 0.001, q2 = 0.689, DW = 1.88
QSAR Model 5 (Table 5) explains 80.3% of the variance in the observed activity. Model 5 was obtained upon eliminating 1 and 5 as outliers. Both the TPSA and I4OCH3, an indicator variable for a methoxy R substitution at the para position of the 6-aryl ring of the pyran-4-one or thiopyran-4-one scaffold, are positively correlated to the activity. The two descriptors are not collinear but in fact are orthogonal, with intercorrelation of only r = 0.30. I4OCH3 accounts only for the presence of 4-methoxyl at R, whereas the TPSA takes into account other polar atoms such as the oxygen in the pyran-4-one ring and other methoxy groups at ortho and meta positions. The positive coefficient for the TPSA term in Model 5 indicates that the pyran-4-one scaffold could yield more potent analogs than thiopyran-4-ones to inhibit DNA-PK. Hollick et al., [47] in a recent report, proposed, based on a homology model developed based on PI 3-kinase, that pyran-4-ones interact with the DNA-PK active site through the morpholine and carbonyl groups. This helps to demonstrate why the TPSA of these congeners is positively correlated to DNA-PK inhibitory activity as found in our QSAR model.
Table 5.
Observed, converted and predicted DNA-PK inhibitory activity, TPSA and indicator variable used in QSAR Model 5.
| Comp. No. | Observed Activity[a] | Converted Activity[b] | TPSA | I40CH3 | Predicted Activity[b,c] |
|---|---|---|---|---|---|
| 1 | 1.10 | 5.96 | 42.68 | 0 | - |
| 2 | 0.53 | 6.28 | 42.68 | 0 | 6.30 |
| 3 | 0.35 | 6.46 | 42.68 | 0 | 6.27 |
| 4 | 0.18 | 6.74 | 42.68 | 0 | 6.37 |
| 5 | 0.38 | 6.42 | 51.91 | 0 | - |
| 6 | 0.54 | 6.27 | 51.91 | 0 | 6.45 |
| 7 | 0.22 | 6.66 | 51.91 | 1 | 6.69 |
| 8 | 0.48 | 6.32 | 42.68 | 0 | 6.29 |
| 9 | 0.72 | 6.14 | 29.54 | 0 | 6.16 |
| 10 | 0.53 | 6.28 | 29.54 | 0 | 6.13 |
| 11 | 0.28 | 6.55 | 38.77 | 1 | 6.52 |
| 12 | 0.92 | 6.04 | 29.54 | 0 | 6.19 |
| 13 | 0.80 | 6.10 | 29.54 | 0 | 6.17 |
| 14 | 0.68 | 6.17 | 29.54 | 0 | 6.16 |
IC50 (μM);
pIC50 (M);
Leave-one-out
6. GSK-3α inhibiting maleimides
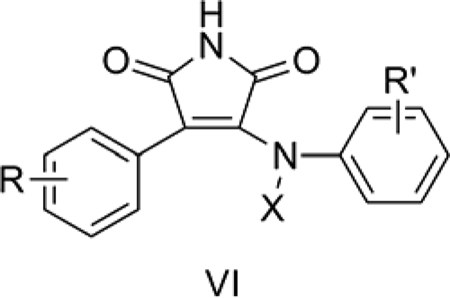
GSK-3 is a serine-threonine kinase which phosphorylates glycogen synthase, the rate-limiting enzyme in glycogen biosynthesis. GSK-3 is an attractive target for various diseases including Alzheimer’s, bipolar disorder, diabetes, cancer and malaria. Even though the α and β isoforms are 97% identical with respect to their kinase domain, studies performed by Phiel et al. [48] showed that selective reduction of α and β form leads to a decrease and increase in Aβ40 and Aβ42 (the primary constituents of the amyloid plaques in Alzheimer’s disease), respectively. We previously investigated 4-arylmaleimide derivatives from Smith et al. (VI) [49]. In the present report, we demonstrate the use of TPSA for QSAR of 67 of the Smith et al. arylmaleimides (VI). The TPSA calculation for a representative maleimide compound is given in Fig. (1).
Figure 1.
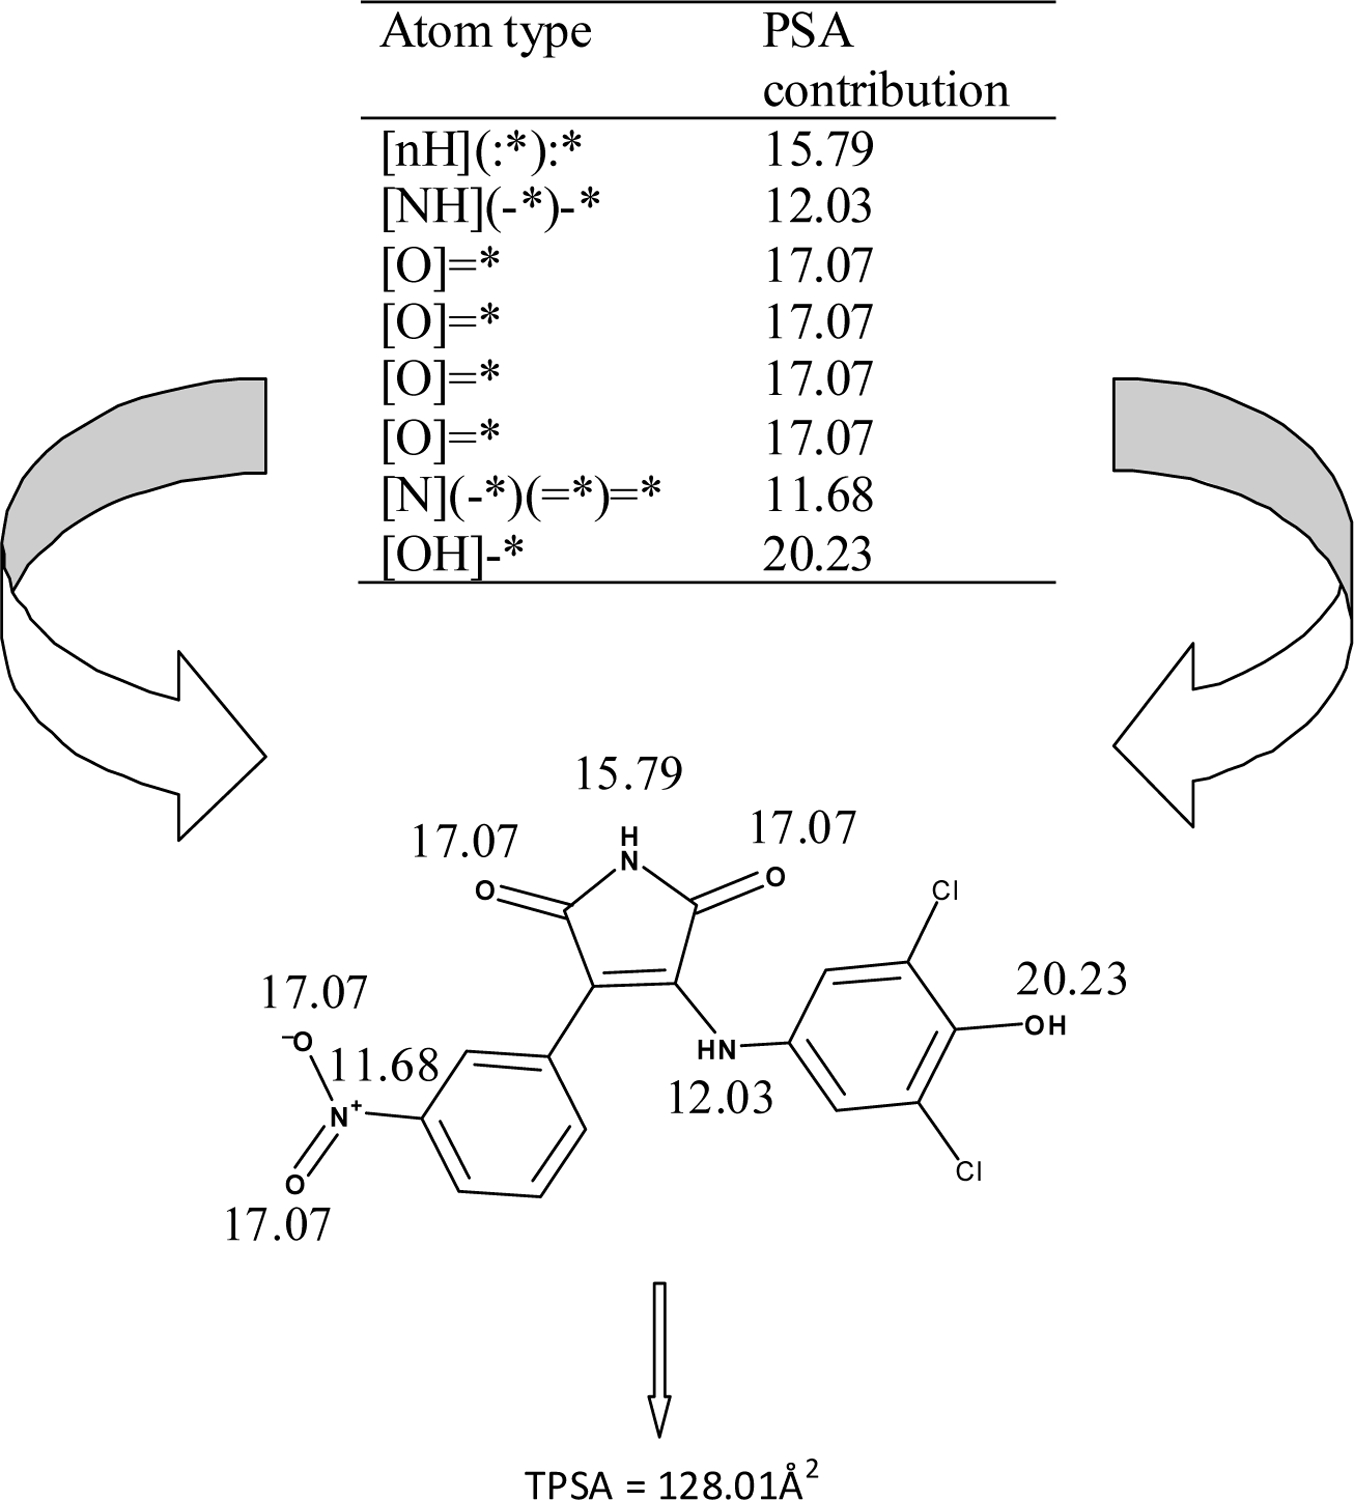
Schematic representation of calculation of TPSA. The most active compound from ref 43, 38 (IC50 = 20 nM towards GSK-3α), is shown. The atomic/group contributions derived from Ertl et al. (ref. 4) of the polar atoms are shown, summation of which resulted in TPSA of 128.01 Å2.
QSAR Model 6:
pIC50 = 0.008 (±0.001) TPSA + 0.442 (±0.071) IR1=4Cl − 0.779 (±0.099) IXCH3 + 0.306 (±0.032) πmR′ − 0.290 (±0.113) σpR + 5.960 (±0.084)
n = 66, r = 0.923, r2 = 0.852, s = 0.162, F = 69.23, p = 0.000, q2 = 0.826, DW = 2.10
Model 6 (Table 6) explains 85.2% of the variance in the observed activity. Model 6 was obtained after removing 19 as an outlier. TPSA shows a positive correlation with activity, demonstrating the importance of the molecular interaction of the polar O and N centered fragments (-OCH3 and -NO2) of the 4-phenyl ring (R) and the -OH, -COOH groups of the anilino ring (R’) with the active site residues of the GSK-3α enzyme. Notably, in our recently published 2D-QSAR analysis using classical Hansch and Fujita-Ban methods for the 3-anilino and 3-N-methyl anilino compounds [50] we also obtained a positive contribution of the 2D descriptor HAR which accounts for the presence of hydrogen bond acceptors at R of VI. The positive correlation of the indicator variable IR1=4Cl shows that 4-chloro substitution on the anilino ring is favorable for GSK-3 inhibitory activity. The negative contribution of the other indicator variable, IXCH3, indicates that 3-N-methyl anilino derivatives are detrimental for GSK-3 inhibitory activity. The positive coefficient of πmR′ shows that having more-hydrophobic substituents on the anilino ring is favorable for GSK-3α inhibitory activity. The negative contribution of σpR indicates that having an electron-donating group on the 4-phenyl ring is crucial for GSK-3 inhibitory activity. 19 was also an outlier in our previously published 2D-QSAR report [50].
Table 6.
Observed, converted and predicted GSK-3α inhibitory activity, TPSA and aromatic constants used for QSAR Model 6.
| Comp. No. | R | R1 | X | Observed Activity[a] | Converted Activity[b] | Predicted Activity[b,c] | TPSA | IR1=4Cl | IXCH3 | πmR’ | σpR |
|---|---|---|---|---|---|---|---|---|---|---|---|
| 1 | H | H | H | 529 | 6.28 | 6.45 | 61.96 | 0 | 0 | 0 | 0 |
| 2 | 2-Cl | H | H | 216 | 6.67 | 6.43 | 61.96 | 0 | 0 | 0 | 0 |
| 3 | 2-OCH3 | H | H | 216 | 6.67 | 6.51 | 71.19 | 0 | 0 | 0 | 0 |
| 4 | 3-NO2 | H | H | 141 | 6.85 | 6.80 | 107.78 | 0 | 0 | 0 | 0 |
| 5 | 4-Cl | H | H | 514 | 6.29 | 6.38 | 61.96 | 0 | 0 | 0 | 0.23 |
| 6 | 4-OCH3 | H | H | 390 | 6.41 | 6.61 | 71.19 | 0 | 0 | 0 | −0.27 |
| 7 | H | 3-Cl | H | 301 | 6.52 | 6.67 | 61.96 | 0 | 0 | 0.71 | 0 |
| 8 | 2-Cl | 3-Cl | H | 195 | 6.71 | 6.66 | 61.96 | 0 | 0 | 0.71 | 0 |
| 9 | 2-OCH3 | 3-Cl | H | 114 | 6.94 | 6.72 | 71.19 | 0 | 0 | 0.71 | 0 |
| 10 | 2-NO2 | 3-Cl | H | 104 | 6.98 | 7.02 | 107.78 | 0 | 0 | 0.71 | 0 |
| 11 | 3-OCH3 | 3-Cl | H | 257 | 6.59 | 6.74 | 71.19 | 0 | 0 | 0.71 | 0 |
| 12 | 3-NO2 | 3-Cl | H | 70 | 7.15 | 7.01 | 107.78 | 0 | 0 | 0.71 | 0 |
| 13 | 4-Cl | 3-Cl | H | 447 | 6.35 | 6.61 | 61.96 | 0 | 0 | 0.71 | 0.23 |
| 14 | 4-OCH3 | 3-Cl | H | 156 | 6.81 | 6.81 | 71.19 | 0 | 0 | 0.71 | −0.27 |
| 15 | H | 3-OH | H | 704 | 6.15 | 6.41 | 82.19 | 0 | 0 | −0.67 | 0 |
| 16 | 2-Cl | 3-OH | H | 374 | 6.43 | 6.39 | 82.19 | 0 | 0 | −0.67 | 0 |
| 17 | 2-OCH3 | 3-OH | H | 259 | 6.59 | 6.46 | 91.42 | 0 | 0 | −0.67 | 0 |
| 18 | 2-NO2 | 3-OH | H | 251 | 6.60 | 6.77 | 128.01 | 0 | 0 | −0.67 | 0 |
| 19 | 3-Cl | 3-OH | H | 1478 | 5.83 | - | 82.19 | 0 | 0 | −0.67 | 0 |
| 20 | 3-OCH3 | 3-OH | H | 472 | 6.33 | 6.48 | 91.42 | 0 | 0 | −0.67 | 0 |
| 21 | 3-NO2 | 3-OH | H | 236 | 6.63 | 6.77 | 128.01 | 0 | 0 | −0.67 | 0 |
| 22 | 4-Cl | 3-OH | H | 407 | 6.39 | 6.32 | 82.19 | 0 | 0 | −0.67 | 0.23 |
| 23 | 4-OCH3 | 3-OH | H | 481 | 6.32 | 6.57 | 91.42 | 0 | 0 | −0.67 | −0.27 |
| 24 | 3-NO2 | 4-OH | H | 123 | 6.91 | 6.96 | 128.01 | 0 | 0 | 0 | 0 |
| 25 | 4-Cl | 4-OH | H | 317 | 6.50 | 6.54 | 82.19 | 0 | 0 | 0 | 0.23 |
| 26 | 2-Cl | 3-Cl,4-OH | H | 152 | 6.82 | 6.82 | 82.19 | 0 | 0 | 0.71 | 0 |
| 27 | 2-OCH3 | 3-Cl,4-OH | H | 139 | 6.86 | 6.89 | 91.42 | 0 | 0 | 0.71 | 0 |
| 28 | 2-NO2 | 3-Cl,4-OH | H | 104 | 6.98 | 7.19 | 128.01 | 0 | 0 | 0.71 | 0 |
| 29 | 3-Cl | 3-Cl,4-OH | H | 94 | 7.03 | 6.81 | 82.19 | 0 | 0 | 0.71 | 0 |
| 30 | 3-NO2 | 3-Cl,4-OH | H | 59 | 7.23 | 7.17 | 128.01 | 0 | 0 | 0.71 | 0 |
| 31 | 4-Cl | 3-Cl,4-OH | H | 173 | 6.76 | 6.75 | 82.19 | 0 | 0 | 0.71 | 0.23 |
| 32 | H | 3,5-di-Cl,4-OH | H | 149 | 6.83 | 7.05 | 82.19 | 0 | 0 | 1.42 | 0 |
| 33 | 2-Cl | 3,5-di-Cl,4-OH | H | 93 | 7.03 | 7.04 | 82.19 | 0 | 0 | 1.42 | 0 |
| 34 | 2-OCH3 | 3,5-di-Cl,4-OH | H | 82 | 7.09 | 7.11 | 91.42 | 0 | 0 | 1.42 | 0 |
| 35 | 2-NO2 | 3,5-di-Cl,4-OH | H | 52 | 7.28 | 7.41 | 128.01 | 0 | 0 | 1.42 | 0 |
| 36 | 3-Cl | 3,5-di-Cl,4-OH | H | 58 | 7.24 | 7.02 | 82.19 | 0 | 0 | 1.42 | 0 |
| 37 | 3-OCH3 | 3,5-di-Cl,4-OH | H | 142 | 6.85 | 7.13 | 91.42 | 0 | 0 | 1.42 | 0 |
| 38 | 3-NO2 | 3,5-di-Cl,4-OH | H | 20 | 7.70 | 7.35 | 128.01 | 0 | 0 | 1.42 | 0 |
| 39 | 4-Cl | 3,5-di-Cl,4-OH | H | 91 | 7.04 | 6.96 | 82.19 | 0 | 0 | 1.42 | 0.23 |
| 40 | 4-OCH3 | 3,5-di-Cl,4-OH | H | 83 | 7.08 | 7.20 | 91.42 | 0 | 0 | 1.42 | −0.27 |
| 41 | 4-NO2 | 3,5-di-Cl,4-OH | H | 71 | 7.15 | 7.18 | 128.01 | 0 | 0 | 1.42 | 0.78 |
| 42 | H | 3-COOH | H | 291 | 6.54 | 6.64 | 99.26 | 0 | 0 | −0.32 | 0 |
| 43 | 2-Cl | 3-COOH | H | 136 | 6.87 | 6.63 | 99.26 | 0 | 0 | −0.32 | 0 |
| 44 | 3-Cl | 3-COOH | H | 134 | 6.87 | 6.63 | 99.26 | 0 | 0 | −0.32 | 0 |
| 45 | 3-OCH3 | 3-COOH | H | 195 | 6.71 | 6.71 | 108.49 | 0 | 0 | −0.32 | 0 |
| 46 | 3-NO2 | 3-COOH | H | 79 | 7.10 | 6.98 | 145.08 | 0 | 0 | −0.32 | 0 |
| 47 | 4-Cl | 3-COOH | H | 186 | 6.73 | 6.56 | 99.26 | 0 | 0 | −0.32 | 0.23 |
| 48 | 4-OCH3 | 3-COOH | H | 214 | 6.67 | 6.80 | 108.49 | 0 | 0 | −0.32 | −0.27 |
| 49 | H | 4-Cl,3-COOH | H | 143 | 6.85 | 7.12 | 99.26 | 1 | 0 | −0.32 | 0 |
| 50 | 2-Cl | 4-Cl,3-COOH | H | 74 | 7.13 | 7.07 | 99.26 | 1 | 0 | −0.32 | 0 |
| 51 | 2-NO2 | 4-Cl.3-COOH | H | 28 | 7.55 | 7.41 | 145.08 | 1 | 0 | −0.32 | 0 |
| 52 | 3-Cl | 4-Cl,3-COOH | H | 76 | 7.12 | 7.07 | 99.26 | 1 | 0 | −0.32 | 0 |
| 53 | 3-OCH3 | 4-Cl.3-COOH | H | 85 | 7.07 | 7.16 | 108.49 | 1 | 0 | −0.32 | 0 |
| 54 | 3-NO2 | 4-Cl,3-COOH | H | 26 | 7.59 | 7.40 | 145.08 | 1 | 0 | −0.32 | 0 |
| 55 | 4-Cl | 4-Cl.3-COOH | H | 109 | 6.96 | 7.02 | 99.26 | 1 | 0 | −0.32 | 0.23 |
| 56 | H | 4-SCH3 | H | 404 | 6.39 | 6.45 | 61.96 | 0 | 0 | 0 | 0 |
| 57 | 2-Cl | 4-SCH3 | H | 161 | 6.79 | 6.43 | 61.96 | 0 | 0 | 0 | 0 |
| 58 | 2-OCH3 | 4-SCH3 | H | 110 | 6.96 | 6.50 | 71.19 | 0 | 0 | 0 | 0 |
| 59 | 3-Cl | 4-SCH3 | H | 532 | 6.27 | 6.45 | 61.96 | 0 | 0 | 0 | 0 |
| 60 | 3-OCH3 | 4-SCH3 | H | 203 | 6.69 | 6.51 | 71.19 | 0 | 0 | 0 | 0 |
| 61 | 3-NO2 | 4-SCH3 | H | 152 | 6.82 | 6.80 | 107.78 | 0 | 0 | 0 | 0 |
| 62 | 4-Cl | 4-SCH3 | H | 529 | 6.28 | 6.38 | 61.96 | 0 | 0 | 0 | 0.23 |
| 63 | 4-OCH3 | 4-SCH3 | H | 243 | 6.61 | 6.59 | 71.19 | 0 | 0 | 0 | −0.27 |
| 64 | 4-NO2 | 4-SCH3 | H | 392 | 6.41 | 6.65 | 107.78 | 0 | 0 | 0 | 0.78 |
| 65 | H | H | CH3 | 2613 | 5.58 | 5.60 | 53.17 | 0 | 1 | 0 | 0 |
| 66 | 3-NO2 | H | CH3 | 1398 | 5.85 | 6.01 | 98.99 | 0 | 1 | 0 | 0 |
| 67 | 4-Cl | H | CH3 | 2285 | 5.64 | 5.47 | 53.17 | 0 | 1 | 0 | 0.23 |
IC50 (nM);
pIC50 (M);
Leave-one-out
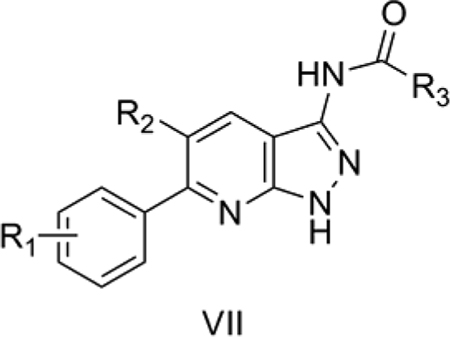
7. GSK-3α inhibiting fused pyrazolo pyridines
We considered 19 reported compounds and their GSK-3α inhibitory activity from Witherington et al., [51] who had identified a molecule containing the pyridazine scaffold as a GSK-3α inhibitor using pharmacophore-based virtual screening.
QSAR Model 7:
pIC50 = 0.076 (±0.014) TPSA + 0.839 (±0.330) B1R2 − 0.246 (±1.362)
n = 19, r = 0.820, r2 = 0.673, s = 0.592, F = 16.47, p = 0.000, q2 = 0.557, DW = 1.15
Model 7 (Table S2) explains 67.3% of the variance in the observed activity. TPSA shows a positive correlation with the GSK-3α inhibitory activity in Model 7. This shows that there is a favorable effect of methoxy or hydroxyl groups at R1 and a cyano group at R2 for GSK-3α inhibition. The steric descriptor in the above QSAR model, B1R2, shows that substituents at the R2 position have positive steric interactions. The most active 8 has a bulky bromine atom at R2, whereas the inactive 6 is unsubstituted at this position. Models 6 and 7 strongly suggest that polar interactions with GSK-3α are crucial for the activity of the VI and VII analogs.
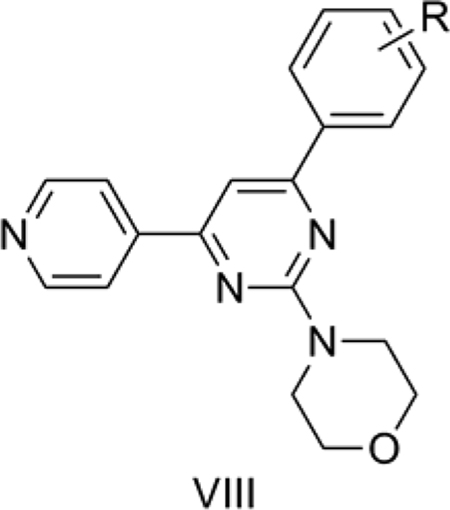
8. Pyrimethamine analogs as antimalarials
Agarwal et al.[52] reported fifteen 2,4,6-trisubstituted pyrimidines (VIII) as antimalarial compounds of which some were 5–20 times more potent than pyrimethamine. Pyrimethamine acts by inhibiting plasmodial dihydrofolate reductase (DHFR) leading to prevention of DNA biosynthesis and cell death. Plasmodium falciparum DHFR (PfDHFR) is a proven target for antimalarial drug development. Out of the reported 15 compounds, only 13 were considered for the present analysis. 3l, with 4-OMe-naphthyl, and 3o, with 2-thiophene, at the R position of the pyrimidine ring were the only two compounds without a phenyl ring substitution and so were not included for our 2D-QSAR analysis, since we wished to use common aromatic substituent constants. The suitable substitution pattern around a single aromatic ring (R) motivated us to adopt classical Hansch QSAR analysis for this case. The aromatic substituent constants used included the hydrophobic constant (π), molar refractivity (MR) and Hammett electronic constant (σ) as reported by Hansch and Leo [21] and the steric parameters derived from Verloop’s compilation [34].
QSAR Model 8:
pIC50 = 0.028 (±0.007) TPSA − 0.807 (±0.318) Σσ + 0.425 (±0.436)
n = 12, r = 0.820, r2 = 0.673, s = 0.291, F = 9.26, p = 0.007, q2 = 0.503, DW = 2.01
Model 8 (Table 7) explains 67.3% of the variance in the observed activity. Model 8 was obtained after removing 8 as an outlier. The reason for the outlying behavior of 8, which has trimethoxy substitution on the phenyl ring, is not immediately apparent. The positive correlation of TPSA with activity suggests that a polar group such as OCH3 or NO2 on the phenyl ring improves the antimalarial activity in VIII. The negative correlation of the Hammett electronic parameter, Σσ, with activity shows that electron donating groups on the phenyl ring are favorable for antimalarial activity.
Table 7.
Observed, converted and predicted antimalarial activity, TPSA and aromatic constants used in QSAR Models 8 and 8a.
| Comp. No. | Observed Activity[a] | Molecular weight | Converted Activity[b] | TPSA | Σσ | B14 | Predicted Activity[b,c] |
|---|---|---|---|---|---|---|---|
| 1 | 2 | 318.37 | 2.20 | 51.14 | 0 | 1 | 1.81 |
| 2 | 2 | 348.40 | 2.24 | 60.37 | −0.27 | 1.35 | 2.38 |
| 3 | 2 | 348.40 | 2.24 | 60.37 | 0.12 | 1 | 2.01 |
| 4 | 1 | 378.42 | 2.58 | 69.60 | −0.15 | 1 | 2.51 |
| 5 | 1 | 378.42 | 2.58 | 69.60 | −0.15 | 1 | 2.51 |
| 6 | 2 | 378.42 | 2.28 | 69.60 | 0.24 | 1 | 2.19 |
| 7 | 0.5 | 408.45 | 2.91 | 78.83 | −0.42 | 1.35 | 3.10 |
| 8 | 10 | 408.45 | 1.61 | 78.83 | −0.03 | 1.35 | - |
| 9 | 10 | 332.40 | 1.52 | 51.14 | −0.17 | 1.52 | 2.10 |
| 10 | 10 | 364.47 | 1.56 | 51.14 | 0 | 1.7 | 1.94 |
| 11 | 1 | 346.43 | 2.54 | 51.14 | −0.24 | 1.52 | 1.97 |
| 12 | 10 | 352.82 | 1.55 | 51.14 | 0.23 | 1.8 | 1.75 |
| 13 | 1 | 363.37 | 2.56 | 96.96 | 0.71 | 1 | 2.76 |
MIC (μg/mL);
pMIC (mM);
Leave-one-out from Model 8
QSAR Model 8a
pIC50 = −1.230 (±0.225) B14 + 3.618 (±0.289)
n = 11, r = 0.876, r2 = 0.768, s = 0.222, F = 29.832, p = 0.000, q2 = 0.676, DW = 1.713
QSAR Model 8a was developed after eliminating 7 and 11 as outliers. 7 also is a trimethoxy derivative like 8, which was an outlier for Model 8, whereas 11 is a dimethyl derivative. B1 is a steric parameter and a measure of the width of the first atom of the substituents. Its contribution in the above QSAR model shows that para substituents have negative steric interactions. This model is a mono-parametric equation with better statistics than Model 8 (which included one compound more) and without the TPSA descriptor. This implies that for this data set steric factors dominate over hydrogen bonding interactions.
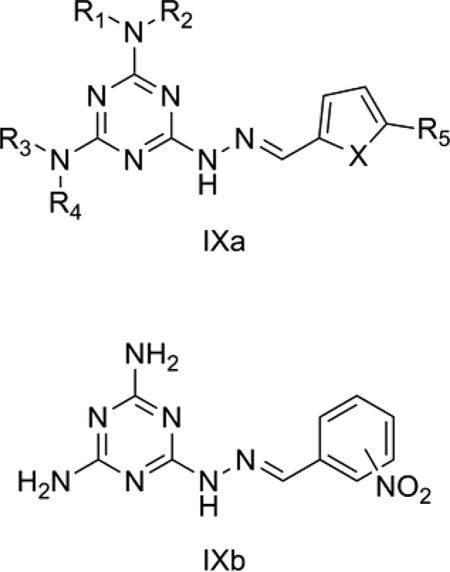
9. Melamine-based nitroheterocycles as antitrypanosomatids
Trypanosomatids cause several major diseases including human African trypanosomiasis (HAT), Chagas’ disease and leishmaniasis.[53] Trypanosomatids possess nucleoside transporters such as P2 to aid in the uptake of essential metabolites like purine nucleobases and nucleosides. Melarsoprol and pentamidine are well known substrates for P2 transporters, which greatly enhance the trypanocidal activity of these agents.[54] We studied a series of melamine-based nitroheterocyclic compounds (IXa and IXb) reported by Baliani et al.[53] that may be selectively delivered to trypanosomes. Some of the reported compounds showed in vitro trypanocidal activity similar to that of melarsoprol.
QSAR Model 9:
pIC50 = 0.051 (±0.015) TPSA − 2.980 (±0.536) INitrophenol − 0.817 (±2.179)
n = 10, r = 0.910, r2 = 0.827, s = 0.727, F = 16.77, p = 0.002, q2 = 0.716, DW = 1.72
Model 9 (Table 8) explains 82.7% of the variance in the observed activity. Model 9 was obtained after removing 3 and 7 as outliers. It is a bi-parametric equation developed for 7 melamines with nitrofuran (IXa) and 3 melamines with nitrophenol (IXb) side chains. TPSA showed a positive correlation with T. brucei rhodesiense inhibitory activity for these derivatives. The negative contribution of the indicator variable INitrophenol shows that nitrophenol derivatives are detrimental to this activity. In fact, Baliani et al.[53] suggested that neither nitrofuran nor nitrophenol substituents had a significant effect on P2 transporter affinity but rather that the melamine ring of IXa and IXb is the primary determinant. Hence, the polar interactions of the melamine ring, which account for optimal TPSA, are crucial for its affinity towards P2 and the resultant increased trypanocidal activity.
Table 8.
Observed, converted and predicted antitrypanosomatid T. brucei rhodesiense inhibitory activity, TPSA and the structural variable used in QSAR Model 9.
| Comp. No. | Observed Activity[a] | Converted Activity[b] | TPSA | INitrophenol | Predicted Activity[b,c] |
|---|---|---|---|---|---|
| 1 | 0.025 | 7.60 | 174.06 | 0 | 8.39 |
| 2 | 0.010 | 8.00 | 146.08 | 0 | 6.41 |
| 3 | 0.003 | 8.52 | 128.50 | 0 | - |
| 4 | 0.018 | 7.74 | 160.07 | 0 | 7.25 |
| 5 | 0.053 | 7.28 | 151.28 | 0 | 6.84 |
| 6 | 12.9 | 4.89 | 128.24 | 0 | 6.08 |
| 7 | 46.27 | 4.33 | 152.03 | 0 | - |
| 8 | 0.24 | 6.62 | 160.92 | 0 | 7.60 |
| 9 | 10.2 | 4.99 | 115.10 | 0 | 5.14 |
| 10 | 29.9 | 4.52 | 160.92 | 1 | 4.36 |
| 11 | 52.88 | 4.28 | 160.92 | 1 | 4.48 |
| 12 | 36.47 | 4.44 | 160.92 | 1 | 4.40 |
IC50 (μM);
pIC50 (M);
Leave-one-out
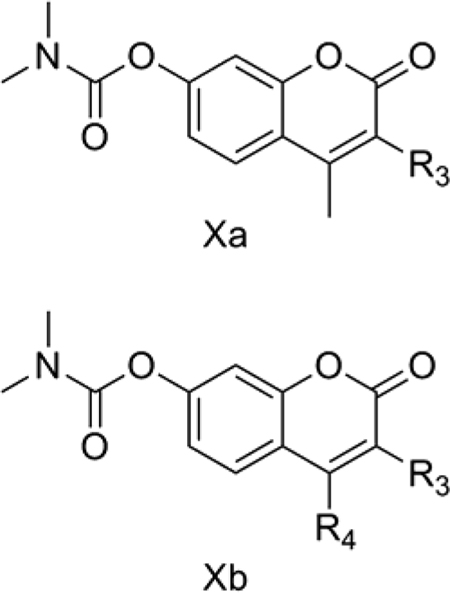
10. TNF-α inhibiting coumarins
Cheng et al. [55] reported some C-3 and C-4 modified coumarin derivatives (Xa and Xb) as TNF-α inhibitors. TNF-α is a proinflammatory cytokine released by monocytes and macrophages. TNF-α inhibition is an attractive target for the treatment of autoimmunoinflammatory diseases such as Crohn’s disease. We considered the reported in vitro TNF-α inhibitory activity of C-3 and C-4 modified coumarins separately and obtained QSAR Models 10a and 10b, respectively.
QSAR Model 10a:
pIC50 = 0.015 (±0.005) TPSA + 0.413 (±0.137) IR3=1CSA − 0.580 (±0.159) IR3Alip + 4.324 (±0.393)
n = 16, r = 0.925, r2 = 0.855, s = 0.190, F = 23.68, p = 0.000, q2 = 0.761, DW = 1.87
Model 10a (Table 9) explains 85.5% of the variance in the observed activity. The tri-parametric Model 10a was developed using the 16 remaining C-3 modified coumarins after eliminating 2 and 7 as outliers. The reason for the outlying behavior is not immediately apparent. TPSA shows a positive correlation with TNF-α inhibition. This positive correlation occurs because some of the moderately active compounds like 18 (IC50 = 2.4 μM) had the highest TPSA of 100.9 whereas the comparatively less active compound 5 (IC50 = 25.4 μM) had the lowest TPSA of 59.8 in the data set considered for Model 10a. In fact, the most active 2 also had the same lowest TPSA value but was omitted as an outlier during the generation of Model 10a. The indicator variable IR3=1CSA was given a value of 1 for compounds with a methylene spacer between the coumarin ring and R3 side chain aromatic rings such as phenyl or pyridine and 0 for others. The positive correlation of this indicator variable shows a favorable effect of such side chains at the C-3 position of the coumarin ring for better TNF-α inhibitory activity. The other indicator variable in Model 10a, IR3Alip, was given a value of 1 for compounds with an acyclic side chain at R3 and 0 for others. It showed a negative effect on TNF-α inhibitory activity.
Table 9.
Observed, converted and predicted TNF-α inhibitory activity, TPSA and indicator variables used in QSAR Models 10a and 10b.
| Comp. No. | Observed Activity[a] | Converted Activity[b] | TPSA | IR3=1CSA | IR3Alip | IR4Alip | Predicted Activity[b,c,d] | Predicted Activity[b,c,e] |
|---|---|---|---|---|---|---|---|---|
| 1 | 1.8 | 5.74 | 59.75 | 1 | 0 | - | 5.52 | - |
| 2 | 0.32 | 6.49 | 59.75 | 1 | 0 | - | - | - |
| 3 | 24.7 | 4.61 | 59.75 | 0 | 1 | - | 4.62 | - |
| 4 | 22.8 | 4.64 | 59.75 | 0 | 1 | - | 4.60 | - |
| 5 | 25.4 | 4.60 | 59.75 | 0 | 1 | - | 4.62 | - |
| 6 | 7.2 | 5.14 | 59.75 | 1 | 0 | - | 5.22 | - |
| 7 | 6.5 | 5.19 | 72.64 | 1 | 0 | - | - | - |
| 8 | 2.7 | 5.57 | 72.64 | 1 | 0 | - | 5.92 | - |
| 9 | 1.3 | 5.89 | 72.64 | 1 | 0 | - | 5.75 | - |
| 10 | 2.1 | 5.68 | 85.77 | 0 | 0 | - | 5.56 | - |
| 11 | 2.7 | 5.57 | 85.77 | 0 | 0 | - | 5.57 | - |
| 12 | 5.2 | 5.28 | 85.77 | 0 | 0 | - | 5.61 | - |
| 13 | 7.5 | 5.12 | 68.98 | 0 | 0 | - | 5.37 | - |
| 14 | 3.2 | 5.49 | 68.98 | 0 | 0 | - | 5.29 | - |
| 15 | 5.6 | 5.25 | 68.98 | 0 | 0 | - | 5.35 | - |
| 16 | 1.7 | 5.77 | 86.05 | 0 | 0 | - | 5.55 | - |
| 17 | 1.1 | 5.96 | 88.85 | 0 | 0 | - | 5.56 | - |
| 18 | 2.4 | 5.62 | 100.88 | 0 | 0 | - | 5.90 | - |
| 19 | 1.7 | 5.77 | 59.75 | - | - | 1 | - | 6.05 |
| 20 | 0.78 | 6.11 | 59.75 | - | - | 1 | - | 5.93 |
| 21 | 1.2 | 5.92 | 59.75 | - | - | 1 | - | 6.00 |
| 22 | 2.1 | 5.68 | 79.98 | - | - | 1 | - | 5.47 |
| 23 | 1.7 | 5.77 | 59.75 | - | - | 0 | - | 5.22 |
| 24 | 4.9 | 5.31 | 59.75 | - | - | 0 | - | 5.43 |
| 25 | 41.7 | 4.38 | 59.75 | - | - | 0 | - | - |
| 26 | 18.7 | 4.73 | 72.64 | - | - | 0 | - | 5.20 |
| 27 | 4.9 | 5.31 | 72.64 | - | - | 0 | - | 5.08 |
| 28 | 28.3 | 4.55 | 103.77 | - | - | 0 | - | 4.29 |
| 29 | 16.5 | 4.78 | 79.98 | - | - | 0 | - | 5.01 |
| 30 | 48.4 | 4.32 | 79.98 | - | - | 1 | - | - |
IC50 (μM);
pIC50 (M);
Leave-one-out;
Model 10a;
Model 10b
QSAR Model 10b:
pIC50 = −0.021 (±0.006) TPSA + 0.585 (±0.177) IR4Alip + 6.647 (±0.485)
n = 10, r = 0.911, r2 = 0.830, s = 0.256, F = 17.06, p = 0.002, q2 = 0.679, DW = 2.12
Model 10b (Table 9) explains 83.0% of the variance in the observed activity. Model 10b was obtained for 12 C-4 modified coumarins upon eliminating 25 and 30 as outliers. In contrast to the C-3 modified coumarins, these C-4 modified derivatives show a negative correlation of TPSA towards TNF-α inhibitory activity. This is not surprising, because the most active 20 (IC50 = 0.78 μM), which had the lowest TPSA of 59.8, was retained in the analysis. Also, the inactive 30 (IC50 = 48.4 μM) had a high TPSA of 80, the highest in the data set considered in this analysis. The indicator variable IR4Alip was given a value of 1 for compounds with an acyclic side chain at the R4 position of the coumarins and 0 for others. The positive contribution of this variable suggests that acyclic side chains are beneficial for the TNF-α inhibitory activity.
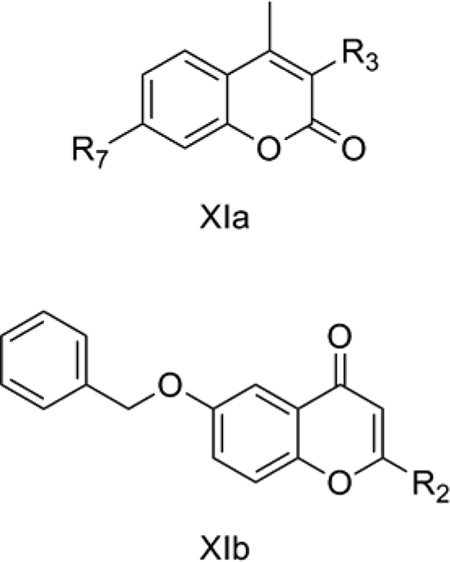
11. Acetylcholineesterease inhibiting coumarinic MAO-B inhibitors
Bruhlmann et al. [56] reported 17 coumarins (XIa) and 2 chromones (XIb) as dual inhibitors of acetylcholinesterase and monoamine oxidase. Acetylcholinesterase (AChE) inhibitors are used in the treatment of Alzheimer’s disease. Tacrine, an AChE inhibitor, was the first FDA approved drug for the treatment of Alzheimer’s disease in the USA. MAO-B is also considered as a viable target for the treatment of Alzheimer’s disease [57]. We considered the MAO-B inhibitory activity of the coumarins reported by Bruhlmann et al. [56, 58] for our QSAR study.
QSAR Model 11:
pIC50 (MAO-B) = −0.030 (±0.009) TPSA − 1.883 (±0.202) IChromone + 9.644 (±0.377)
n = 16, r = 0.936, r2 = 0.875, s = 0.263, F = 45.58, p = 0.000, q2 = 0.734, DW = 2.04
Model 11 (Table 10) explains 87.5% of the variance in the observed activity. Model 11 was obtained after removing 14 as an outlier. 14 is the only compound among the coumarin derivatives (X1a) with hydrogen at R3, with all the others having a methyl group there. TPSA shows a negative correlation with the MAO-B inhibitory activity of the XIa and XIb compounds. The most active 12, with pIC50 = 8.94, had the lowest TPSA of 39.4, whereas comparatively less active 6, with pIC50 = 7.46, had the highest TPSA of 65.5. The negative contribution of the indicator variable IChromone shows that the chromone ring is detrimental to the activity.
Table 10.
Observed, and predicted MAO-B inhibitory activity, TPSA and structural variable used in QSAR Model 11.
| Comp. No. | Observed Activity[a] | TPSA | IChromone | Predicted Activity[a,b] |
|---|---|---|---|---|
| 1 | 8.36 | 39.44 | 0 | 8.47 |
| 2 | 8.06 | 39.44 | 0 | 8.50 |
| 3 | 8.36 | 39.44 | 0 | 8.47 |
| 4 | 8.01 | 59.67 | 0 | 7.76 |
| 5 | 8.44 | 48.67 | 0 | 8.15 |
| 6 | 7.46 | 65.46 | 0 | 7.98 |
| 7 | 8.55 | 39.44 | 0 | 8.45 |
| 8 | 8.48 | 39.44 | 0 | 8.46 |
| 9 | 8.21 | 39.44 | 0 | 8.48 |
| 10 | 8.52 | 39.44 | 0 | 8.45 |
| 11 | 8.59 | 39.44 | 0 | 8.45 |
| 12 | 8.94 | 39.44 | 0 | 8.41 |
| 13 | 8.52 | 39.44 | 0 | 8.45 |
| 14 | 7.74 | 39.44 | 0 | - |
| 15 | 8.25 | 39.44 | 0 | 8.48 |
| 16 | 6.90 | 39.44 | 1 | 6.25 |
| 17 | 6.25 | 39.44 | 1 | 6.90 |
pIC50 (M);
Leave-one-out
12. MT1 and MT2 full agonism by fluoren-9-yl ethyl amides
Epperson et al. [59] reported N-[2-(2,7-dimethoxyfluoren-9-yl)ethyl]-propanamide as a human melatonin MT1 and MT2 receptor dual agonist, and also prepared analogs as part of their effort to design better drugs to address the common sleep problems which are most predominant among the elderly.
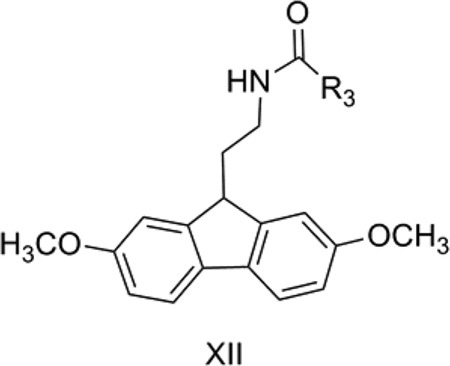
QSAR Model 12a:
pKi(MT1) = −0.120 (±0.037) TPSA −1.237 (±0.332) CMR + 26.021 (±4.021)
n = 12, r = 0.836, r2 = 0.700, s = 0.514, F = 10.48, p = 0.004, q2 = 0.480, DW = 1.97
Model 12a (Table 11) explains 70% of the variance in the observed activity. The TPSA is not a very appropriate descriptor for this data set since it only has 2 distinct values for the 12 compounds. The negative contribution of TPSA in Model 12 can be attributed to the detrimental effect of the hydrogen bond donor group, NH, on the R3 side chain of XII, as found in 12 which had Ki = 350 nM towards MT1 and had the highest TPSA. The negative contribution of CMR, which is a measure of steric bulk, suggests that less bulky groups are conducive to MT1 receptor binding. This is in good agreement with the most active compounds having either ethyl (2) or n-Pr (3) at R3 of XII and the compound with the bulkier cyclopentyl group (9) being an inactive one. However, if this held true in general, then 1, with the least steric bulk at R3, a methyl group, should have shown good potency. On the contrary, it was less active than the analog with an ethyl substituent, 2. In order to account for such an effect among these congeners, we calculated ClogP and expected a parabolic relationship with this hydrophobicity descriptor. As expected, we found a parabolic relationship (Model 12b) of MT1 receptor binding with hydrophobicity together with TPSA.
Table 11.
Observed, converted and predicted MT1 and MT2 inhibitory activities, TPSA and aromatic constants used in QSAR Models 12a, 12b and 12c.
| Comp. No. | Observed Activity[a] | Observed Activity[b] | Converted Activity[c] | Converted Activity[d] | TPSA | ClogP | CMR | Predicted Activity[c,e,f] | Predicted Activity[c,e,g] | Predicted Activity[d,e,h] |
|---|---|---|---|---|---|---|---|---|---|---|
| 1 | 2.3 | 0.55 | 8.64 | 9.26 | 47.56 | 2.69 | 9.05 | 9.58 | 8.6 | 9.4 |
| 2 | 2.0 | 0.28 | 8.70 | 9.55 | 47.56 | 3.22 | 9.52 | 8.53 | 8.6 | 9.23 |
| 3 | 1.9 | 0.29 | 8.72 | 9.54 | 47.56 | 3.75 | 9.98 | 7.91 | - | - |
| 4 | 140 | 10 | 6.85 | 8.00 | 47.56 | 4.28 | 10.44 | 7.56 | 6.63 | - |
| 5 | 33 | 2.3 | 7.48 | 8.64 | 47.56 | 3.53 | 9.98 | 8.05 | - | 8.82 |
| 6 | 59 | 16 | 7.23 | 7.80 | 47.56 | 3.93 | 10.44 | 7.47 | 7.57 | 7.94 |
| 7 | 4.1 | 0.47 | 8.39 | 9.33 | 47.56 | 3.05 | 9.84 | 8.14 | 8.68 | 9.36 |
| 8 | 3.3 | 4.4 | 8.48 | 8.36 | 47.56 | 3.61 | 10.27 | 7.50 | 8.19 | 8.68 |
| 9 | 150 | 37 | 6.82 | 7.43 | 47.56 | 4.17 | 10.73 | 7.19 | 6.96 | 7.24 |
| 10 | 28 | 0.96 | 7.55 | 9.02 | 56.79 | 2.87 | 9.67 | 7.11 | 7.54 | 9.01 |
| 11 | 2.6 | 0.38 | 8.59 | 9.42 | 47.56 | 3.31 | 9.54 | 8.53 | 8.47 | 9.13 |
| 12 | 350 | 14 | 6.46 | 7.85 | 59.59 | 3.75 | 9.89 | 7.04 | 6.47 | 7.86 |
Ki(MT1) (nM);
Ki(MT2) (nM);
pKi(MT1) (M);
pKi(MT2) (M);
Leave-one-out;
Model 12a;
Model 12b;
Model 12c
QSAR Model 12b:
pKi(MT1) = −0.122 (±0.019) TPSA + 6.765 (±2.422) ClogP − 1.147 (±0.346) (ClogP)2 + 4.505 (±4.163)
n = 10, r = 0.973, r2 = 0.947, s = 0.248, F = 35.74, p = 0.000, q2 = 0.880, DW = 2.43
Model 12b (Table 11) explains 94.7% of the variance in the observed activity. Model 12b was obtained after removing 3 and 5 as outliers. The derived model clearly indicates that an optimum hydrophobicity at R3 of XII is required for effective binding of these compounds with the MT1 receptor.
We also considered MT2 receptor binding affinity data for the same 12 compounds. [59]
QSAR Model 12c:
pKi(MT2) = −0.044 (±0.019) TPSA + 6.811 (±2.827) ClogP − 1.206 (±0.413) (ClogP)2 + 1.877 (±4.864)
n = 10, r = 0.962, r2 = 0.925, s = 0.258, F = 24.53, p = 0.001, q2 = 0.763, DW = 2.57
Model 12b (Table 11) explains 92.5% of the variance in the observed activity. Model 12c was obtained after removing 3 and 4 as outliers. Model 12c shows that a similar trend (TPSA negatively correlated to activity and a parabolic relationship of hydrophobicity with activity) is followed in case of MT2 receptor binding as for MT1. The analogs of XII having ethyl or n-Pr at R3 are the most active compounds and the cyclopentyl analog is the least active among the congeners.
13. CB2-selective triaryl bis-sulfones
There is considerable interest in the development of cannabinoid CB2 receptor inhibitors to modulate the immune system. Lavey et al. [60] discovered a novel CB2-selective triaryl bis-sulfone shown below (XIII) with L2 = L1 = SO2, X = Y= 4-OCH3. Shankar et al. [61] reported structure-activity data for substitution on the two aromatic rings B and C and for varying the linkers L1 and L2. We considered 37 of their reported compounds.
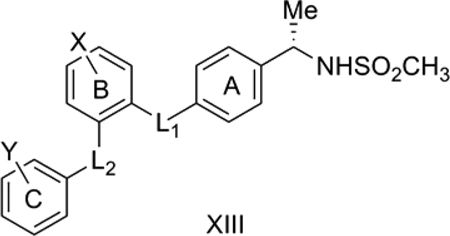
QSAR Model 13:
pKi(CB2) = 0.037 (±0.007) TPSA + 1.534 (±0.277) IL1CH2 − 1.586 (±0.287) ΣπY − 1.101 (±0.356) IL1CO + 4.414 (±0.786)
n = 37, r = 0.854, r2 = 0.729, s = 0.575, F = 21.54, p = 0.000, q2 = 0.645, DW = 1.80
Model 13 (Table 12) explains 72.9% of the variance in the observed activity. TPSA is positively correlated with CB2 affinity. One of the most potent compounds, 22 with Ki = 0.4 nM towards CB2, had the highest TPSA of 132.9, compared to TPSA of 89.5 for the less active 21 (Ki = 983 nM). The negative correlation of the indicator variable IL1CO with the activity suggests that a carbonyl linker between the two aromatic rings A and B is detrimental for CB2 binding affinity. On the other hand, the positive correlation of indicator variable IL1CH2 suggests that a methylene linker between the two aromatic rings A and B is conducive to CB2 binding affinity. The most active 3, with Ki = 0.4 nM, had a methylene linker as L1. The other most active compound 22, also with Ki = 0.4 nM, had SO2 as L1. The negative contribution of the Hansch substituent constant ΣπY shows that less hydrophobic substituents around ring C of XIII are preferred for improved CB2 binding affinity data.
Table 12.
Observed, converted and predicted CB2 binding affinity, TPSA and indicator variables used in QSAR Model 13.
| Comp. No. | Observed Activity[a] | Converted Activity[b] | TPSA | IL1CH2 | Σπγ | IL1CO | Predicted Activity[b,c] |
|---|---|---|---|---|---|---|---|
| 1 | 0.6 | 9.22 | 98.77 | 1 | −0.02 | 0 | 9.75 |
| 2 | 6.7 | 8.17 | 80.31 | 1 | 0.71 | 0 | 7.74 |
| 3 | 0.4 | 9.40 | 89.54 | 1 | 0.14 | 0 | 8.99 |
| 4 | 1 | 9.00 | 80.31 | 1 | 0.14 | 0 | 8.66 |
| 5 | 1.8 | 8.74 | 80.31 | 1 | 0.28 | 0 | 8.45 |
| 6 | 16 | 7.80 | 98.77 | 1 | 1.04 | 0 | 8.02 |
| 7 | 3.5 | 8.46 | 80.31 | 1 | 0.14 | 0 | 8.75 |
| 8 | 35 | 7.46 | 89.54 | 1 | 0.88 | 0 | 7.97 |
| 9 | 44 | 7.36 | 115.84 | 0 | −0.02 | 1 | 7.81 |
| 10 | 179 | 6.75 | 106.61 | 0 | 0.14 | 1 | 7.20 |
| 11 | 410 | 6.39 | 97.38 | 0 | 0.71 | 1 | 5.43 |
| 12 | 76 | 7.12 | 80.31 | 0 | 0.71 | 0 | 6.11 |
| 13 | 86 | 7.07 | 89.54 | 0 | 0.14 | 0 | 7.58 |
| 14 | 406 | 6.39 | 101.90 | 0 | 0.71 | 0 | 7.11 |
| 15 | 164 | 6.79 | 80.31 | 0 | 0.71 | 0 | 6.17 |
| 16 | 192 | 6.72 | 97.38 | 0 | 0.71 | 0 | 6.92 |
| 17 | 247 | 6.61 | 80.31 | 0 | 0.14 | 0 | 7.31 |
| 18 | 77 | 7.11 | 100.54 | 0 | 0.14 | 0 | 8.00 |
| 19 | 230 | 6.64 | 100.54 | 0 | 0.71 | 0 | 7.05 |
| 20 | 278 | 6.56 | 92.34 | 0 | 0.71 | 0 | 6.73 |
| 21 | 983 | 6.01 | 89.54 | 0 | 0.71 | 0 | 6.68 |
| 22 | 0.4 | 9.40 | 132.91 | 0 | −0.02 | 0 | 9.38 |
| 23 | 0.6 | 9.22 | 123.68 | 0 | 0 | 0 | 8.98 |
| 24 | 0.9 | 9.05 | 123.68 | 0 | 0.71 | 0 | 7.77 |
| 25 | 13 | 7.89 | 134.68 | 0 | 0.71 | 0 | 8.36 |
| 26 | 232 | 6.63 | 123.68 | 0 | 0.71 | 0 | 8.00 |
| 27 | 8 | 8.10 | 114.45 | 0 | 0.71 | 0 | 7.50 |
| 28 | 58 | 7.24 | 114.45 | 0 | 0.71 | 0 | 7.56 |
| 29 | 0.5 | 9.30 | 114.45 | 0 | 0.14 | 0 | 8.38 |
| 30 | 0.9 | 9.05 | 114.45 | 0 | 0.14 | 0 | 8.39 |
| 31 | 9 | 8.05 | 114.45 | 0 | 0.14 | 0 | 8.47 |
| 32 | 2 | 8.70 | 114.45 | 0 | 0 | 0 | 8.66 |
| 33 | 6 | 8.22 | 114.45 | 0 | 0.71 | 0 | 7.50 |
| 34 | 23 | 7.64 | 114.45 | 0 | 0.71 | 0 | 7.53 |
| 35 | 10 | 8.00 | 114.45 | 0 | 0.71 | 0 | 7.51 |
| 36 | 1 | 9.00 | 114.45 | 0 | 0.14 | 0 | 8.40 |
| 37 | 128 | 6.89 | 123.68 | 0 | 1.04 | 0 | 7.44 |
Ki(CB2) (nM);
pKi(CB2) (M);
Leave-one-out
14. PDE5-inhibiting xanthine analogs
Wang et al. [62] reported some xanthine analogs (XIV) as potent and selective PDE5 inhibitors. PDE5 is a cGMP hydrolytic enzyme which breaks down cGMP in the corpora cavernosa smooth muscles. Inhibition of PDE5 has been used as an effective target for the treatment of male erectile dysfunction, with Sildenafil (Viagra) as the pioneer drug in this category. We considered 19 of the reported compounds. [62] The use of an indicator variable allowed us to consider both cyclopentyl (n=1) and cyclohexyl (n=2) sets as a single larger data set for a more effective QSAR study.
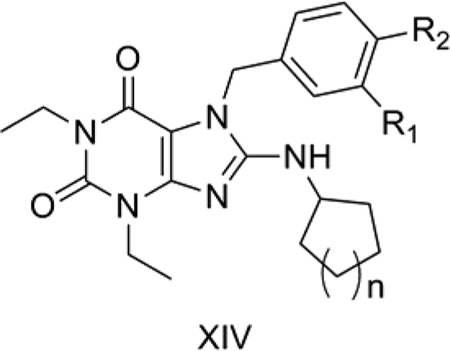
QSAR Model 14:
pIC50 = 0.031 (±0.011) TPSA − 0.755 (±0.239) IR1CH3 + 0.524 (±0.181) IR1F + 6.067 (±0.924)
n = 18, r = 0.835, r2 = 0.696, s = 0.311, F = 10.71, p = 0.001, q2 = 0.500, DW = 2.34
Model 14 (Table 13) explains 69.6% of the variance in the observed activity. Model 14 was obtained after eliminating 4 as an outlier. The reason for the outlying behavior of 4 is not immediately apparent, but it is the only compound with a methoxyl substitution at R1. The positive correlation of TPSA shows that polar groups like hydroxyl and methoxyl at R2 and hydroxyl at R1 are important for PDE5 inhibition for XIV. The indicator variable IR1CH3 was assigned a value of 1 for compounds with R1 as a CH3 group and 0 for others. Its negative contribution shows a detrimental effect of an R1 methyl group on PDE5 inhibition. The other indicator variable IR1F was assigned a value of 1 for compounds with R1 fluoro substitution and 0 for others. Its positive correlation shows that a fluorine atom at R1 is favorable for PDE5 inhibition. Other indicator variables which we tried included IR1Cl for chlorine substitution at R1 and IC8 to distinguish between the cyclohexyl and cyclopentyl derivatives, but these gave worse QSAR models.
Table 13.
Observed, converted and predicted PDE5 inhibitory activity, TPSA and structural variables used in QSAR Model 14.
| Comp. No. | Observed Activity[a] | Converted Activity[b] | TPSA | IR1CH3 | IR1F | Predicted Activity[b,c] |
|---|---|---|---|---|---|---|
| 1 | 12 | 7.92 | 73.85 | 0 | 0 | 8.48 |
| 2 | 2.6 | 8.59 | 83.08 | 0 | 0 | 8.62 |
| 3 | 0.6 | 9.22 | 94.08 | 0 | 0 | 8.91 |
| 4 | 100 | 7.00 | 83.08 | 0 | 0 | - |
| 5 | 1.2 | 8.92 | 94.08 | 0 | 0 | 8.96 |
| 6 | 19 | 7.72 | 83.08 | 1 | 0 | 8.03 |
| 7 | 4.5 | 8.35 | 94.08 | 1 | 0 | 8.04 |
| 8 | 0.58 | 9.24 | 83.08 | 0 | 0 | 8.56 |
| 9 | 2.0 | 8.70 | 94.08 | 0 | 0 | 9.01 |
| 10 | 0.3 | 9.52 | 83.08 | 0 | 1 | 8.99 |
| 11 | 0.33 | 9.48 | 94.08 | 0 | 1 | 9.48 |
| 12 | 1.7 | 8.77 | 83.08 | 0 | 0 | 8.60 |
| 13 | 10 | 8.00 | 73.85 | 0 | 0 | 8.46 |
| 14 | 2.1 | 8.68 | 83.08 | 0 | 0 | 8.61 |
| 15 | 1.5 | 8.82 | 94.08 | 0 | 0 | 8.98 |
| 16 | 1.1 | 8.96 | 83.08 | 0 | 0 | 8.58 |
| 17 | 1.8 | 8.74 | 94.08 | 0 | 0 | 9.00 |
| 18 | 0.69 | 9.16 | 83.08 | 0 | 1 | 9.14 |
| 19 | 0.82 | 9.09 | 94.08 | 0 | 1 | 9.64 |
IC50 (nM);
pIC50 (M);
Leave-one-out
Conclusion
2D-QSAR is an effective way to probe the mechanism of action and nature of molecular interactions between drug and target protein especially when the target structure is not available. Reported herein is the application of the topological polar surface area, a recently reported 2D topological descriptor, which can be used instead of the traditional 3D polar surface area as a good QSAR descriptor. The QSAR models help in understanding the nature of the drug-target interactions for the various biological targets. The selection through forward-stepping of TPSA as a useful descriptor in a particular model indicates that polar interactions are important for the ligand-receptor interactions in that case. Furthermore the sign of the TPSA coefficient can indicate whether a more polar ligand is favored or disfavored for enhanced activity.
Since the calculation of TPSA is based only on the contribution of tabulated polar fragments and not the 3D conformations of these chemical groups, there are two serious limitations when it is used for 2D-QSAR analyses. The first limitation is the inability of TPSA to capture the activity difference of compounds differing only in their non polar groups. This is reflected for example in our QSAR Models 3 and 4. For Model 2, compounds 2, 3 and 4, in spite of differing in their observed activities, all had the same TPSA values. Hence TPSA failed to account for the SAR shown by these three compounds. A more obvious case, with greater difference in activity, is QSAR Model 4, in which the activities of compounds 14 and 15 differed by 2.5 log units but the compounds had the same TPSA. The second limitation stems from the fact that TPSA calculation does not include the influence of positional changes of functional groups. For example, a polar group in ortho, meta or para position or even placed at a different place in the molecule would contribute the same amount to the TPSA. Because of this factor, for a given data set there would be only a few distinct values of TPSA when the polar functional groups differ little in the set of compounds. If the number of distinct values of TPSA falls to two it becomes nothing but an indicator or dummy variable in 2D-QSARs. This limitation is reflected in QSAR Model 14 in which TPSA had only three distinct values, but at least that was one more that the two distinct values for the indicator variables used. Thus caution is needed when using TPSA in 2D-QSAR modeling.
In summary, we reported 17 models with 0.67 < r2 < 0.95 and 0.36 < q2 < 0.88. The coefficient C for TPSA in the models had an absolute value 0.007 < C < 0.122. For three QSAR models, Models 2, 5 (< 1 log activity) and 8 (< 2 log activity), the activity range considered is very narrow, but nevertheless the models are statistically significant and valid for the type of 2D-QSAR we performed to provide mechanistic interpretation and to demonstrate the use of TPSA. However, we also report the limitations of using TPSA for 2D-QSAR. TPSA would be best used in combination with other physicochemical properties that account for the contribution of nonpolar functional groups for 2D-QSAR analyses. We found a positive correlation of TPSA with CB2 receptor ligand binding, DNA-PK inhibition, aromatase enzyme inhibition, telomerase enzyme inhibition, PDE5 enzyme inhibition, antimalarial activity, GSK-3 inhibition and anti-trypanosomiasis activity and a negative correlation with cytotoxic activity of marine pyridoacridine anticancer alkaloids, MAO-B enzyme inhibition, tumor necrosis factor-α inhibition and melatonin receptor binding. This report shows the broad range of receptor-ligand interactions for which the TPSA is useful.
Supplementary Material
Acknowledgements
This research was supported in part by funding from University of Mississippi, including from its Faculty Research Program and from the Office of Research and Sponsored Programs; from the National Center for Zoonotic, Vector-borne, and Enteric Diseases (CK) of the Centers for Disease Control and Prevention (U01/CI000211); from the National Science Foundation (EPS-0556308); and from National Institutes of Health’s National Center for Research Resources (P20 RR021929). SP is a Natural Products Neuroscience Fellow. This investigation was conducted in a facility constructed with support from research facilities improvement program C06 RR-14503-01 from the NIH National Center for Research Resources. Thanks to Dr. Aihua Xie for helpful discussions.
List of Abbreviations
- AChE
Acetylcholinesterase
- ADME
Absorption, Distribution, Metabolism, Excretion
- BBB
Blood-brain barrier
- CB2
Cannabinoid receptor type - 2
- DHFR
Dihydrofolate reductase
- DNA-PK
DNA-dependent protein kinase
- DW
Durbin-Watson
- GSK-3
Glycogen synthase kinase-3
- HA
Hydrogen bond acceptor
- HAT
Human African trypanosomiasis
- HD
Hydrogen bond donor
- Loo
leave-one-out
- MAO-B
Monoamino oxidase-B
- MLRA
Multiple linear-regression analyses
- MR
Molar refractivity
- MT1
Melatonin receptor type - 1
- MT2
Melatonin receptor type - 2
- PDE-5
Phosphodiesterase - 5
- PSA
Polar surface area
- QSAR
Quantitative structure activity relationship
- SAR
structure activity relationship
- TNF-α
Tumor necrosis factor-α
- TPSA
Topological polar surface area
References
- 1.Li SF; He HD; Parthiban LJ; Yin HQ; Serajuddin ATM IV-IVC considerations in the development of immediate-release oral dosage form. Journal of Pharmaceutical Sciences 2005, 94, 1396–417. [DOI] [PubMed] [Google Scholar]
- 2.Strazielle N; Ghersi-Egea JF Factors affecting delivery of antiviral drugs to the brain. Rev. Med. Virol, 2005, 15, 105–33. [DOI] [PubMed] [Google Scholar]
- 3.Clark DE Rapid calculation of polar molecular surface area and its application to the prediction of transport phenomena. 1. Prediction of intestinal absorption. Journal of Pharmaceutical Sciences 1999, 88, 807–14. [DOI] [PubMed] [Google Scholar]
- 4.Ertl P; Rohde B; Selzer P Fast calculation of molecular polar surface area as a sum of fragment-based contributions and its application to the prediction of drug transport properties. J. Med. Chem, 2000, 43, 3714–17. [DOI] [PubMed] [Google Scholar]
- 5.Clark DE; Higgs C; Wren SP; Dyke HJ; Wong M; Norman D; Lockey PM; Roach AG A virtual screening approach to finding novel and potent antagonists at the melanin-concentrating hormone 1 receptor. Journal of Medicinal Chemistry 2004, 47, 3962–71. [DOI] [PubMed] [Google Scholar]
- 6.Fink T; Bruggesser H; Reymond JL Virtual exploration of the small-molecule chemical universe below 160 daltons. Angewandte Chemie-International Edition 2005, 44, 1504–08. [DOI] [PubMed] [Google Scholar]
- 7.Monge A; Arrault A; Marot C; Morin-Allory L Managing, profiling and analyzing a library of 2.6 million compounds gathered from 32 chemical providers. Molecular Diversity 2006, 10, 389–403. [DOI] [PubMed] [Google Scholar]
- 8.Russell MGN; Carling RW; Atack JR; Bromidge FA; Cook SM; Hunt P; Isted C; Lucas M; McKernan RM; Mitchinson A; Moore KW; Narquizian R; Macaulay AJ; Thomas D; Thompson SA; Wafford KA; Castro JL Discovery of functionally selective 7,8,9,10-tetrahydro-7,10-ethano-1,2,4-triazolo[3,4-a]phthalazines as GABA(A) receptor agonists at the alpha(3) subunit. J. Med. Chem, 2005, 48, 1367–83. [DOI] [PubMed] [Google Scholar]
- 9.Bartzatt RL Evaluation of pyridine-3-carboxylic acid as a drug carrier by utilizing multivariate methods, structure property correlations, and pattern recognition techniques. Receptors & Channels, 2004, 10, 61–71. [DOI] [PubMed] [Google Scholar]
- 10.Clark DE Rapid calculation of polar molecular surface area and its application to the prediction of transport phenomena. 2. Prediction of blood-brain barrier penetration. Journal of Pharmaceutical Sciences 1999, 88, 815–21. [DOI] [PubMed] [Google Scholar]
- 11.Freitas MP MIA-QSAR modelling of anti-HIV-1 activities of some 2-amino-6-arylsulfonylbenzonitriles and their thio and sulfinyl congeners. Organic & Biomolecular Chemistry 2006, 4, 1154–59. [DOI] [PubMed] [Google Scholar]
- 12.Geneste H; Amberg W; Backfisch G; Beyerbach A; Braje WM; Delzer E; Haupt A; Hutchins CW; King LL; Sauer DR; Unger L; Wernet W Synthesis and SAR of highly potent and selective dopamine D-3-receptor antagonists: Variations on the 1H-pyrimidin-2-one theme. Bioorganic & Medicinal Chemistry Letters 2006, 16, 1934–37. [DOI] [PubMed] [Google Scholar]
- 13.Gerebtzoff G; Seelig A In silico prediction of blood - Brain barrier permeation using the calculated molecular cross-sectional area as main parameter. Journal of Chemical Information and Modeling 2006, 46, 2638–50. [DOI] [PubMed] [Google Scholar]
- 14.Katritzky AR; Kuanar M; Slavov S; Dobchev DA; Fara DC; Karelson M; Acree WE; Solov’ev VP; Varnek A Correlation of blood-brain penetration using structural descriptors. Bioorganic & Medicinal Chemistry 2006, 14, 4888–917. [DOI] [PubMed] [Google Scholar]
- 15.Manley PW; Furet P; Bold G; Bruggen J; Mestan J; Meyer T; Schnell CR; Wood J Anthranilic acid amides: A novel class of antiangiogenic VEGF receptor kinase inhibitors. Journal of Medicinal Chemistry 2002, 45, 5687–93. [DOI] [PubMed] [Google Scholar]
- 16.Mehrotra MM; Heath JA; Smyth MS; Pandey A; Rose JW; Seroogy JM; Volkots DL; Nannizzi-Alaimo L; Park GL; Lambing JL; Hollenbach SJ; Scarborough RM Discovery of novel 2,8-diazaspiro[4.5]decanes as orally active glycoprotein IIb-IIIa antagonists. Journal of Medicinal Chemistry 2004, 47, 2037–61. [DOI] [PubMed] [Google Scholar]
- 17.Remko M; Swart M; Bickelhaupt FM Theoretical study of structure, pK(a), lipophilicity, solubility, absorption, and polar surface area of some centrally acting antihypertensives. Bioorganic & Medicinal Chemistry 2006, 14, 1715–28. [DOI] [PubMed] [Google Scholar]
- 18.Tan DS Diversity-oriented synthesis: exploring the intersections between chemistry and biology. Nature Chem. Biol, 2005, 1, 74–84. [DOI] [PubMed] [Google Scholar]
- 19.Ertl P, Ed. Polar Surface Area. Wiley-VCH: Weinheim, 2007. [Google Scholar]
- 20.Garg R; Kurup A; Mekapati SB; Hansch C Cyclooxygenase (COX) inhibitors: A comparative QSAR study. Chemical Reviews 2003, 103, 703–31. [DOI] [PubMed] [Google Scholar]
- 21.Hansch C; Leo A Substituent Constants for Correlation Analysis in Chemistry and Biology. John Wiley and Sons, 1979. [DOI] [PubMed] [Google Scholar]
- 22.Yoshida K; Niwa T Quantitative structure-activity relationship studies on inhibition of HERG potassium channels. Journal of Chemical Information and Modeling 2006, 46, 1371–78. [DOI] [PubMed] [Google Scholar]
- 23.Murias M; Handler N; Erker T; Pleban K; Ecker G; Saiko P; Szekeres T; Jager W Resveratrol analogues as selective cyclooxygenase-2 inhibitors: synthesis and structure-activity relationship. Bioorganic & Medicinal Chemistry 2004, 12, 5571–78. [DOI] [PubMed] [Google Scholar]
- 24.Shahapurkar S; Kawathekar N; Chaturvedi SC Quantitative structure activity relationship studies of diaryl thiophen derivatives as selective COX-2 inhibitors. Pharmazie, 2005, 60, 254–58. [PubMed] [Google Scholar]
- 25.Liu RF; Sun HM; So SS Development of quantitative structure-property relationship models for early ADME evaluation in drug discovery. 2. Blood-brain barrier penetration. J. Chem. Inf. Comp. Sci, 2001, 41, 1623–32. [DOI] [PubMed] [Google Scholar]
- 26.Pan DH; Iyer M; Liu JZ; Li Y; Hopfinger AJ Constructing optimum blood brain barrier QSAR models using a combination of 4D-molecular similarity measures and cluster analysis. J. Chem. Inf. Comp. Sci, 2004, 44, 2083–98. [DOI] [PubMed] [Google Scholar]
- 27.Liu RF; So SS Development of quantitative structure-property relationship models for early ADME evaluation in drug discovery. 1. Aqueous solubility. J. Chem. Inf. Comp. Sci, 2001, 41, 1633–39. [DOI] [PubMed] [Google Scholar]
- 28.Turabekova MA; Rasulev BF A QSAR toxicity study of a series of alkaloids with the lycoctonine skeleton. Molecules, 2004, 9, 1194–207. [DOI] [PMC free article] [PubMed] [Google Scholar]
- 29.Turabekova MA; Rasulev BF QSAR analysis of the structure-toxicity relationship of Aconitum and Delphinium diterpene alkaloids. Chem. Nat. Comp, 2005, 41, 213–19. [Google Scholar]
- 30.Estrada E; Quincoces JA; Patlewicz G Creating molecular diversity from antioxidants in Brazilian propolis. Combination of TOPS-MODE QSAR and virtual structure generation. Molecular Diversity 2004, 8, 21–33. [DOI] [PubMed] [Google Scholar]
- 31.Sprous DG; Zhang J; Zhang L; Wang ZL; Tepper MA Kinase inhibitor recognition by use of a multivariable QSAR model. J. Mol. Graph. Model, 2006, 24, 278–95. [DOI] [PubMed] [Google Scholar]
- 32.Li H; Yap CW; Ung CY; Xue Y; Li ZR; Han LY; Lin HH; Chen YZ Machine learning approaches for predicting compounds that interact with therapeutic and ADMET mated proteins. Journal of Pharmaceutical Sciences 2007, 96, 2838–60. [DOI] [PubMed] [Google Scholar]
- 33.Hadjipavlou-Litina D; Garg R; Hansch C Comparative quantitative structure-activity relationship studies (QSAR) on non-benzodiazepine compounds binding to benzodiazepine receptor (BzR). Chemical Reviews 2004, 104, 3751–93. [DOI] [PubMed] [Google Scholar]
- 34.Verloop A; Hoogenstraaten W; Tipker J In Drug Design. New York, Academic Press, 1976. [Google Scholar]
- 35.Durbin J; Watson GS Testing for serial correlation in least squares regression. Biometrika, 1950, 37, 409–28. [PubMed] [Google Scholar]
- 36.Doweyko AM 3D-QSAR illusions. Journal of Computer-Aided Molecular Design 2004, 18, 587–96. [DOI] [PubMed] [Google Scholar]
- 37.Ponce YM; Garit JAC; Torrens F; Zaldivar VR; Castro EA Atom, atom-type, and total linear indices of the “molecular pseudograph’s atom adjacency matrix”: Application to QSPR/QSAR studies of organic compounds. Molecules, 2004, 9, 1100–23. [DOI] [PMC free article] [PubMed] [Google Scholar]
- 38.Anderssen E; Dyrstad K; Westad F; Martens H Reducing over-optimism in variable selection by cross-model validation. Chemometrics and Intelligent Laboratory Systems 2006, 84, 69–74. [Google Scholar]
- 39.Menichincheri M; Ballinari D; Bargiotti A; Bonomini L; Ceccarelli W; D’Alessio R; Fretta A; Moll J; Polucci P; Soncini C; Tibolla M; Trosset JY; Vanotti E Catecholic flavonoids acting as telomerase inhibitors. Journal of Medicinal Chemistry 2004, 47, 6466–75. [DOI] [PubMed] [Google Scholar]
- 40.Calcagnile O; Gisselsson D Telomere dysfunction and telomerase activation in cancer--a pathological paradox? Cytogenet Genome Res, 2007, 118, 270–76. [DOI] [PubMed] [Google Scholar]
- 41.Su B; Hackett JC; Diaz-Cruz ES; Kim YW; Brueggemeier RW Lead optimization of 7-benzyloxy 2-(4’-pyridylmethyl)thio isoflavone aromatase inhibitors. Bioorganic & Medicinal Chemistry 2005, 13, 6571–77. [DOI] [PubMed] [Google Scholar]
- 42.Delfourne E; Kiss R; Le Corre L; Dujols F; Bastide J; Collignon F; Lesur B; Frydman A; Darro F Synthesis and in vitro antitumor activity of phenanthrolin-7-one derivatives, analogues of the marine pyridoacridine alkaloids ascididemin and meridine: Structure-activity relationship. Journal of Medicinal Chemistry 2003, 46, 3536–45. [DOI] [PubMed] [Google Scholar]
- 43.Routier S; Peixoto P; Merour JY; Coudert G; Dias N; Bailly C; Pierre A; Leonce S; Caignard DH Synthesis and biological evaluation of novel naphthocarbazoles as potential anticancer agents. Journal of Medicinal Chemistry 2005, 48, 1401–13. [DOI] [PubMed] [Google Scholar]
- 44.Hollick JJ; Golding BT; Hardcastle IR; Martin N; Richardson C; Rigoreau LJM; Smith GCM; Griffin RJ 2,6-disubstituted pyran-4-one and thiopyran-4-one inhibitors of DNA-dependent protein kinase (DNA-PK). Bioorganic & Medicinal Chemistry Letters 2003, 13, 3083–86. [DOI] [PubMed] [Google Scholar]
- 45.Izzard RA; Jackson SP; Smith GCM Competitive and noncompetitive inhibition of the DNA-dependent protein kinase. Cancer Research, 1999, 59, 2581–86. [PubMed] [Google Scholar]
- 46.Leahy JJJ; Golding BT; Griffin RJ; Hardcastle IR; Richardson C; Rigoreau L; Smith GCM Identification of a highly potent and selective DNA-dependent protein kinase (DNA-PK) inhibitor (NU7441) by screening of chromenone libraries. Bioorganic & Medicinal Chemistry Letters 2004, 14, 6083–87. [DOI] [PubMed] [Google Scholar]
- 47.Hollick JJ; Rigoreau LJM; Cano-Soumillac C; Cockcroft X; Curtin NJ; Frigerio M; Golding BT; Guiard S; Hardcastle IR; Hickson I; Hummersone MG; Menear KA; Martin NMB; Matthews I; Newell DR; Ord R; Richardson CJ; Smith GCM; Griffin RJ Pyranone, thiopyranone, and pyridone inhibitors of phosphatidylinositol 3-kinase related kinases. Structure-activity relationships for DNA-dependent protein kinase inhibition, and identification of the first potent and selective inhibitor of the ataxia telangiectasia mutated kinase. Journal of Medicinal Chemistry 2007, 50, 1958–72. [DOI] [PubMed] [Google Scholar]
- 48.Phiel CJ; Wilson CA; Lee VMY; Klein PS GSK-3 alpha regulates production of Alzheimer’s disease amyloid-beta peptides. Nature, 2003, 423, 435–39. [DOI] [PubMed] [Google Scholar]
- 49.Smith DG; Buffet M; Fenwick AE; Haigh D; Ife RJ; Saunders M; Slingsby BP; Stacey R; Ward RW 3-anilino-4-arylmaleimides: Potent and selective inhibitors of glycogen synthase kinase-3 (GSK-3). Bioorganic & Medicinal Chemistry Letters 2001, 11, 635–39. [DOI] [PubMed] [Google Scholar]
- 50.Sivaprakasam P; Xie AH; Doerksen RJ Probing the physicochemical and structural requirements for glycogen synthase kinase-3 alpha inhibition: 2D-QSAR for 3-anilino-4-phenylmaleimides. Bioorganic & Medicinal Chemistry 2006, 14, 8210–18. [DOI] [PubMed] [Google Scholar]
- 51.Witherington J; Bordas V; Gaiba A; Garton NS; Naylor A; Rawlings AD; Slingsby BP; Smith DG; Takle AK; Ward RW 6-aryl-pyrazolo[3,4-b]pyridines: Potent inhibitors of glycogen synthase kinase-3 (GSK-3). Bioorganic & Medicinal Chemistry Letters 2003, 13, 3055–57. [DOI] [PubMed] [Google Scholar]
- 52.Agarwal A; Srivastava K; Puri SK; Chauhan PMS Synthesis of 2,4,6-trisubstituted pyrimidines as antimalarial agents. Bioorganic & Medicinal Chemistry 2005, 13, 4645–50. [DOI] [PubMed] [Google Scholar]
- 53.Baliani A; Bueno GJ; Stewart ML; Yardley V; Brun R; Barrett MP; Gilbert IH Design and synthesis of a series of melamine-based nitroheterocycles with activity against trypanosomatid parasites. Journal of Medicinal Chemistry 2005, 48, 5570–79. [DOI] [PubMed] [Google Scholar]
- 54.Maser P; Luscher A; Kaminsky R Drug transport and drug resistance in African trypanosomes. Drug Resistance Updates 2003, 6, 281–90. [DOI] [PubMed] [Google Scholar]
- 55.Cheng JF; Chen M; Wallace D; Tith S; Arrhenius T; Kashiwagi H; Ono Y; Ishikawa A; Sato H; Kozono T; Sato H; Nadzan AM Discovery and structure-activity relationship of coumarin derivatives as TNF-alpha inhibitors. Bioorganic & Medicinal Chemistry Letters 2004, 14, 2411–15. [DOI] [PubMed] [Google Scholar]
- 56.Bruhlmann C; Ooms F; Carrupt PA; Testa B; Catto M; Leonetti F; Altomare C; Carotti A Coumarins derivatives as dual inhibitors of acetylcholinesterase and monoamine oxidase. Journal of Medicinal Chemistry, 2001, 44, 3195–98. [DOI] [PubMed] [Google Scholar]
- 57.Boyd B Ongoing progress in the Alzheimer’s disease arena. Drug News Perspect, 2000, 13, 425–38. [PubMed] [Google Scholar]
- 58.Gnerre C; Catto M; Leonetti F; Weber P; Carrupt PA; Altomare C; Carotti A; Testa B Inhibition of monoamine oxidases by functionalized coumarin derivatives: Biological activities, QSARs, and 3D-QSARs. Journal of Medicinal Chemistry, 2000, 43, 4747–58. [DOI] [PubMed] [Google Scholar]
- 59.Epperson JR; Bruce MA; Catt JD; Deskus JA; Hodges DB; Karageorge GN; Keavy DJ; Mahle CD; Mattson RJ; Ortiz AA; Parker MF; Takaki KS; Watson BT; Yevich JP Chronobiotic activity of N-[2-(2,7-dimethoxyfluoren-9-yl)ethyllpropanamide. Synthesis and melatonergic pharmacology of fluoren-9-ylethyl amides. Bioorganic & Medicinal Chemistry 2004, 12, 4601–11. [DOI] [PubMed] [Google Scholar]
- 60.Lavey BJ; Kozlowski JA; Hipkin RW; Gonsiorek W; Lundell DJ; Piwinski JJ; Narula S; Lunn CA Triaryl bis-sulfones as a new class of cannabinoid CB2 receptor inhibitors: identification of a lead and initial SAR studies. Bioorganic & Medicinal Chemistry Letters 2005, 15, 783–86. [DOI] [PubMed] [Google Scholar]
- 61.Shankar BB; Lavey BJ; Zhou GW; Spitler JA; Tong L; Rizvi R; Yang DY; Wolin R; Kozlowski JA; Shih NY; Wu J; Hipkin RW; Gonsiorek W; Lunn CA Triaryl bis-sulfones as cannabinoid-2 receptor ligands: SAR studies. Bioorganic & Medicinal Chemistry Letters 2005, 15, 4417–20. [DOI] [PubMed] [Google Scholar]
- 62.Wang YG; Chackalamannil S; Hu ZY; Boyle CD; Lankin CM; Xia Y; Xu R; Asberom T; Pissarnitski D; Stamford AW; Greenlee WJ; Skell J; Kurowski S; Vemulapalli S; Palamanda J; Chintala M; Wu P; Myers J; Wang P Design and synthesis of xanthine analogues as potent and selective PDE5 inhibitors. Bioorganic & Medicinal Chemistry Letters 2002, 12, 3149–52. [DOI] [PubMed] [Google Scholar]
Associated Data
This section collects any data citations, data availability statements, or supplementary materials included in this article.