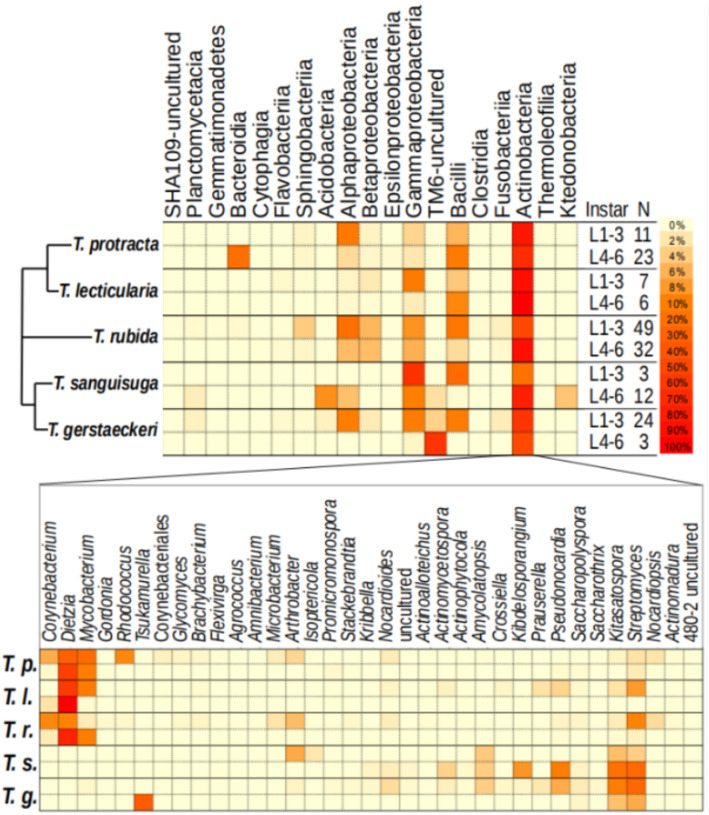
Fig. 2.
Microbiome profiles of five Triatoma species. The top heatmap representing the microbiome profile at order level for early and late instar ranges of all Triatoma species. The percentage of each taxon was calculated and normalised by the sum relative abundance per sample, divided by sample size (N). The simplified phylogenetic scheme for the five Triatoma species is based on Georgieva et al. [5] and Ibarra-Cerdeña et al. [82], indicating an uncertain position of T. rubida. The bottom heatmap represents the genus-level diversity found within the most abundant order (Actinobacteria) present in all species

