Abstract
Cognitive impairment (CI) is a major manifestation of multiple sclerosis (MS) and is responsible for extensively hindering patient quality of life. Cortical gray matter (cGM) damage is a significant contributor to CI, but is poorly characterized by conventional MRI let alone with quantitative MRI, such as quantitative magnetization transfer (qMT). Here we employed high-resolution qMT at 7T via the selective inversion recovery (SIR) method, which provides tissue-specific indices of tissue macromolecular content, such as the pool size ratio (PSR) and the rate of MT exchange (kmf). These indices could represent expected demyelination that occurs in the presence of gray matter damage. We utilized selective inversion recovery (SIR) qMT which provides a low SAR estimate of macromolecular-bulk water interactions using a tailored, B1 and B0 robust inversion recovery (IR) sequence acquired at multiple inversion times (TI) at 7T and fit to a two-pool model of magnetization exchange. Using this sequence, we evaluated qMT indices across relapsing-remitting multiple sclerosis patients (N = 19) and healthy volunteers (N = 37) and derived related associations with neuropsychological measures of cognitive impairment. We found a significant reduction in kmf in cGM of MS patients (15.5%, p = 0.002), unique association with EDSS (ρ = −0.922, p = 0.0001), and strong correlation with cognitive performance (ρ = −0.602, p = 0.0082). Together these findings indicate that the rate of MT exchange (kmf) may be a significant biomarker of cGM damage relating to CI in MS.
1. Introduction
Multiple sclerosis (MS) is a chronic disease of the central nervous system involving immune mediated inflammation, demyelination, and subsequent axonal damage. It is typically associated with loss in motor and sensory functions. However, it has been increasingly recognized that cognitive impairment is a significant, life-altering manifestation seen in all subtypes of MS. Cognitive impairment can hinder a patient’s day-today function as much as, or even more significantly, than motor dysfunction, and is a cause of many patients being unable to be gainfully employed. (Kobelt et al., 2019), (Messmer Uccelli et al., 2009) Other effects on daily life include decreased ability to be compliant with medications (Bruce et al., 2010), ability for self-care (Vahter et al., 2009), and the ability to drive safely (Schultheis et al., 2010). It is estimated that cognitive dysfunction affects 40–70% of patients with MS (Chiaravalloti and DeLuca, 2008). Domains of cognitive functions affected in MS are variable but typically include memory (Benedict et al., 2002), concentration and attention (Nebel et al., 2007), information processing speed and executive function (Drew et al., 2008), (Drew et al., 2009).
Cortical gray matter (cGM) health, which is central to retained cognitive performance, is damaged in patients with MS and concomitant cognitive impairment (Popescu and Lucchinetti, 2012), yet is unable to be adequately characterized by conventional T1- and T2-weighted MRI techniques. Recent reports have shown juxtacortical and cortical lesions using high field MRI; however, detailed assessment of cGM pathology using advanced, quantitative MRI has been lacking. (Kilsdonk et al., 2016), (Yao et al., 2014). We postulate that the lack of quantitative markers for GM damage in MS has hampered the evaluation of treatment, and hindered a greater understanding of the evolution of MS as it pertains to GM and cognitive impairment.
The bulk of MRI in the brain has been focused on the study of white matter (WM), mainly because of the relationship between damage to white matter pathways and neurological dysfunction (e.g. motor and sensory loss) (Reich et al., 2008). To characterize these neurological deficits, MRI studies in both the clinic and research settings have utilized semi-quantitative indices such as lesion load, lesion burden (Barkhof, 2004), (Comi et al., 1995), presence (or absence) of contrast enhancing lesions, and tissue atrophy (Zivadinov and Cox, 2007; Zivadinov and Leist, 2005). Despite the focus on WM, gray matter (GM) lesions can account for as much as 26% of the total number of brain lesions in patients with MS (Brownell and Hughes, 1962). In fact, while GM lesions have been reported to account for a significant fraction of brain lesions post-mortem, typically, GM atrophy is most often noted (and quantified). Unfortunately, cortical GM (cGM) lesions are difficult to detect using standard radiological techniques. cGM lesions are small relative to their WM counterparts, do not disrupt the blood brain barrier (van Horssen et al., 2007), are often less inflammatory (Peterson et al., 2001), and contribute very little to the overall MRI signal contrast (Filippi et al., 2012), (Popescu and Lucchinetti, 2012). While it is well established that MR spectroscopy (MRS) has shown neurochemical abnormalities in normal appearing cGM, MRS does not provide a measure of the complete GM burden in MS. It is desirable to design MRI evaluations that can survey the entire cortical GM ribbon at high enough resolution to ascertain region-specific changes that may subtend CI in patients with MS.
In the search for cGM involvement in MS, several advanced MRI techniques have been applied, such as double inversion recovery (DIR) (Calabrese et al., 2010), (Geurts et al., 2005), phase-sensitive inversion recovery (PSIR) (Nelson et al., 2011), and susceptibility-weighted imaging (SWI) (Dixon et al., 2013), (Yao et al., 2012). While these techniques have shown success in detecting GM lesions, they are not sensitive to underlying tissue composition and damage and do not offer quantitative indices of cGM health. Furthermore, these techniques often are not sensitive to cGM abnormalities in the absence of lesions (so-called normal appearing gray matter, NAGM).
While conventional MRI at lower field strengths is often insensitive to cGM pathology, recent advancements in ultra-high field strength (7T) MRI have provided alternative contrast mechanisms with which one can explore the spatial distribution of smaller lesions (Dixon et al., 2013), and even features of lesions unique to higher field strength MRI (e.g. perivascular lesions) and potentially abnormalities in NAGM. It is further suggested that in the absence of lesions, occult changes to tissue microstructure within the cGM are present in MS, and while cGM has less myelination than WM, myelin damage occurs with greater prevalence than has been currently described. One technique sensitive to tissue myelination (or demyelination) is magnetization transfer (MT). MT MRI exploits the exchange of off-resonance (with respect to water) RF irradiation between immobile, semi-solid protons (with short T2, ~μs) and the surrounding bulk water. The protons residing within semisolid lattic or associated with macromolecules are rotationally immobilized and thus can be selectively saturated through the application of an RF irradiation. Once saturated, the rotationally immobilized nature of these protons allows, through spin diffusion, the entire semi-solid proton pool to be saturated and through dipolar-exchange with the surrounding attenuate the observed water signal. Therefore, one can use MT imaging to indirectly observe macromolecular protons through their intimate relationship with surrounding water. MT MRI has been shown to be sensitive to the macromolecular composition of tissue (Henkelman et al., 2001) with the MT effect being dominated by myelin in the central nervous system (CNS). While MT imaging by itself is not specific for myelin changes, myelin concentration will alter the MT effect (Schmierer et al., 2004), and it does bear mention that the MT effect has been semi-quantitatively evaluated in cGM of patients with MS at lower field strengths. A couple of these studies demonstrated changes of variable significance in several cGM regions of patients early in the disease course, (Audoin et al., 2007), (Jure et al., 2010) while others were unable to detect MT evidence of disease involvement in NAGM. (Gallo et al., 2007)., (Sharma et al., 2006)
Conventionally, the MT effect is characterized by the MT ratio (MTR), which is a semiquantitative value defined as the ratio of the signals obtained with and without saturation. The MTR, however, is dependent on non-physiological parameters such as the pulse sequence design, field strength, and field inhomogeneity. Alternatively, quantitative MT (qMT) has been developed to obviate non-physiological dependencies to derive estimates of the exchange rate between the semi-solid and water “pools” and the pool size ratio (PSR), which is the ratio of the molar fraction of bound and free spins and has been shown to be sensitive to myelination (Ou et al., 2009). Many conventional qMT methods rely on high-power RF saturation pulses over a wide range of offset frequencies and a subsequent fit to a two-pool model (Smith et al., 2014). However, due to SAR restrictions and the high-power demand for saturation-based MT methods, alternative, inversion recovery based qMT has been developed by our group for 7T application. Specifically, the selective inversion recovery (SIR) qMT method utilizes a tailored inversion pulse designed to be relatively insensitive to B1 and B0 inhomogeneities (Dortch et al., 2013) followed by an efficient readout. SIR qMT is performed by obtaining data at multiple inversion times (TI, with the TI sampling space sufficient to sample the bi-exponential T1 recovery curve under MT) with a long inversion pulse on the order of the T2 of the bound pool. Data at multiple TIs are then fit to a two-pool model to derive the exchange rate (kmf) and pool size ratio (PSR) using the model given in (Gochberg and Gore, 2007).
To date, there have been no reports of qMT applied to the cGM at 7T, partly because of the long acquisition times, high power deposition, and low SNR. SIR is well suited to study the cGM at high-field due to its use of low power RF pulses that are tailored to minimize the impact of field inhomogeneities. The goals of this manuscript are to (1) implement a high-resolution SIR-based qMT method to study cGM in patients with MS and age- and gender-matched healthy controls and (2) evaluate the relationship between qMT derived indices and cognitive performance. We propose that qMT of cGM in MS will offer insight into the occult pathology that affects cGM in the absence of overt lesions.
2. Methods
2.1. Demographics
This study includes 37 healthy controls (age range 21–56, mean age 32; 25 females, 12 males) and 19 patients clinically diagnosed with relapsing-remitting MS with cognitive impairment either self-reported, or derived from exams by their attending physician in the Vanderbilt University Multiple Sclerosis Clinic (age range 30–43, mean age 38; 15 females, 4 males; EDSS range: 0–6, median EDSS: 1.5). The demographics of this study reflect the prevalence of MS being 2–3x greater in female populations. This study was approved by the local institutional review board and all participants provided signed, informed consent prior to cognitive assessment and MRI acquisition.
2.2. MRI acquisition and post-processing elements
All MRI data were obtained at 7T on a Philips Achieva scanner (Philips Medical Systems, Cleveland, OH USA) with a 2-channel volume transmit and 32-channel receive head coil (Nova Medical, Wilmington, MA USA). Anatomical/structural MRI scans were acquired for segmentation of cGM in addition to SIR qMT imaging. T1-weighted MPRAGE data were obtained in the axial plane at 1.1 × 1.1 × 1.1 mm3 resolution, with FOV = 256 × 256 mm2 over 138 slices. Other parameters were: TR/TI/TE = 2.8 ms/1300 ms/1.3 ms, SENSE = 2 (AP) x 2 (RL).
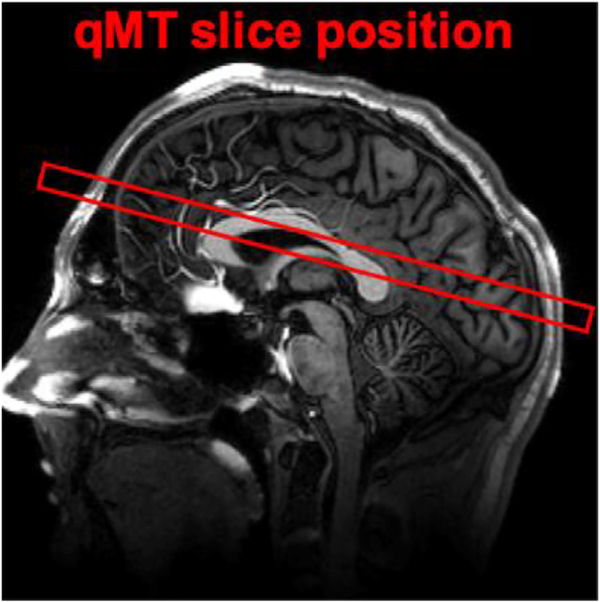
For SIR imaging, a long-T2-selective inversion recovery was performed with a 3D Turbo Field Echo (TFE factor = 54) readout at 1×1×2mm3 (FOV = 212 × 212 mm2) resolution covering 5 slices with no inter-slice gap (slice placement shown in Fig. 1) at 14 TI values (TI = 6, 10, 16, 26, 42, 68, 110, 178, 288, 468, 760, 1233, 2000, and 8000 ms), pre-delay time = 2500 ms (31), composite inversion pulse duration = 5.5 ms, TE = 2.2 ms, SENSE = 2. The composite inversion pulse consisted of 64 composite elements with amplitude and phase modulation and a resulting duration of 5.5 ms. The pulse was created to minimize the RF power deposited at 7T to minimize SAR. Details of the composite pulse can be found in Dortch et al. (2013) Total scan time was 10:11 min. Data analysis was performed in MATLAB (Mathworks, Natick, MA). In the fitting routine, SIR-TFE data (normalized to TI = 10s data) from each voxel was fit with a two-pool model (Equation (1)) including MT exchange using a least-squares with a subspace trust-region method. (Dortch et al., 2013).
| (1) |
where Mz is the z-component of the magnetization as a function of inverstion time (ti) and pre-delay time (td), Az is the z-component of the MT-modified exchange matrix, S is a diagonal matrix containing the inversion efficiency (Sf) and saturation of the macromolecular component (Sm), and M0 indicatese the starting conditions.
Fig. 1.
Location of 10mm thick slice shown above, composed of 5 adjacent 2mm slices with a slice gap of 0mm (partial brain coverage). The center of the volume was placed approximately 20mm above the anterior commissure – posterior commissure (AC-PC) line.
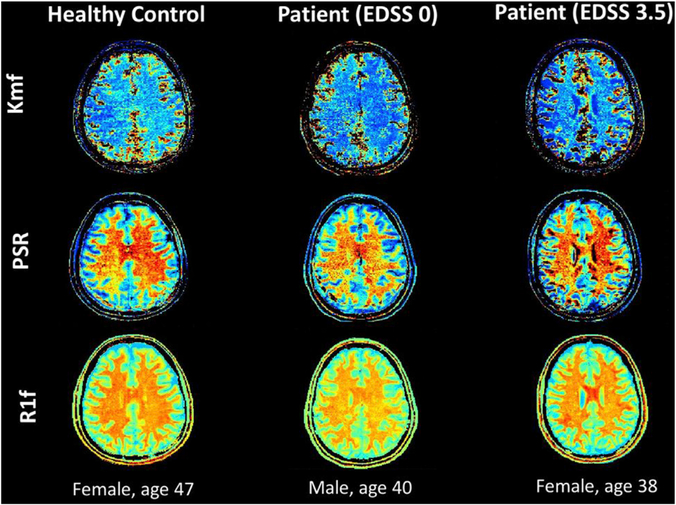
Three parameters were derived; PSR, rate of MT exchange (kmf), and longitudinal relaxation rate of the free water pool (R1f), (Fig. 2). All SIR data were co-registered to an acquired MPRAGE using a 12 degree of freedom affine transformation in FLIRT (FSL, Oxford UK).
Fig. 2.
Matlab generated maps for SIR qMT indices (kmf, PSR, R1f) for a subject from each cohort (healthy control, MS patient with low EDSS, MS patient with high EDSS), exhibiting visible changes most notably for the kmf measurement, consistent with numerical findings.
2.3. Segmentation
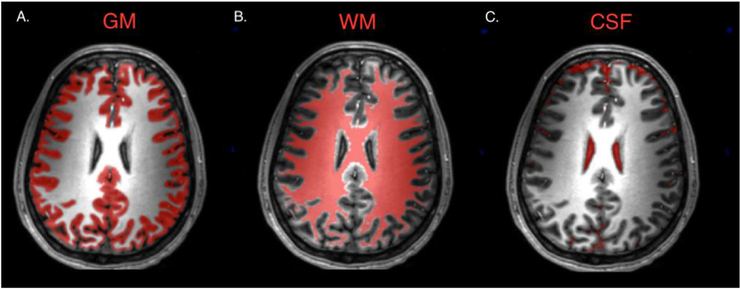
Acquired images were first segmented into WM, GM, and CSF regions. Segmentations were performed in SPM12 using the “Segment” tool which provided tissue maps for GM, WM, and CSF (Fig. 3). The default settings were modified to improve performance on the 7T T1w volumes, involving bias regularization set to “extremely light”, bias FWHM set to “30 mm cut-off”, and clean up procedure set to “thorough.” The bias-corrected T1w volumes were saved and subsequently co-registered to the qMT slices. Because lesions are not well observed in cGM, we did not include a classifier for cGM lesions.
Fig. 3.
Maps derived using SPM12 segment tool for gray matter (A), white matter (B), and cerebrospinal fluid (C) in a healthy control subject.
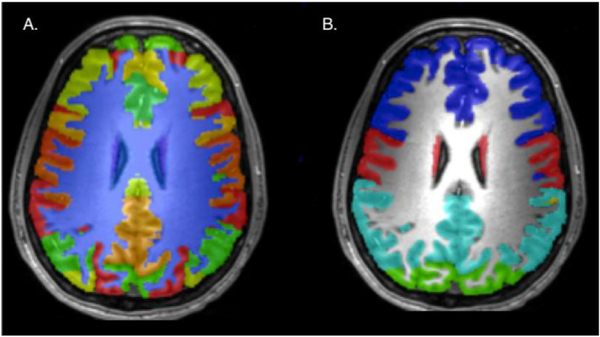
The T1w volumes then entered a multi-atlas segmentation. This process uses Multiple Atlases to perform segmentation of cortical and subcortical regions of the brain, uses label fusion to resolve “conflicts” that arise when all atlases do not agree, and creates ROI volumes for over 130 different regions in the brain. (Asman and Landman, 2014). These labels were further grouped into 7 major areas of GM; the prefrontal, parietal, occipital, temporal, motor, and somatosensory cortices, and subcortical regions. Masks were created for each of these 7 regions, and then multiplied by the SPM12-derived GM mask for each respective image (Fig. 4).
Fig. 4.
Maps derived from multi-atlas segmentation creating volumes for over 130 brain regions (A) and further grouped into 7 regions (B), blue = prefrontal, red = motor and somatosensory, teal = parietal, green = occipital.
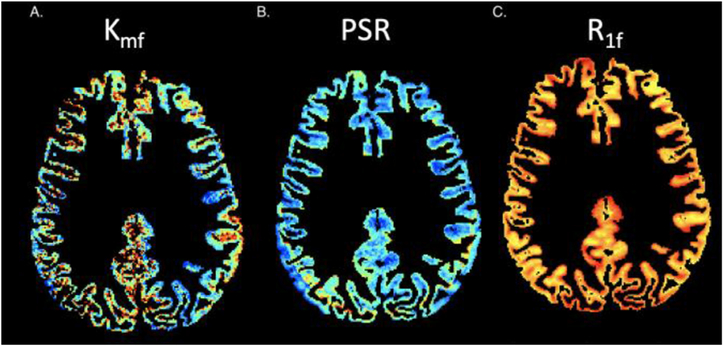
WM, GM, CSF, and regional GM masks were then applied to the maps for kmf, PSR, and R1f, derived from the SIR analysis. kmf, PSR, and R1f values were extracted for each region of interest (Fig. 5). This included total GM and WM regions and also GM divided into prefrontal, parietal, occipital, temporal, motor, somatosensory, and subcortical regions. Mean, median, standard deviation, pzero, and full-width half max (derived from histograms of each index) were determined for each index over all regions.
Fig. 5.
Gray matter maps applied to SIR qMT indices for kmf (A), PSR (B), R1f (C).
2.4. Statistical analysis
Two-sample, two-tailed parametric t-tests with unequal variances were used to compare healthy and patient cohorts for each descriptive statistic, for each qMT index, over each region of interest. The patient cohort was further separated into two groups based on clinical disability scores, low (EDSS ≤ 2), moderate (EDSS > 2), which were also compared with two-sample two-tailed t-tests with unequal variances. As this study sought to explore the relationships between various cortical areas and measures of cognitive impairment, correction for multiple comparisons was not performed.
Subjects underwent a series of neuropsychological tests to assess cognitive impairment. Components of the Minimal Assessment of Cognitive Function in MS (MACFIMS) (Benedict et al., 2002) were performed for each subject in addition to other cognitive tests. The battery of tests included a Symbol Digit Modality Test (SDMT, written format), Brief visuospatial memory test -Revised (BVMT- R), Buschke Selective Reminding Test, the Folstein Mini-Mental State Examination (MMSE), Paced Auditory Serial Addition Test (PASAT), Simple Reaction Time (SRT), Choice Reaction Time (CRT), Trail Making Test A and B, Global Deterioration Scale (GDS), and Brief Cognitive Rating Scale (BCRS). Cognitive testing lasted approximately 60 min and was administered prior to the MRI scan.
Correlations between qMT parameters and cognitive function measures were evaluated. A Pearson’s partial linear correlation controlling for age was used to evaluate associations between the cognitive test scores and the mean values for kmf, PSR, and R1f in each GM region. Lastly, each qMT-derived index for all GM was correlated with EDSS using Spearman’s correlation coefficient (ρ). Significance was determined by the p-value associated with the correlation statistic and p-values below 0.05 were deemed significant.
3. Results
3.1. Comparison Results
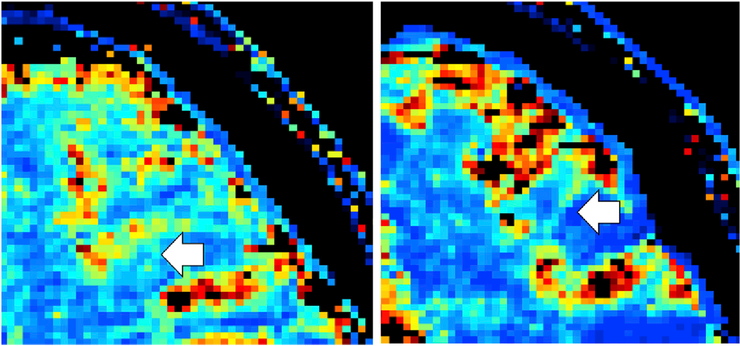
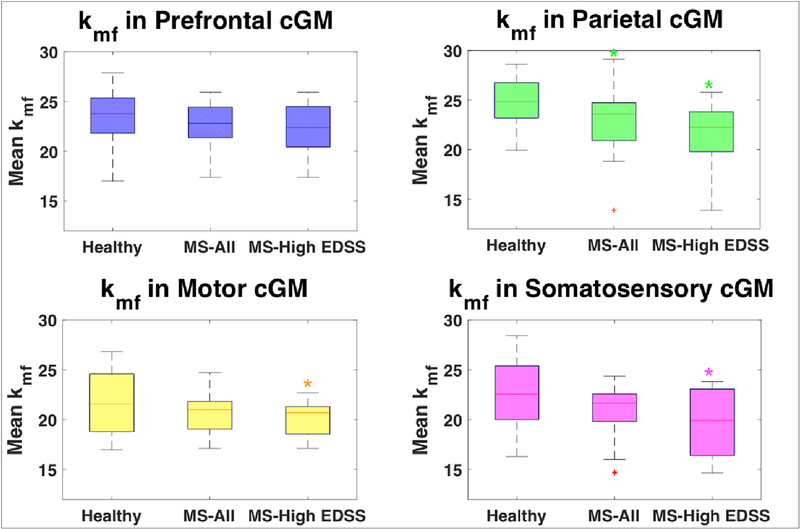
After performing all cross-cohort comparisons, we discovered that the rate of MT exchange, kmf, was uniquely the most significant indicator of disease. kmf was the only qMT-derived index that exhibited significant differences between the healthy control and patient cohorts. This finding is unique in that often in qMT analysis, the rate of MT exchange is either ignored or constrained. (Dortch et al., 2013), (Smith et al., 2009) MS patients showed ~6.5% reduction in mean kmf over all cGM voxels (p = 0.031), and ~7.8% reduction in median kmf in parietal cGM (p = 0.048) when compared to age-matched healthy controls. Significant reductions were found in all cGM regions (total, prefrontal, parietal, motor, and somatosensory) for mean kmf of MS patients when compared to the entire non-matched healthy control sample (7.9%, 5.9%, 9.1%, 9.0%, and 10.5%, respectively, Table 1). These reductions could also be identified visually. qMT kmf maps for individual subjects showed that contrast between gray and white matter is noticeably diminished in the patients with high disability scores (Fig. 6). Furthermore, when evaluating all cGM voxel values for the kmf maps of all subjects in each cohort, we found that the distribution for the patient cohort is shifted downward compared to the control group (Fig. 7, Fig. 8).
Table 1.
Comparisons of mean kmf value between several cohorts, all healthy control subjects vs. all MS patients (first column), age-matched healthy controls vs all MS patients (second column), age-matched healthy controls vs. MS patients with high disability (EDSS > 2) (third column), and MS patients with low disability (EDSS ≤ 2) vs MS patients with high disability (EDSS > 2) (fourth column). Significant reductions were found in the mean kmf value in total cGM volume for all cohort comparisons.
| Mean kmf Comparison |
HC (non-matched) vs. MS |
HC vs. MS |
HC vs. MS High Disability |
MS Low vs. High Disability |
||||
|---|---|---|---|---|---|---|---|---|
| cGM Region | Reduction | p-value | Reduction | p-value | Reduction | p-value | Reduction | p-value |
| Total | 7.93% | 0.003 | 6.54% | 0.03 | 15.47% | 0.0002 | 13.38% | 0.0008 |
| Prefrontal | 5.90% | 0.05 | 3.91% | 0.26 | 8.93% | 0.16 | 7.45% | 0.22 |
| Parietal | 9.11% | 0.02 | 7.80% | 0.05 | 22.70% | 0.003 | 21.98% | 0.004 |
| Motor | 9.03% | 0.009 | 5.68% | 0.15 | 13.13% | 0.008 | 11.13% | 0.01 |
| Sensory | 10.55% | 0.008 | 8.26% | 0.09 | 20.34% | 0.02 | 18.13% | 0.04 |
Comparison Results: kmf in Cortical Gray Matter Regions.
Fig. 6.
kmf maps for healthy control, female, age 47 (left) and patient, EDSS 3.5, female, age 38 (right). The white arrows point out how the contrast between the gray and white matter is very evident in the healthy control, but is highly diminished in the patient with high disability.
Fig. 7.
Box plots comparing mean kmf in cortical gray matter for each cohort (healthy controls, all MS patients, MS patients with high EDSS scores (>2)). Significant differences (indicated by *), were found for kmf in parietal, motor, and somatosensory regions for patients with high EDSS compared to healthy controls and for kmf in parietal lobe for all MS patients compared to healthy controls.
Fig. 8.
Overlaid histograms for values for every cGM voxel contained in all the healthy controls (blue) and all the patients (red) for qMT indices, kmf (left), PSR (middle), R1f (right). This demonstrates the deviation of the distribution of kmf values in the patient cohort. Correlation between kmf and Expanded Disability Status (EDSS).
The patients were divided between two groups based on EDSS scores with 13 patients in the low clinical disability group (EDSS ≤ 2) and 6 patients in the high clinical disability group (EDSS > 2). The cohort with low EDSS exhibited no significant differences in any of the derived parameters when compared to the control group. However, in the high EDSS group, the mean kmf in the total cGM was significantly reduced (−15.5%, p = 0.0002) compared to healthy controls. Additionally, the mean kmf was also reduced by 13.4% when compared to the low EDSS patient group (p = 0.0008). This finding was consistently observed in separate cGM regions: significant reductions in mean kmf of the parietal (−22.7%, p = 0.003), motor (−13.1%, p = 0.0077) and somatosensory (−20.3%, p = 0.023) cortices for patients with high disability when compared to age-matched healthy controls (Table 1).
The PSR in patients, contrary to expectation, trended towards being elevated in patients relative to healthy controls, although no differences were significant (Table 2). This is important to note since the expectation is that in demyelination, the PSR would be reduced and in regions where partial volume with CSF is pronounced (i.e. tissue atrophy), the PSR would also be reduced. The patients in the High EDSS cohort (EDSS > 2) did exhibit an increased mean PSR in the motor cGM (~12%, p = 0.018) when compared to age-matched healthy controls. There were no significant differences between the patients and controls for the R1f indices for the overall cGM or for any of the cGM regions.
Table 2.
Comparisons of mean PSR value between several cohorts, all healthy control subjects vs. all MS patients (first column), age-matched healthy controls vs all MS patients (second column), age-matched healthy controls vs. MS patients with high disability (EDSS > 2) (third column), and MS patients with low disability (EDSS ≤ 2) vs. MS patients with high disability (EDSS > 2) (fourth column). A significant reduction was only found for PSR in the motor region when comparing age-matched healthy controls to MS patients with high disability.
| Mean PSR Comparison |
HC (non-matched) vs. MS |
HC vs. MS |
HC vs. MS High Disability |
MS Low vs. High Disability |
||||
|---|---|---|---|---|---|---|---|---|
| cGM Region | Reduction | p-value | Reduction | p-value | Reduction | p-value | Reduction | p-value |
| Total | −4.31% | 0.15 | −6.12% | 0.11 | −7.09% | 0.13 | −1.34% | 0.72 |
| Prefrontal | −3.70% | 0.29 | −4.84% | 0.26 | −5.60% | 0.41 | −1.06% | 0.86 |
| Parietal | −5.54% | 0.10 | −7.48% | 0.07 | −9.44% | 0.10 | −2.68% | 0.58 |
| Motor | −4.93% | 0.20 | −9.08% | 0.06 | −12.10% | 0.02 | −4.10% | 0.37 |
| Sensory | −6.06% | 0.12 | −8.27% | 0.09 | −12.40% | 0.06 | −5.66% | 0.33 |
Comparison Results: PSR in Cortical Gray Matter Regions.
No significant results were found when comparing the mean kmf and mean PSR values of the total white matter masks in the control and patient cohorts (Table 3).
Table 3.
Comparisons of mean kmf value (top) and PSR value (bottom) between several cohorts, all healthy control subjects vs. all MS patients (first column), age-matched healthy controls vs all MS patients (second column), age-matched healthy controls vs. MS patients with high disability (EDSS > 2) (third column), and MS patients with low disability (EDSS ≤ 2) vs MS patients with high disability (EDSS > 2) (fourth column). No significant reductions were found.
| kmf | |||||||
| HC (non-matched) vs. MS |
HC vs. MS |
HC vs. MS High Disability |
MS Low vs. High Disability |
||||
| Reduction | p-value | Reduction | p-value | Reduction | p-value | Reduction | p-value |
| −7.17% | 0.98 | −0.86% | 0.83 | −6.17% | 0.44 | −2.85% | 0.78 |
| PSR | |||||||
| HC (non-matched) vs. MS |
HC vs. MS |
HC vs. MS High Disability |
MS Low vs. High Disability |
||||
| Reduction | p-value | Reduction | p-value | Reduction | p-value | Reduction | p-value |
| 0.53% | 0.95 | −0.35% | 0.95 | 3.05% | 0.60 | 1.84% | 0.80 |
Comparison Results: kmf and PSR in Total White Matter Region.
3.2. Correlation Results
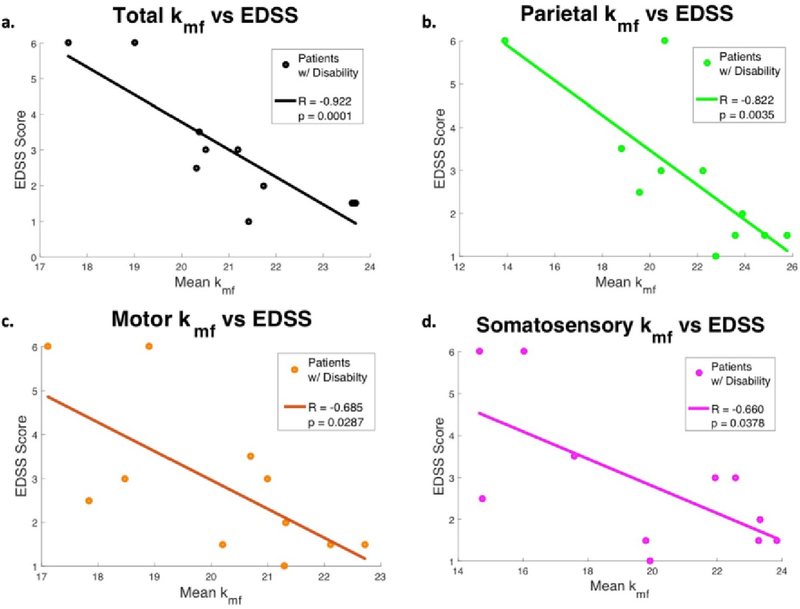
The mean kmf derived from the total cGM in the patient cohort was strongly correlated with EDSS (ρ = −0.79, p = 0.0001), as were kmf values for other cortical regions (Table 4, Fig. 9). When examining the patients with established disability (EDSS > 0), correlations were stronger (ρ = −0.922, p = 0.0001), which supports the hypothesis that kmf of cGM may offer insight into the overall disability in MS.
Table 4.
Correlations between mean kmf values and EDSS, CRT, PASAT, and SDMT scores for cohort of all MS patients, patients with established disability (EDSS >0), and the combined cohort of all healthy controls and all MS patients. Correlations were highest for EDSS scores in the MS patients with disability.
| Correlation Statistic |
kmf Region | MS Patients All |
MS Patients EDSS >0 |
Healthy Controls and MS Patients |
|||
|---|---|---|---|---|---|---|---|
| Clinical Measure | ρ | p | ρ | p | ρ | P | |
| EDSS | Total | −0.79 | <0.0001 | −0.92 | 0.0001 | ||
| Prefrontal | −0.49 | 0.04 | −0.61 | 0.06 | |||
| Parietal | −0.78 | 0.0001 | −0.82 | 0.004 | |||
| Motor | −0.54 | 0.02 | −0.69 | 0.03 | |||
| Sensory | −0.65 | 0.003 | −0.66 | 0.04 | |||
| CRT | Total | −0.60 | 0.008 | −0.62 | 0.06 | −0.53 | 0.0007 |
| Prefrontal | −0.26 | 0.30 | −0.10 | 0.78 | −0.30 | 0.07 | |
| Parietal | −0.56 | 0.02 | 0.55 | 0.10 | −0.51 | 0.001 | |
| Motor | −0.62 | 0.006 | 0.54 | 0.11 | −0.39 | 0.02 | |
| Sensory | −0.75 | 0.0003 | −0.76 | 0.01 | −0.53 | 0.0007 | |
| PASAT | Total | 0.24 | 0.33 | 0.11 | 0.76 | 0.31 | 0.06 |
| Prefrontal | 0.52 | 0.03 | 0.68 | 0.03 | 0.34 | 0.04 | |
| Parietal | 0.09 | 0.73 | −0.21 | 0.56 | 0.23 | 0.18 | |
| Motor | 0.12 | 0.63 | −0.26 | 0.46 | 0.15 | 0.39 | |
| Sensory | 0.12 | 0.65 | −0.21 | 0.56 | 0.23 | 0.17 | |
| SDMT | Total | 0.41 | 0.09 | 0.63 | 0.05 | 0.54 | 0.0006 |
| Prefrontal | 0.38 | 0.12 | 0.45 | 0.19 | 0.44 | 0.007 | |
| Parietal | 0.31 | 0.22 | 0.46 | 0.18 | 0.44 | 0.006 | |
| Motor | 0.31 | 0.22 | 0.36 | 0.31 | 0.41 | 0.01 | |
| Sensory | 0.46 | 0.06 | 0.46 | 0.18 | 0.49 | 0.002 | |
Correlation Results: cGM kmf.
Fig. 9.
In cohort of patients with disability (EDSS >0), the mean kmf value in all cortical gray matter (1), parietal (2), motor (3), and somatosensory (4) regions were found to be significantly correlated with patient EDSS scores. Correlation between kmf and Choice Reaction Time (CRT).
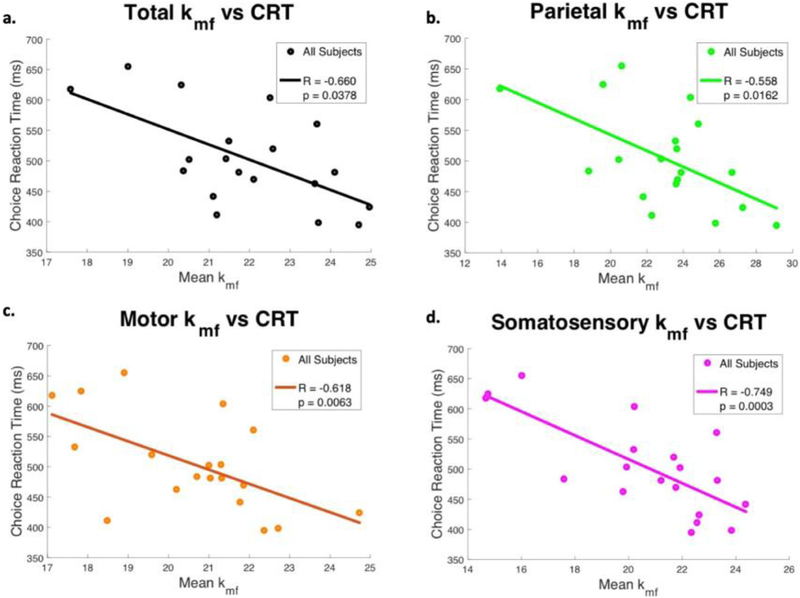
Beyond associations with EDSS, kmf was significantly associated with several cognitive tests. In patients, kmf prominently correlated with Choice Reaction Time for total cGM as well as the parietal, motor, and somatosensory cortices (ρ = −0.60, ρ = −0.56, ρ = −0.62, and ρ = −0.75 respectively, Table 4, Fig. 10), with highest correlations in the somatosensory regions for the patient cohort. Although kmf in the prefrontal cGM did not correlate with CRT, it did significantly correlate with the PASAT (ρ = 0.524, p = 0.026) and Trail Making Test A (ρ = −0.521, p = 0.026).
Fig. 10.
In the cohort of all MS patients, the mean kmf value in all cortical gray matter (1), parietal (2), motor (3), and somatosensory (4) regions were found to be significantly correlated with patient CRT scores.
The examination of the healthy and patient cohorts grouped together revealed additional associations. CRT demonstrated similar results for the combined cohort as scores for this test were also significantly associated with total, parietal, and somatosensory cGM kmf. Moreover, SDMT exhibited significant correlations in every region, including total, prefrontal, parietal, motor, and somatosensory cortices (Table 4). TMT-A also showed significant correlations in total, prefrontal, parietal, and somatosensory cortices, but with relatively low correlation coefficients of less than 0.5. As was observed in the patient cohort, PASAT scores in the combined cohort only showed significant correlation with kmf in the prefrontal region. However, this correlation coefficient was low as well (ρ = 0.344, p = 0.0369).
The PSR, while elevated in some cortical regions, showed a limited correlation with cognitive tests. In addition, the PSR and its associations with cognitive impairment showed an opposite trend to kmf, where a higher PSR indicated a higher degree of cognitive impairment. These correlations were evident in the motor and somatosensory cortices, where PSR in the patient cohort showed positive significant correlation with CRT (ρ = 0.63, p = 0.005; ρ = 0.65, p = 0.004 respectively), and PSR in the prefrontal cortex for patients with EDSS > 0 showed negative significant correlations with PASAT (ρ = − 0.79, p = 0.007).
4. Discussion
We show, for the first time, high-field (7T) selective inversion recovery (SIR) qMT data from cortical gray matter in patients with MS. Importantly, we show that qMT-derived indices of the rate of MT exchange differ between patients and healthy controls and correlate well with cognitive performance. Lastly, we do not show any evidence that the PSR is reduced in accordance with expected myelin loss in cortical GM in these MS patients using high field qMT.
Often, kmf is ignored in qMT analysis or seen as a covariate of the PSR. This is likely due to the fact that most MT studies of the brain, especially in MS, focus on white matter integrity and the sensitivity of MT to myelin changes. In this study, we focused on acquiring a selective inversion recovery (SIR)-based qMT approach which minimizes the impact of B1 and B0 inhomogeneity, while providing an estimation of both the exchange rate and pool size ratio. Additionally, we utilized a high-resolution (1 mm × 1 mm in-plane) qMT measurement to reduce the impact of partial volume effects. When examining cortical gray matter, however, we found a significant reduction in kmf in cGM of MS patients using SIR qMT, unique association with EDSS score, and strong correlation with cognitive performance indicating that kmf may be an important, yet understudied, biomarker of GM damage in MS and should not be ignored when performing conventional qMT analysis. It should be pointed out that we did not perform a correction for multiple comparisons, however 15/20 comparisons performed showed significance which would be unlikely purely by chance at the α = 0.05 level.
The pool size ratio (PSR) has been shown to be a surrogate marker for myelin content and thus, would be expected to be lower for patients with MS. However, our results showed that PSR values in the GM were higher (though not significantly so) in the patient cohort when compared to the healthy controls. We immediately considered that the PSR may be altered due to partial volume effects, which we sought to minimize with segmentation, however, if PSR is partial volume with respect to CSF, then one would expect a biased reduction in the PSR. In contrast, elevated PSR may be accounted for with partial volume contacts with surrounding white matter.
The exchange rate, kmf, has been understudied with conventional MT acquisitions. It can, however, be thought of as a surrogate marker of the health of myelin integrity or the extent of tissue disruption (Filippi et al., 2012). Biophysically, a reduction on the rate of MT exchange can be a result of inhibited or inefficient transfer of spin information between the macromolecular constituents and surrounding water, or a reduced rate of spin-diffusion throughout the semi-solid lattice. Each of these cases points to questions regarding the “intactness” of the macromolecular pool and its relative exchange with surrounding water. We hypothesize that these indices are sensitive to the microstructural changes associated with the disease load and progression of MS in the cell body (rather than myelin loss) and reflect pathologic features such as disruption of myelin, though not a loss of myelin. (Fischer et al., 2013), (Mahad et al., 2015) Previous work in animal models of MS has shown that PSR correlates with myelin content, while kmf does not. This is consistent with our more recent findings in post-mortem human brain at 7T (Bagnato et al., 2018), where we did not observe differences in kmf between lesions and NAWM. We did, however, observe significant differences in PSR between these same lesions and NAWM that were driven by demyelination, as confirmed via histology. In other words, the kmf-specific contrast we observe herein in cGM is unlikely to be driven by changes in myelin content based upon these previous findings.
Furthermore, it is interesting to consider that the rate of MT exchange was associated with different aspects of cognitive performance. Each of the cognitive tests performed were sensitive to different cognitive processes and this was reflected by the varying associations of kmf in specific cortical regions. The goal of the Choice Reaction Time is to test for information processing and motor speed, a function that is associated with the somatosensory regions. Thus, the high correlation between kmf in somatosensory regions specifically and CRT suggests that kmf could be used as a localized biomarker for GM damage and subsequent concomitant cognitive impairment. CRT also correlated with kmf in the parietal and motor cortex regions which is in agreement with the expected involvement of visual-spatial attention and motor speed, respectively, in this task.
The PASAT evaluates auditory information processing speed and flexibility, calculation ability, and working memory. The PASAT has traditionally been used as the main cognitive component of the Multiple Sclerosis Functional Composite (MSFC). However, its administration is often criticized for being associated with psychological stress and agitation (Drake et al., 2010). PASAT scores were uniquely associated with kmf in prefrontal GM. The prefrontal region is responsible for executive functions, such as planning, prioritizing, decision making, and moderating social behavior. Although the PASAT is designed to measure processing speed and working memory in the auditory/verbal sphere, the correlation with kmf in the prefrontal cortex suggest that the PASAT may be more reflective of the subjects’ ability to plan, prioritize, and moderate behavior under stress and pressure. The Symbol Digit Modality Test provides another measure of processing speed and working memory, but in the visual modality and is frequently used, along with the PASAT, to test for cognitive impairment in MS. The significant correlations between SDMT and kmf in all cortical regions for the combined cohort further support the usefulness of kmf in quantifying cognitive disability.
There are some limitations to our study. First, we used automatic segmentation of the brain to isolate the GM from the white matter. In some cases, where atrophy is more prevalent, this resulted in only a few voxels contributing to the overall signal in each cognitively relevant cortical region. While we believe this is still a representation of the overall signal (due to the lack of downward bias in PSR resulting from partial volume effects), some criticism could be that segmentation in atrophic regions or regions of GM/WM pallor could result in an under/overestimation of the median values from each qMT derived index. Additionally, while SIR-based qMT provides correction and robustness to B1 and B0 inhomogeneity, it is possible that some remaining inhomogeneity could contribute to the observed signals. Future studies would make use of B1 and B0 correction algorithms to mitigate these concerns further. A further limitation is that the qMT that we deployed at 7T is only a few slices and does not cover the whole brain. Recent work performed by Dortch et al. (2018) has shown the ability to utilize alternative readouts and constraining the MT parameters to acquire greater coverage in the same amount of scan time. However, the drawback of this approach is that it fixes the rate of MT exchange and thus, in accordance with the observation herein, would not provide insight into the change of the rate of MT exchange being a readout of gray matter pathology. Another limitation of our study is that we did not perform sequences that have been tailored for detection of cortical lesions therefore, we were unable to evaluate whether or not cortical lesions play a role in determining cognitive impairment in concert or independent from qMT-derived indices. A further study would provide estimates of cortical lesions in addition to greater coverage of the qMT acquisition to generate a more comprehensive assessment of cGM damage. Lastly, our patient cohort is relatively small (N = 19) with limited range of disabilities as measured by EDSS. We note that this cohort does not reflect a large heterogeneous cohort, both in terms of disability and cognitive performance. However, we do point out that even with limited EDSS range, cognitive impairment may be prevalent and we have shown that when including patients with EDSS = 0, an association with cognitive performance is still significant. Additionally, kmf in the parietal cortex in particular correlated strongly with EDSS, which is in agreement with a recent study demonstrating damage in this critical cGM region in the early stages of MS (EDSS<4). (Righart et al., 2017). Further, larger studies are planned to evaluate the sensitivity of qMT to cortical gray matter pathology in a cohort with greater dynamic range.
Repeatability/Reliability
We did not perform repeatability studies or evaluate scan-rescan measurements in this particular cohort of healthy volunteers or patients with MS. We recognize the importance of establishing reproducibility and reliability for each study that is performed, and in this case, the absence of within-sample repeatability estimates is a limitation of our study. We had two justifications for not measuring reproducibility in this study: (1) our group has measured the reliability of the SIR-qMT indices in both healthy and RRMS cohorts using similar methods, hardware and software in two previous publications (Dortch et al., 2013; Bagnato et al., 2018), and (2) we focused here on cross-sectional analysis of an MS cohort and the relationship between cGM qMT and measures of cognitive impairment. Considering (1), in healthy volunteers, our group showed that the test-retest variation is less than the cross-sectional, intra-cohort variability indicating reliability of the method over time (Dortch et al., 2013). In a similar cohort to those patients presented here (patients with RRMS, average EDSS = 1.5), test-retest reliability showed an average coefficient of variation of 5.6% and 11.4% (average relative difference over time = 0.5%, 4%) for PSR and kmf, respectively (Bagnato et al., 2018). It is important to note, however, that without test-retest assessment in this particular cohort, it is not possible to determine the lower limit of detection for future longitudinal studies. There are two other sources of variability that could impact the measuresments presented. Our previous work assessed reliability in a coarse way over ROI’s that are, in some cases, larger than the cGM ROI’s presented here and the smaller ROI’s used in this study could be a source of increased variability. Secondly, the focus here is on the associations between qMT-drived kmf and measures of cognitive impairment. The measures of cognitive impairment also contains variability across time, which was not modeled or studied in our manuscript, though has been presented in the literature many times (Woods et al., 2015; Lapshin et al., 2013). We expect that lower reliability in individual measurements - both qMT-derived kmf and cognitive scores - would lead to reduced detectability of the correlations of interst, not to spurious apparent associations. A future study would seek to assess the variability in both healthy volunteers and patients with MT for qMT-derived indicies, fully optimized for cGM deployment. Lastly, when performing multi-exponential fitting, the model can be ill-posed. One benefit of the SIR fitting is that the rate constants differ by an order of magnitude which provide stability to the model. We have previously shown (Gochberg and Gore, 2007) that the fast rate constant is ~ kmf (10 s−1), while the slow rate constant is ~ R1f (1 s−1).
7T qMT has not been often studied in MS patients and those studies focusing on MT in MS often examine the changes to the white matter and in areas around and within lesions. We present for the first time a method to understand damage to the cGM and its relationship to cognition using advanced, quantitative MT deployed at 7T to take advantage of the increased SNR for higher resolution compared to what is typically obtained with qMT of the brain. Further, the qMT-derived rate of MT exchange is associated with cognitive performance deficits and shows differences between healthy volunteers and patients with MS.
Acknowledgements
We would like to thank the MRI technologists at Vanderbilt University Institute of Imaging Science: Ms. Leslie McIntosh, Ms. Clair Jones, Ms. Kristen George-Durrett, Mr. Chris Thompson, and Mr. Dave Pennell. We would also like to acknowledge the funding sources: Department of Defense (W81XWH-13-0073), the National MS Society (RG-1501-02840), the Conrad N. Hilton Foundation, NIH/NINDS R21NS087465-01, NIH/NINDS 1F32NS101788. We would also like to thank the participants in this study for their exceptional willingness to participate.
References
- Asman AJ, Landman BA, 2014. Hierarchical performance estimation in the statistical label fusion framework. Med. Image Anal 18 (7), 1070–1081. [DOI] [PMC free article] [PubMed] [Google Scholar]
- Audoin B, et al. , 2007. Voxel-based analysis of grey matter magnetization transfer ratio maps in early relapsing remitting multiple sclerosis. Mult. Scler 13 (4), 483–489. [DOI] [PubMed] [Google Scholar]
- Bagnato F, et al. , 2018. Selective inversion recovery quantitative magnetization transfer brain MRI at 7T: clinical and postmortem validation in multiple sclerosis. J. Neuroimaging 28 (4), 380–388. [DOI] [PMC free article] [PubMed] [Google Scholar]
- Barkhof F, 2004. Assessing treatment effects on axonal loss–evidence from MRI monitored clinical trials. J. Neurol 251 (Suppl. 4), IV6–12. [DOI] [PubMed] [Google Scholar]
- Benedict RH, et al. , 2002. Minimal neuropsychological assessment of MS patients: a consensus approach. Clin. Neuropsychol 16 (3), 381–397. [DOI] [PubMed] [Google Scholar]
- Brownell B, Hughes JT, 1962. The distribution of plaques in the cerebrum in multiple sclerosis. J. Neurol. Neurosurg. Psychiatry 25, 315–320. [DOI] [PMC free article] [PubMed] [Google Scholar]
- Bruce JM, et al. , 2010. Treatment adherence in multiple sclerosis: association with emotional status, personality, and cognition. J. Behav. Med 33 (3), 219–227. [DOI] [PubMed] [Google Scholar]
- Calabrese M, Filippi M, Gallo P, 2010. Cortical lesions in multiple sclerosis. Nat. Rev. Neurol 6 (8), 438–444. [DOI] [PubMed] [Google Scholar]
- Chiaravalloti ND, DeLuca J, 2008. Cognitive impairment in multiple sclerosis. Lancet Neurol 7 (12), 1139–1151. [DOI] [PubMed] [Google Scholar]
- Comi G, et al. , 1995. Brain MRI correlates of cognitive impairment in primary and secondary progressive multiple sclerosis. J. Neurol. Sci 132 (2), 222–227. [DOI] [PubMed] [Google Scholar]
- Dixon JE, et al. , 2013. Optimisation of T(2)*-weighted MRI for the detection of small veins in multiple sclerosis at 3 T and 7 T. Eur. J. Radiol 82 (5), 719–727. [DOI] [PubMed] [Google Scholar]
- Dortch RD, et al. , 2013. Quantitative magnetization transfer imaging of human brain at 7 T. Neuroimage 64, 640–649. [DOI] [PMC free article] [PubMed] [Google Scholar]
- Dortch RD, et al. , 2018. Optimization of selective inversion recovery magnetization transfer imaging for macromolecular content mapping in the human brain. Magn. Reson. Med 80 (5), 1824–1835. [DOI] [PMC free article] [PubMed] [Google Scholar]
- Drake AS, et al. , 2010. Psychometrics and normative data for the multiple sclerosis functional composite: replacing the PASAT with the Symbol Digit modalities test. Mult. Scler 16 (2), 228–237. [DOI] [PubMed] [Google Scholar]
- Drew M, et al. , 2008. Executive dysfunction and cognitive impairment in a large community-based sample with Multiple Sclerosis from New Zealand: a descriptive study. Arch. Clin. Neuropsychol 23 (1), 1–19. [DOI] [PubMed] [Google Scholar]
- Drew MA, Starkey NJ, Isler RB, 2009. Examining the link between information processing speed and executive functioning in multiple sclerosis. Arch. Clin. Neuropsychol 24 (1), 47–58. [DOI] [PubMed] [Google Scholar]
- Filippi M, et al. , 2012. Association between pathological and MRI findings in multiple sclerosis. Lancet Neurol 11 (4), 349–360. [DOI] [PubMed] [Google Scholar]
- Fischer MT, et al. , 2013. Disease-specific molecular events in cortical multiple sclerosis lesions. Brain 136 (Pt 6), 1799–1815. [DOI] [PMC free article] [PubMed] [Google Scholar]
- Gallo A, et al. , 2007. A brain magnetization transfer MRI study with a clinical follow up of about four years in patients with clinically isolated syndromes suggestive of multiple sclerosis. J. Neurol 254 (1), 78–83. [DOI] [PubMed] [Google Scholar]
- Geurts JJ, et al. , 2005. Intracortical lesions in multiple sclerosis: improved detection with 3D double inversion-recovery MR imaging. Radiology 236 (1), 254–260. [DOI] [PubMed] [Google Scholar]
- Gochberg DF, Gore JC, 2007. Quantitative magnetization transfer imaging via selective inversion recovery with short repetition times. Magn. Reson. Med 57 (2), 437–441. [DOI] [PMC free article] [PubMed] [Google Scholar]
- Henkelman RM, Stanisz GJ, Graham SJ, 2001. Magnetization transfer in MRI: a review. NMR Biomed 14 (2), 57–64. [DOI] [PubMed] [Google Scholar]
- Jure L, et al. , 2010. Individual voxel-based analysis of brain magnetization transfer maps shows great variability of gray matter injury in the first stage of multiple sclerosis. J. Magn. Reson. Imaging 32 (2), 424–428. [DOI] [PubMed] [Google Scholar]
- Kilsdonk ID, et al. , 2016. Increased cortical grey matter lesion detection in multiple sclerosis with 7 T MRI: a post-mortem verification study. Brain 139 (Pt 5), 1472–1481. [DOI] [PubMed] [Google Scholar]
- Kobelt G, Langdon D, Jonsson L, 2019. The effect of self-assessed fatigue and subjective cognitive impairment on work capacity: the case of multiple sclerosis. Mult. Scler 25 (5), 740–749. [DOI] [PMC free article] [PubMed] [Google Scholar]
- Lapshin H, et al. , 2013. Assessing the validity of a computer-generated cognitive screening instrument for patients with multiple sclerosis. Mult. Scler 19 (14), 1905–1912. [DOI] [PubMed] [Google Scholar]
- Mahad DH, Trapp BD, Lassmann H, 2015. Pathological mechanisms in progressive multiple sclerosis. Lancet Neurol 14 (2), 183–193. [DOI] [PubMed] [Google Scholar]
- Messmer Uccelli M, et al. , 2009. Factors that influence the employment status of people with multiple sclerosis: a multi-national study. J. Neurol 256 (12), 1989–1996. [DOI] [PubMed] [Google Scholar]
- Nebel K, et al. , 2007. Activity of attention related structures in multiple sclerosis patients. Brain Res 1151, 150–160. [DOI] [PubMed] [Google Scholar]
- Nelson F, et al. , 2011. Intracortical lesions by 3T magnetic resonance imaging and correlation with cognitive impairment in multiple sclerosis. Mult. Scler 17 (9), 1122–1129. [DOI] [PMC free article] [PubMed] [Google Scholar]
- Ou X, et al. , 2009. Quantitative magnetization transfer measured pool-size ratio reflects optic nerve myelin content in ex vivo mice. Magn. Reson. Med 61 (2), 364–371. [DOI] [PMC free article] [PubMed] [Google Scholar]
- Peterson JW, et al. , 2001. Transected neurites, apoptotic neurons, and reduced inflammation in cortical multiple sclerosis lesions. Ann. Neurol 50 (3), 389–400. [DOI] [PubMed] [Google Scholar]
- Popescu BF, Lucchinetti CF, 2012. Meningeal and cortical grey matter pathology in multiple sclerosis. BMC Neurol 12, 11. [DOI] [PMC free article] [PubMed] [Google Scholar]
- Reich DS, et al. , 2008. Corticospinal tract abnormalities are associated with weakness in multiple sclerosis. AJNR Am J Neuroradiol 29 (2), 333–339. [DOI] [PMC free article] [PubMed] [Google Scholar]
- Righart R, et al. , 2017. Cortical pathology in multiple sclerosis detected by the T1/T2-weighted ratio from routine magnetic resonance imaging. Ann. Neurol 82 (4), 519–529. [DOI] [PMC free article] [PubMed] [Google Scholar]
- Schmierer K, et al. , 2004. Magnetization transfer ratio and myelin in postmortem multiple sclerosis brain. Ann. Neurol 56 (3), 407–415. [DOI] [PubMed] [Google Scholar]
- Schultheis MT, et al. , 2010. Examining the relationship between cognition and driving performance in multiple sclerosis. Arch. Phys. Med. Rehabil 91 (3), 465–473. [DOI] [PubMed] [Google Scholar]
- Sharma J, et al. , 2006. A magnetization transfer MRI study of deep gray matter involvement in multiple sclerosis. J. Neuroimaging 16 (4), 302–310. [DOI] [PubMed] [Google Scholar]
- Smith SA, et al. , 2009. Quantitative magnetization transfer characteristics of the human cervical spinal cord in vivo: application to adrenomyeloneuropathy. Magn. Reson. Med 61 (1), 22–27. [DOI] [PMC free article] [PubMed] [Google Scholar]
- Smith AK, et al. , 2014. Rapid, high-resolution quantitative magnetization transfer MRI of the human spinal cord. Neuroimage 95, 106–116. [DOI] [PMC free article] [PubMed] [Google Scholar]
- Vahter L, et al. , 2009. Clean intermittent self-catheterization in persons with multiple sclerosis: the influence of cognitive dysfunction. Mult. Scler 15 (3), 379–384. [DOI] [PubMed] [Google Scholar]
- van Horssen J, et al. , 2007. The blood-brain barrier in cortical multiple sclerosis lesions. J. Neuropathol. Exp. Neurol 66 (4), 321–328. [DOI] [PubMed] [Google Scholar]
- Woods DL, et al. , 2015. The effects of repeated testing, simulated malingering, and traumatic brain injury on visual Choice reaction time. Front. Hum. Neurosci 9, 595. [DOI] [PMC free article] [PubMed] [Google Scholar]
- Yao B, et al. , 2012. Chronic multiple sclerosis lesions: characterization with high-field-strength MR imaging. Radiology 262 (1), 206–215. [DOI] [PMC free article] [PubMed] [Google Scholar]
- Yao B, et al. , 2014. 7 Tesla magnetic resonance imaging to detect cortical pathology in multiple sclerosis. PLoS One 9 (10) p. e108863. [DOI] [PMC free article] [PubMed] [Google Scholar]
- Zivadinov R, Cox JL, 2007. Neuroimaging in multiple sclerosis. Int. Rev. Neurobiol. 79, 449–474. [DOI] [PubMed] [Google Scholar]
- Zivadinov R, Leist TP, 2005. Clinical-magnetic resonance imaging correlations in multiple sclerosis. J. Neuroimaging 15 (4 Suppl. l), 10S–21S. [DOI] [PubMed] [Google Scholar]


