

SUMMARY
Fragile X syndrome (FXS) is a neurodevelopmental disorder caused by mutations in the FMR1 gene and deficiency of a functional FMRP protein. FMRP is known as a translation repressor whose nuclear function is not understood. We investigated the global impact on genome stability due to FMRP loss. Using Break-seq, we map spontaneous and replication stress-induced DNA double-strand breaks (DSBs) in an FXS patient-derived cell line. We report that the genomes of FXS cells are inherently unstable and accumulate twice as many DSBs as those from an unaffected control. We demonstrate that replication stress-induced DSBs in FXS cells colocalize with R-loop forming sequences. Exogenously expressed FMRP in FXS fibroblasts ameliorates DSB formation. FMRP, not the I304N mutant, abates R-loop-induced DSBs during programmed replication-transcription conflict. These results suggest that FMRP is a genome maintenance protein that prevents R-loop accumulation. Our study provides insights into the etiological basis for FXS.
Graphical Abstract
In Brief
Chakraborty et al. report a genome-wide increase of DNA double-strand breaks in fragile X syndrome patient cells and suggest that FMRP functions in the R-loop pathway to prevent genome instability induced by DNA replication-transcription conflicts.
INTRODUCTION
Fragile X syndrome (FXS) is responsible for the most common form of inherited intellectual disability (ID) and autism (Santoro et al., 2012). In most patients, FXS is caused by (CGG)n trinucleotide repeat expansion exceeding 200 copies in the 5′ untranslated region of FMR1 located on Xq27.3 (Fu et al., 1991; Verkerk et al., 1991). This repeat expansion mutation then leads to heterochromatin formation and epigenetic silencing (Coffee et al., 2002; Pieretti et al., 1991). Studies have shown that both full mutation-size (>200 copies) and carrier-size (50–200 copies) (CGG)n repeats stall replication forks (Gerhardt et al., 2014; Voineagu et al., 2009) and lead to double-strand break (DSB) and chromosome fragile site formation (Krawczun et al., 1985), hence the name of the disease. FXS can also manifest as a result of mutations in the FMRP coding sequence despite a normal range of (CGG)n repeats, highlighting the functional importance of FMRP to the etiological basis for FXS (Ciaccio et al., 2017). A recent study showed that (CGG)n repeat expansion below the gene silencing threshold can induce break-induced repair pathway, resulting in mutations in the distal region downstream of the promoter (Kononenko et al., 2018). This observation provided an elegant mechanism linking repeat expansion and exonic mutations in FMR1.
FMRP is estimated to bind ~4% of the mRNAs in the brain and regulate their translation (Ashley et al., 1993). It is clear that FMRP has multifaceted cellular functions. The best-understood one is translation repression of the metabotropic glutamate receptor (mGluR)-mediated long-term depression (LTD) (Bear et al., 2004). FMRP deficiency permits an increased level of protein synthesis at postsynaptic dendrites and prolonged LTD, thus causing many of the symptoms of FXS (Bear et al., 2004; Darnell et al., 2011; Nakamoto et al., 2007; Niere et al., 2012). Genome-wide studies have identified >6,000 FMRP-interacting mRNAs, many of which are involved in synaptic signaling and function (Ashley et al., 1993; Brown et al., 2001; Darnell et al., 2011). Only a small percentage of these putative FMRP targets have been validated by independent methods (Sethna et al., 2014) and mGluR antagonist drugs have yet to show efficacy in human patients, despite preclinical success in animal models (Erickson et al., 2017). Consistent with its role as a translation repressor, FMRP is predominantly located in the cytoplasm and associates with the polysomes (Darnell et al., 2011; Khandjian et al., 2004). However, FMRP also has nuclear presence (Feng et al., 1997) and it has been found to interact with its mRNA substrates in the nucleus (Kim et al., 2009). Thus, FMRP likely plays a role in the nucleocytoplasmic shuttling of the mRNA cargoes, but its additional nuclear function(s) remains elusive.
A recent study reported that FMRP is enriched in the nucleus during replication stress, suggesting a chromatin-related function of FMRP (Alpatov et al., 2014). The authors showed that fmr1−/− mouse embryonic fibroblasts produced decreased γH2A.X staining, compared to control cells, during replication stress by aphidicolin (APH, a DNA polymerase inhibitor). This observation led to the conclusion that fmr1−/− cells are deficient in the DNA damage response (DDR) (Alpatov et al., 2014). It was also reported that Drosophila dFMRP1-deficient cells showed decreased γH2A.X foci formation when treated with hydroxyurea, an inhibitor of ribonucleotide reductase that results in reduced deoxyribonucleotide pools (Zhang et al., 2014). However, dFMRP1-deficient cells were also shown to be hypersensitive to genotoxic chemicals, including hydroxyurea, increased chromosome breaks, and increased γH2Av foci formation upon irradiation (Liu et al., 2012). Therefore, it remains unclear whether cells lacking FMRP sustain increased or decreased levels of DNA damage, despite a consensus view that FMRP is involved in DDR.
In this study, we asked whether the lack of FMRP leads to genome instability. We used lymphoblastoids and fibroblasts derived from FXS patients with full mutations of FMR1 and unaffected controls and subjected them to a multitude of queries. We consistently observed increased levels of DNA damage, manifested as increased γH2A.X staining and long comet tails in a single-molecule DNA breakage assay, occurring both spontaneously and inducible by APH, in FXS cells. We further demonstrated that exogenously expressed FMRP in FXS cells reduced the APH-induced DSB formation. More important, we mapped genome-wide DNA DSBs in FXS lymphoblastoid cells using Break-seq (Hoffman et al., 2015). We demonstrated that Break-seq, when adapted to the mammalian cell system, maintains high sensitivity and specificity, owing to the innovative approach of encapsulating cells in agarose plugs to minimize in vitro production of DSBs. We also demonstrated that the patient-derived lymphoblastoids contained molecular signatures for FXS. Lymphoblastoid cells have been previously used to reveal the genetic basis of a range of neurological disorders, including FXS (Kollipara et al., 2017; Nishimura et al., 2007; Pansarasa et al., 2018). Here, we show that the FXS cells exhibited a >2-fold increase in the number of DSBs compared to controls. We further demonstrated that replication stress-induced DSBs were enriched at R-loop forming sequences (RLFSs), where the RNA transcript hybridizes to homologous DNA on the chromosome, yielding a RNA:DNA hybrid and a displaced DNA single strand. Despite their many roles in normal cellular functions, R-loops can initiate conflicts between transcription and replication by creating a barrier to replication fork progression, causing DSBs (García-Rubio et al., 2018; Hamperl et al., 2017). Thus, we hypothesized that FXS cells are susceptible to R-loop formation during replication stress. We present evidence that FMRP, when provided exogenously, can reduce DSBs within genes prone to R-loop formation during transcription, particularly during programmed replication-transcription conflicts in a model system.
RESULTS
Fragile X Cells Sustain Elevated DNA Damage under Replication Stress
We chose cells derived from individuals diagnosed with FXS (henceforth “FX”) and unaffected normal individuals (henceforth “NM”) from two tissue origins for this study. Lymphoblastoid cells derived from an individual with a full mutation of FMR1 (GM03200) and an unaffected individual with a normal FMR1 (GM06990) were used for the majority of the study, unless otherwise noted. Select experiments also used fibroblasts from an individual with a full mutation of FMR1 (GM05848), in comparison to those derived from a sex- and age-matched control (GM00357). We confirmed the lack of FMRP expression by western blot in the FX cell lines (Figure 1A) and CGG repeat expansions, ~570 repeats in GM03200 and ~730 in GM05848, by Southern blot (Figures S1A and S1B).
Figure 1. Fragile X (FX) Cells Show Elevated DNA Damage under Replication Stress and an Intact DDR.
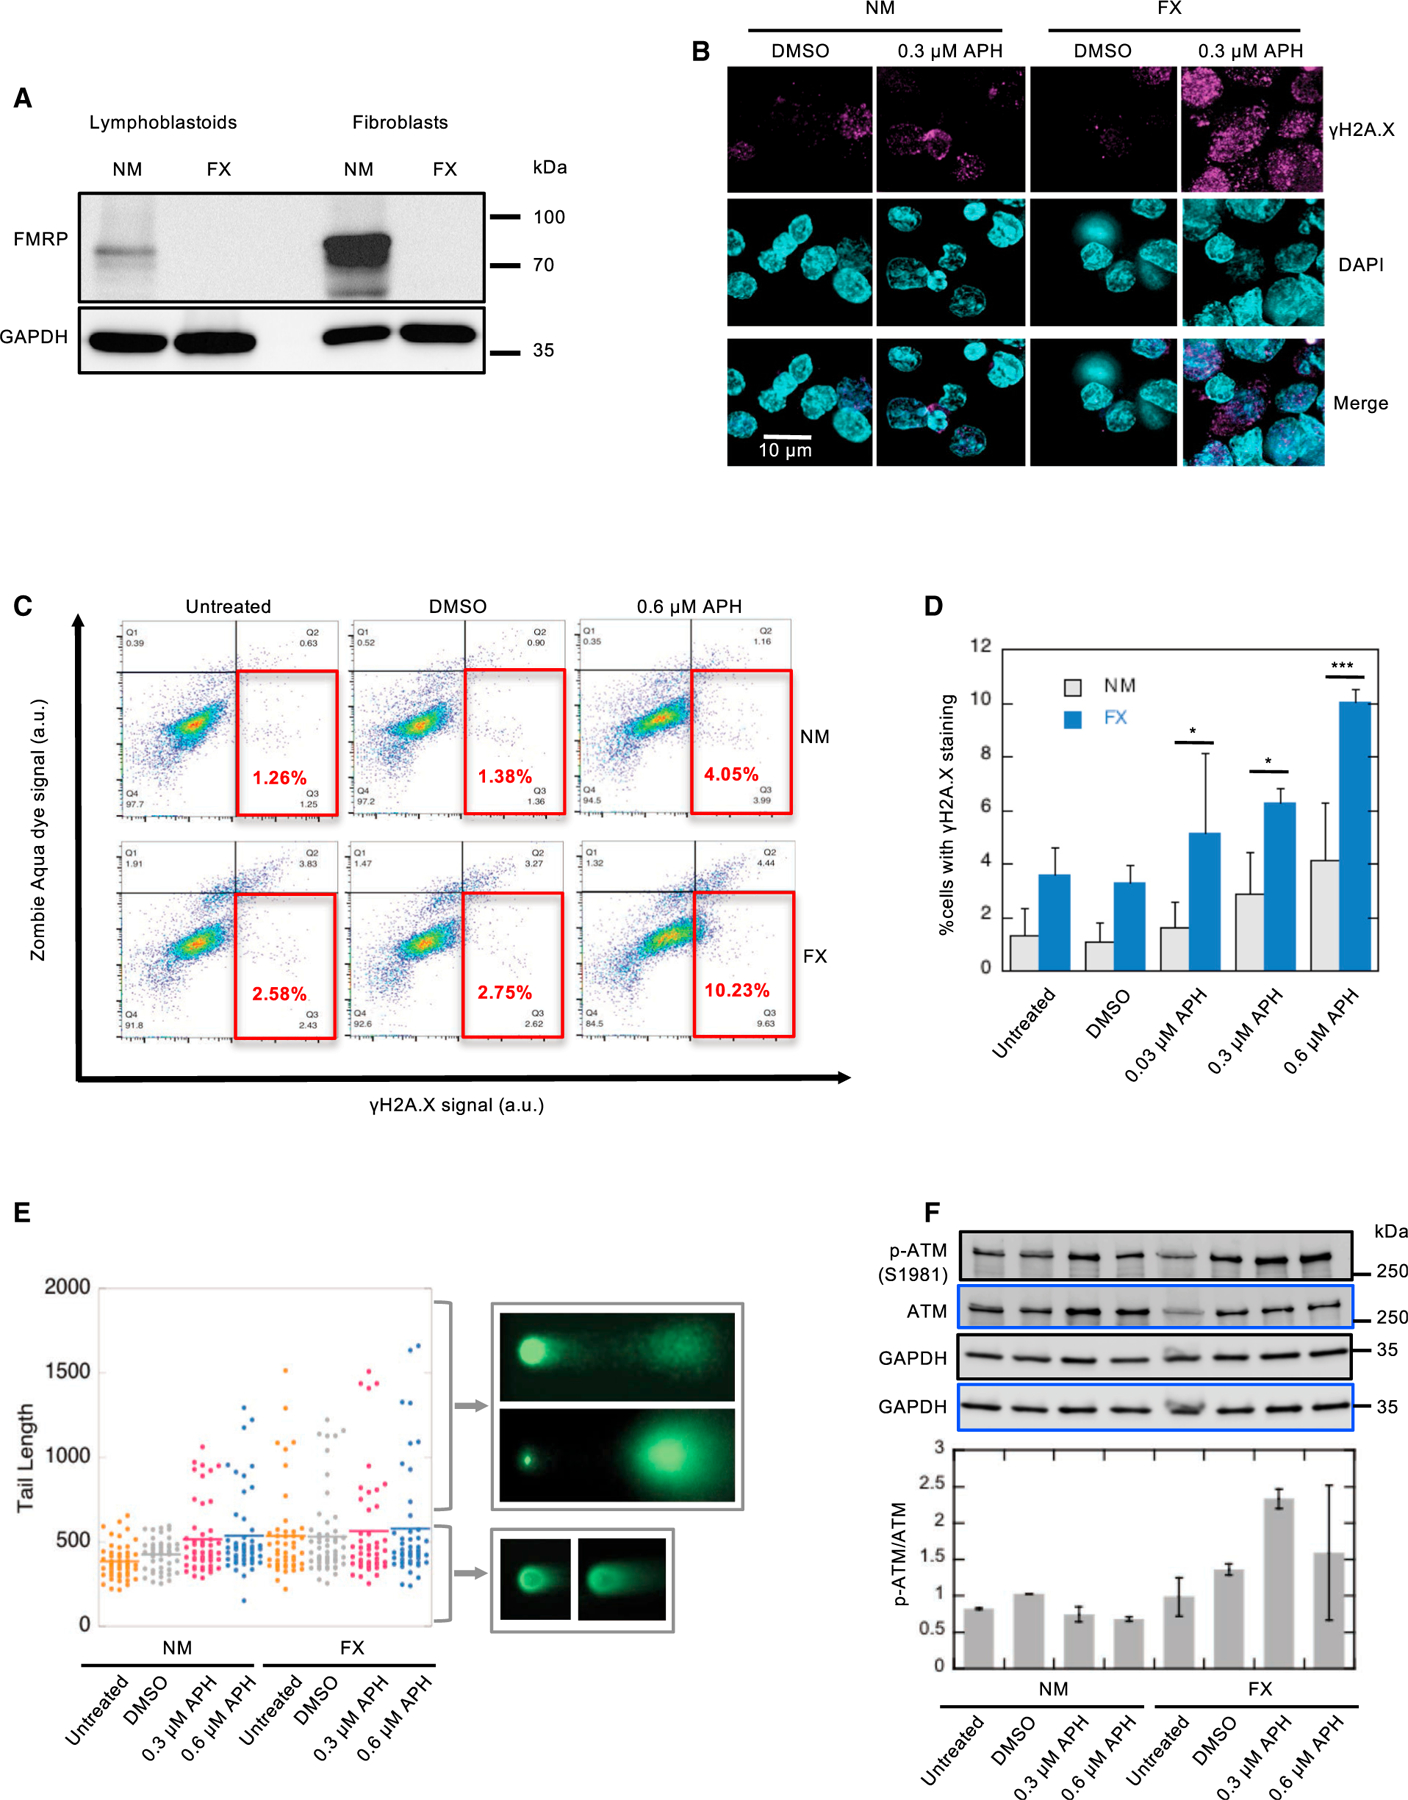
(A) Western blots confirming the absence of FMRP expression in FX cell lines.
(B) Increased γH2A.X foci formation in FX lymphoblastoid cells in APH. Scale bar, 10 μm. See also Figure S2.
(C and D) Analysis of γH2A.X signal under APH induction by flow cytometry. The solid red boxes indicate the gated live cells, with γH2A.X signals greater than baseline. Two-way ANOVA followed by Sidak’s multiple testing was performed. Error bars indicate standard deviation. *p < 0.05 and ***p < 0.001.
(E) DSB formation measured by neutral Comet assay. Three independent experiments were performed (n > 50 in each) and all trended similarly. The tail lengths from one representative experiment are shown in the boxplot. Representative images of comets with short or long Comet tail lengths are shown.
(F) Expression of phospho-ataxia telangiectasia mutated (p-ATM) in NM and FX lymphoblastoid cells indicates intact DDR in FX cells. Western blots probed with anti-p-ATM and total ATM are shown in black- and blue-bordered panels, respectively. Both blots were controlled for loading using anti-glyceraldehyde 3-phosphate dehydrogenase (GAPDH). The ratios of p-ATM:total ATM are shown below the blots. The error bars indicate standard errors of the mean.
We then analyzed genome instability in the lymphoblastoid cell lines by partially inhibiting replication with aphidicolin (APH, a DNA polymerase inhibitor) and causing a 10%–20% increase in cells in S phase (Figure S1C). Both cell lines showed a dose-dependent increase in DSBs upon APH treatment, evidenced by increased immunostaining of γH2A.X (a marker for DNA DSBs) (Figures 1B and S2A). This observation was confirmed in FX fibroblasts (Figures S2B and S2C). The quantification of cells with γH2A.X expression using flow cytometry further corroborated that FX cells showed a >2-fold increase in the γH2A.X level compared to controls, with and without replication stress (Figures 1C and 1D). These results suggested that the loss of FMRP caused heightened levels of DSB formation both spontaneously and upon APH-induced replication stress. We next performed a neutral Comet assay to investigate DSB formation at a single-cell level. The results were consistent with the γH2A.X staining experiments—FX cells showed a higher level of DSBs than their control counterparts (Figure S3A). In addition, the comet tail length distribution showed that compared to control cells, FX cells had longer comet tails, often severed from the comet heads, suggesting more severe DNA damage (Figure 1E); this is consistent with the observed increase in γH2A.X staining. To determine whether FX cells also suffered from a defective DNA damage response (DDR), we examined the phosphorylation of multiple components of the DDR pathway by western blots. FX cells showed higher levels of phospho(p)-ataxia telangiectasia mutated (ATM), p-replication protein A (RPA2), and γH2A.X than control cells, suggesting a more robust activation of the DDR in FX cells (Figures 1F, S3B, and S3C). The levels of p-ataxia telangiectasia and Rad3 related (ATR) and p-checkpoint kinase 1 (CHEK1) were similar in both cells. Next, we asked whether the increased susceptibility to DNA damage by the FX genome was due to the absence of FMRP.
Ectopic Expression of FMRP Reduces APH-Induced DNA Damage in the FXS Patient-Derived Fibroblasts
We transduced the FX fibroblasts (GM05448) with a plasmid carrying EGFP-FMRP fusion, or a plasmid carrying EGFP alone as a negative control. We then subjected the resulting cell lines to APH treatment at increasing concentrations. Cells expressing EGFP-FMRP showed reduced γH2A.X signals compared to control cells expressing EGFP alone (Figure 2A). The quantification of results recapitulated the dose-dependent increase of γH2A.X signals by APH treatment in cells expressing EGFP-FMRP (1-way ANOVA, p = 0.00018), albeit not in control cells (One-way ANOVA, p = 0.34) (Figure 2B). More important, cells expressing EGFP-FMRP showed systematically reduced DNA damage by APH compared to control cells (Two-way ANOVA, p = 5.49E−6). This result was confirmed by the reduced expression of γH2A.X in EGFP-FMRP+ cells (Figure 2C). We also confirmed that EGFP-FMRP expression was only detected in the cells carrying the EGFP-FMR1 plasmid both by anti-GFP and by anti-FMRP in western blots (Figure 2D). Therefore, we concluded that the replication stress-induced DNA damage in FX cells was due to the absence of FMRP. This prompted us to further investigate the locations of DNA DSBs in FX cells.
Figure 2. FMRP Expression Ameliorates APH-Induced DSB Formation in FX Cells.
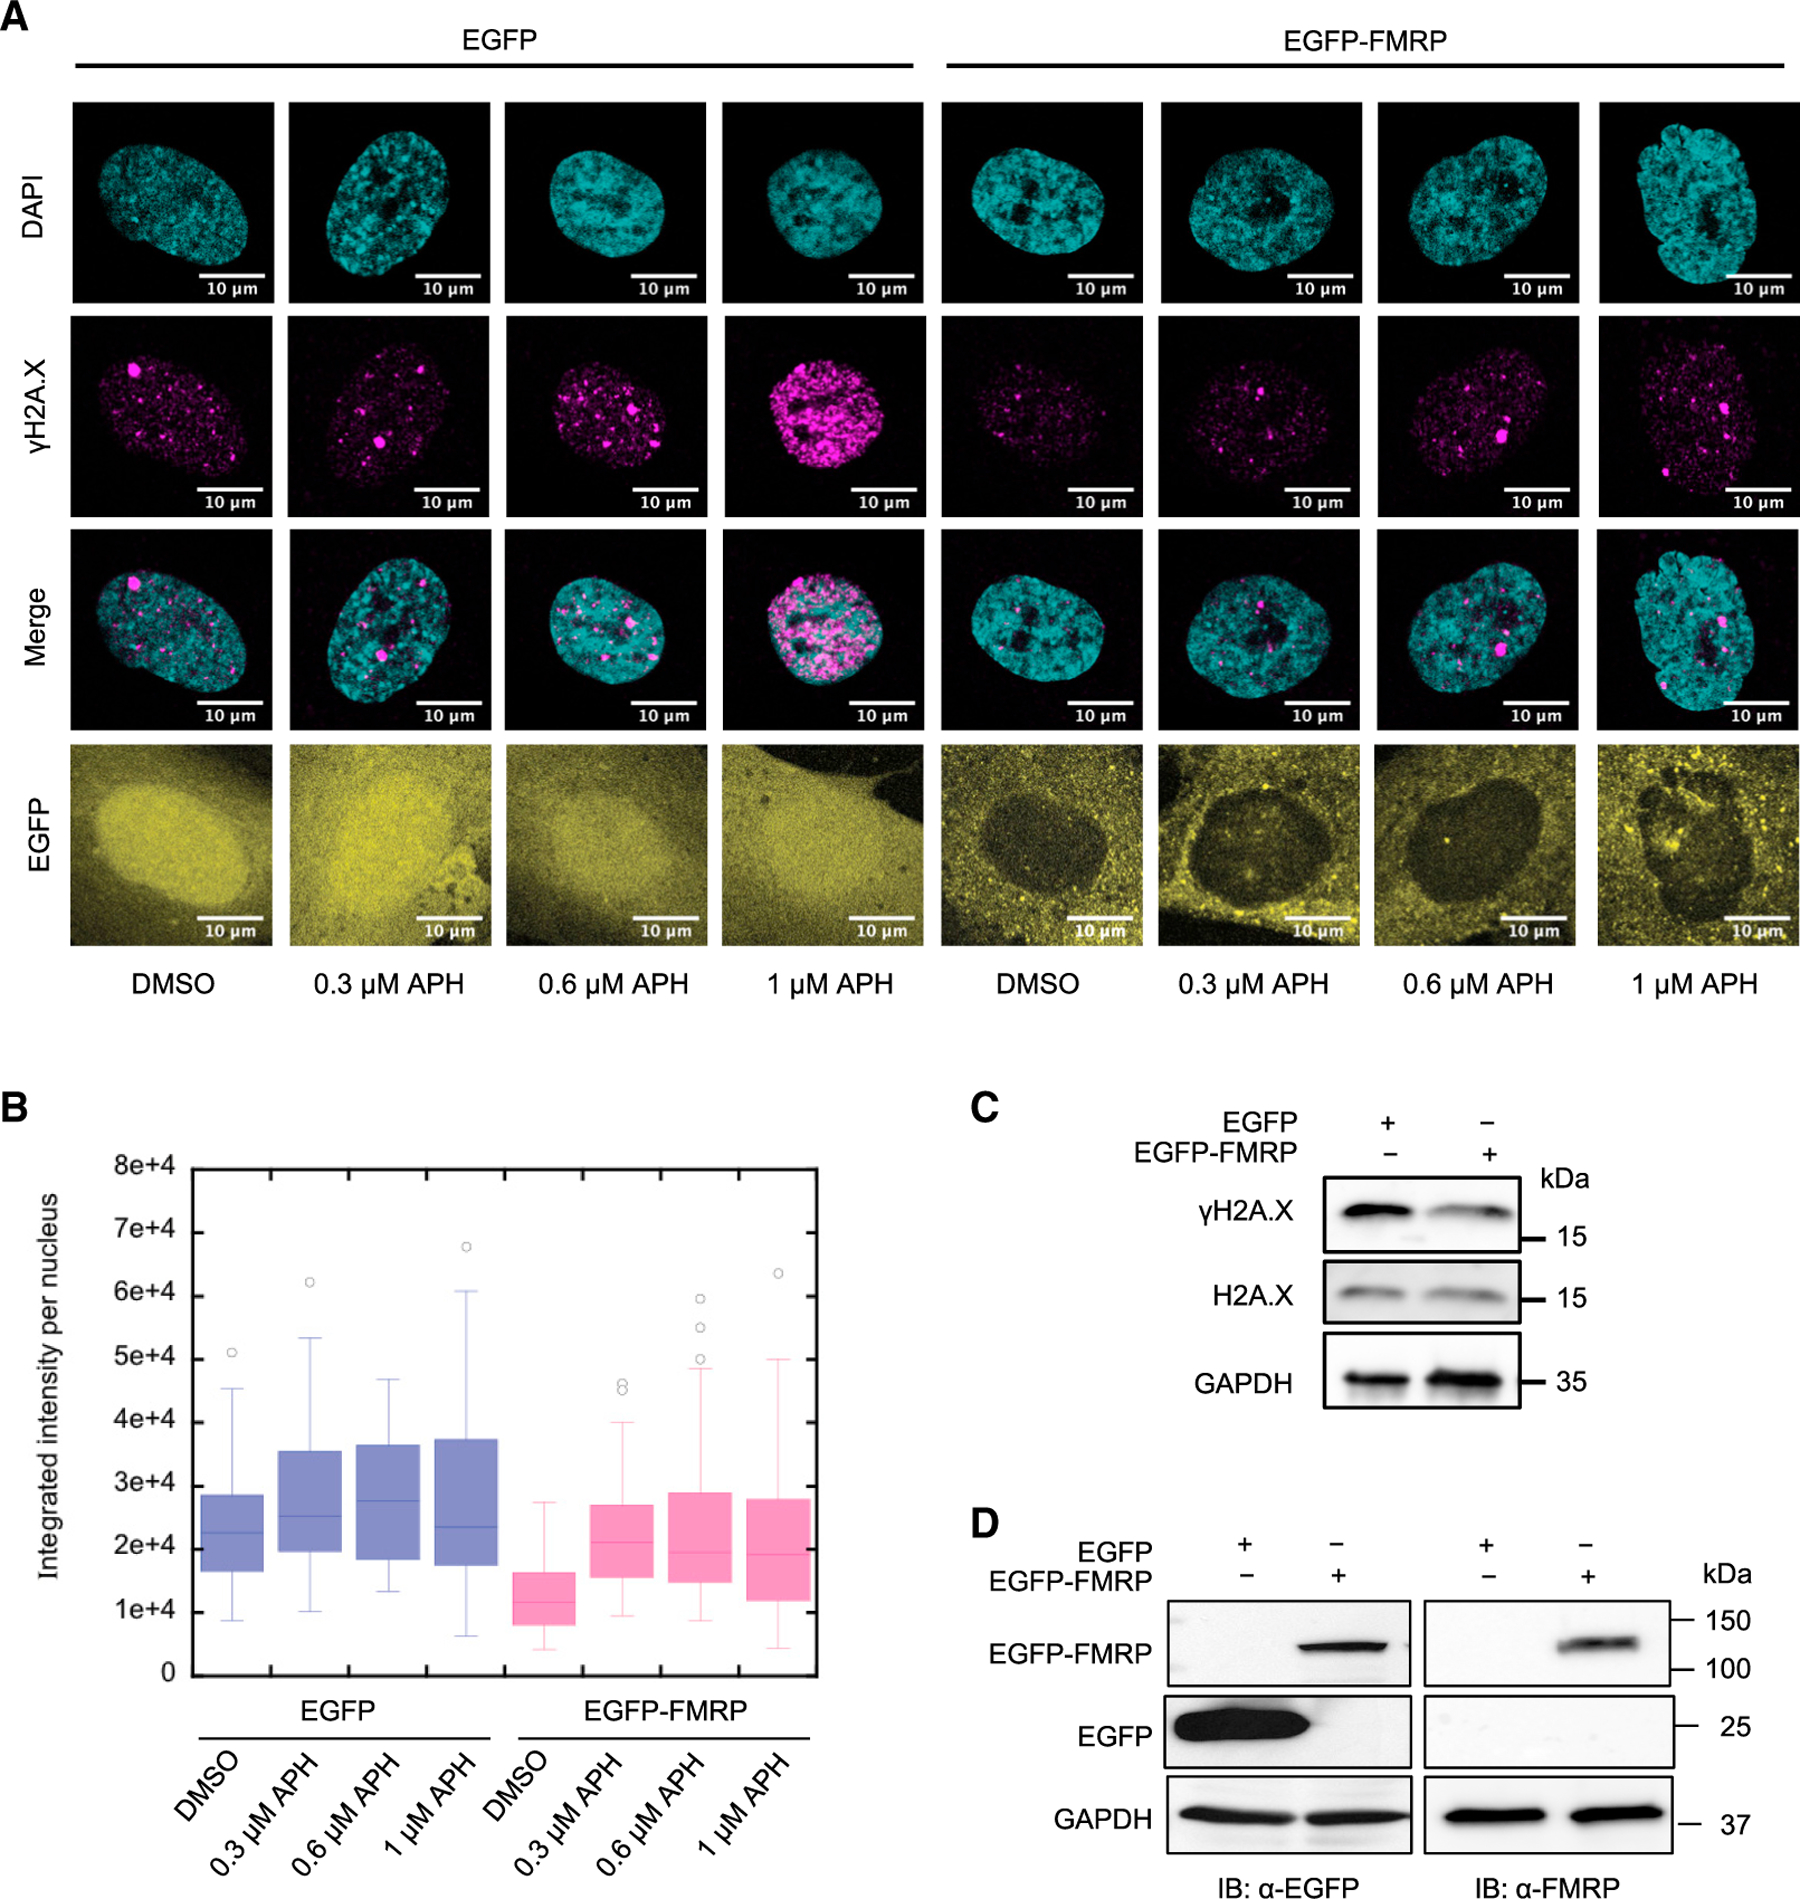
(A) γH2A.X immunofluorescence in FX fibroblast cells (GM05848) carrying pMSCVpuro-EGFP or pMSCVpuro-EGFP-FMRP. Scale bar, 10 μm.
(B) Quantitation of the γH2A.X immunofluorescence signals in (A) by boxplot.
(C) EGFP and EGFP-FMRP fusion protein expression in the respective cells in (A).
Genome-wide DSB Mapping by Break-Seq
Here, we adapted Break-seq, a powerful technology we first developed in yeast (Hoffman et al., 2015), to the mammalian system and mapped genome-wide chromosome breaks in untreated cells and cells treated with APH or with equal volume of the vehicle, dimethyl sulfoxide (DMSO) (Figure 3A). Each strain/treatment combination was represented by at least two independent experiments. As a proof-of-principle, we mapped DSBs produced by in vitro PacI digestion of DNA from FX cells treated with DMSO or 0.03 γM APH (Figure 3B). More than 96% of DSBs mapped in these 2 samples corresponded to a known PacI site (p < 2.2E−16 in random permutation tests with 1,000 iterations, see Method Details), with ≥83% concordance between them (Figure 3B). Of the 151,583 PacI sites in the human hg19 genome, 84,458 (56%) and 87,727 (58%) were mapped in the DMSO and APH samples, respectively. These results provided a benchmark for Break-seq, with >97% specificity and >56% sensitivity (the in-gel digestion efficiency of PacI was estimated at ~70%, suggesting a true Break-seq sensitivity of 80%). Break-seq library qualities were assessed by read classification and hierarchical clustering (Figures S4A–S4C). At the present sequencing depth, recurrent DSBs were identified, although Break-seq libraries were not saturated (Figure S4D). For each strain/treatment combination, for instance “FX_0.03 μM APH,” “consensus DSBs” from at least two replicate experiments, regardless of the total number of replicates, were derived (Figure 3C). The DSBs from 0.03 and 0.3 μM APH-treated samples were further pooled into a composite dataset of “FX_APH,” for each cell line, followed by comparison with the DMSO-treated control to identify DSBs shared by DMSO and APH treatment as well as those specific to each treatment (Figure 3C). DSB hotspots were distributed throughout the genome and with apparent enrichment in the pericentric regions (Figure 3D).
Figure 3. DSB Mapping by Break-Seq in Lymphoblastoid Cells.
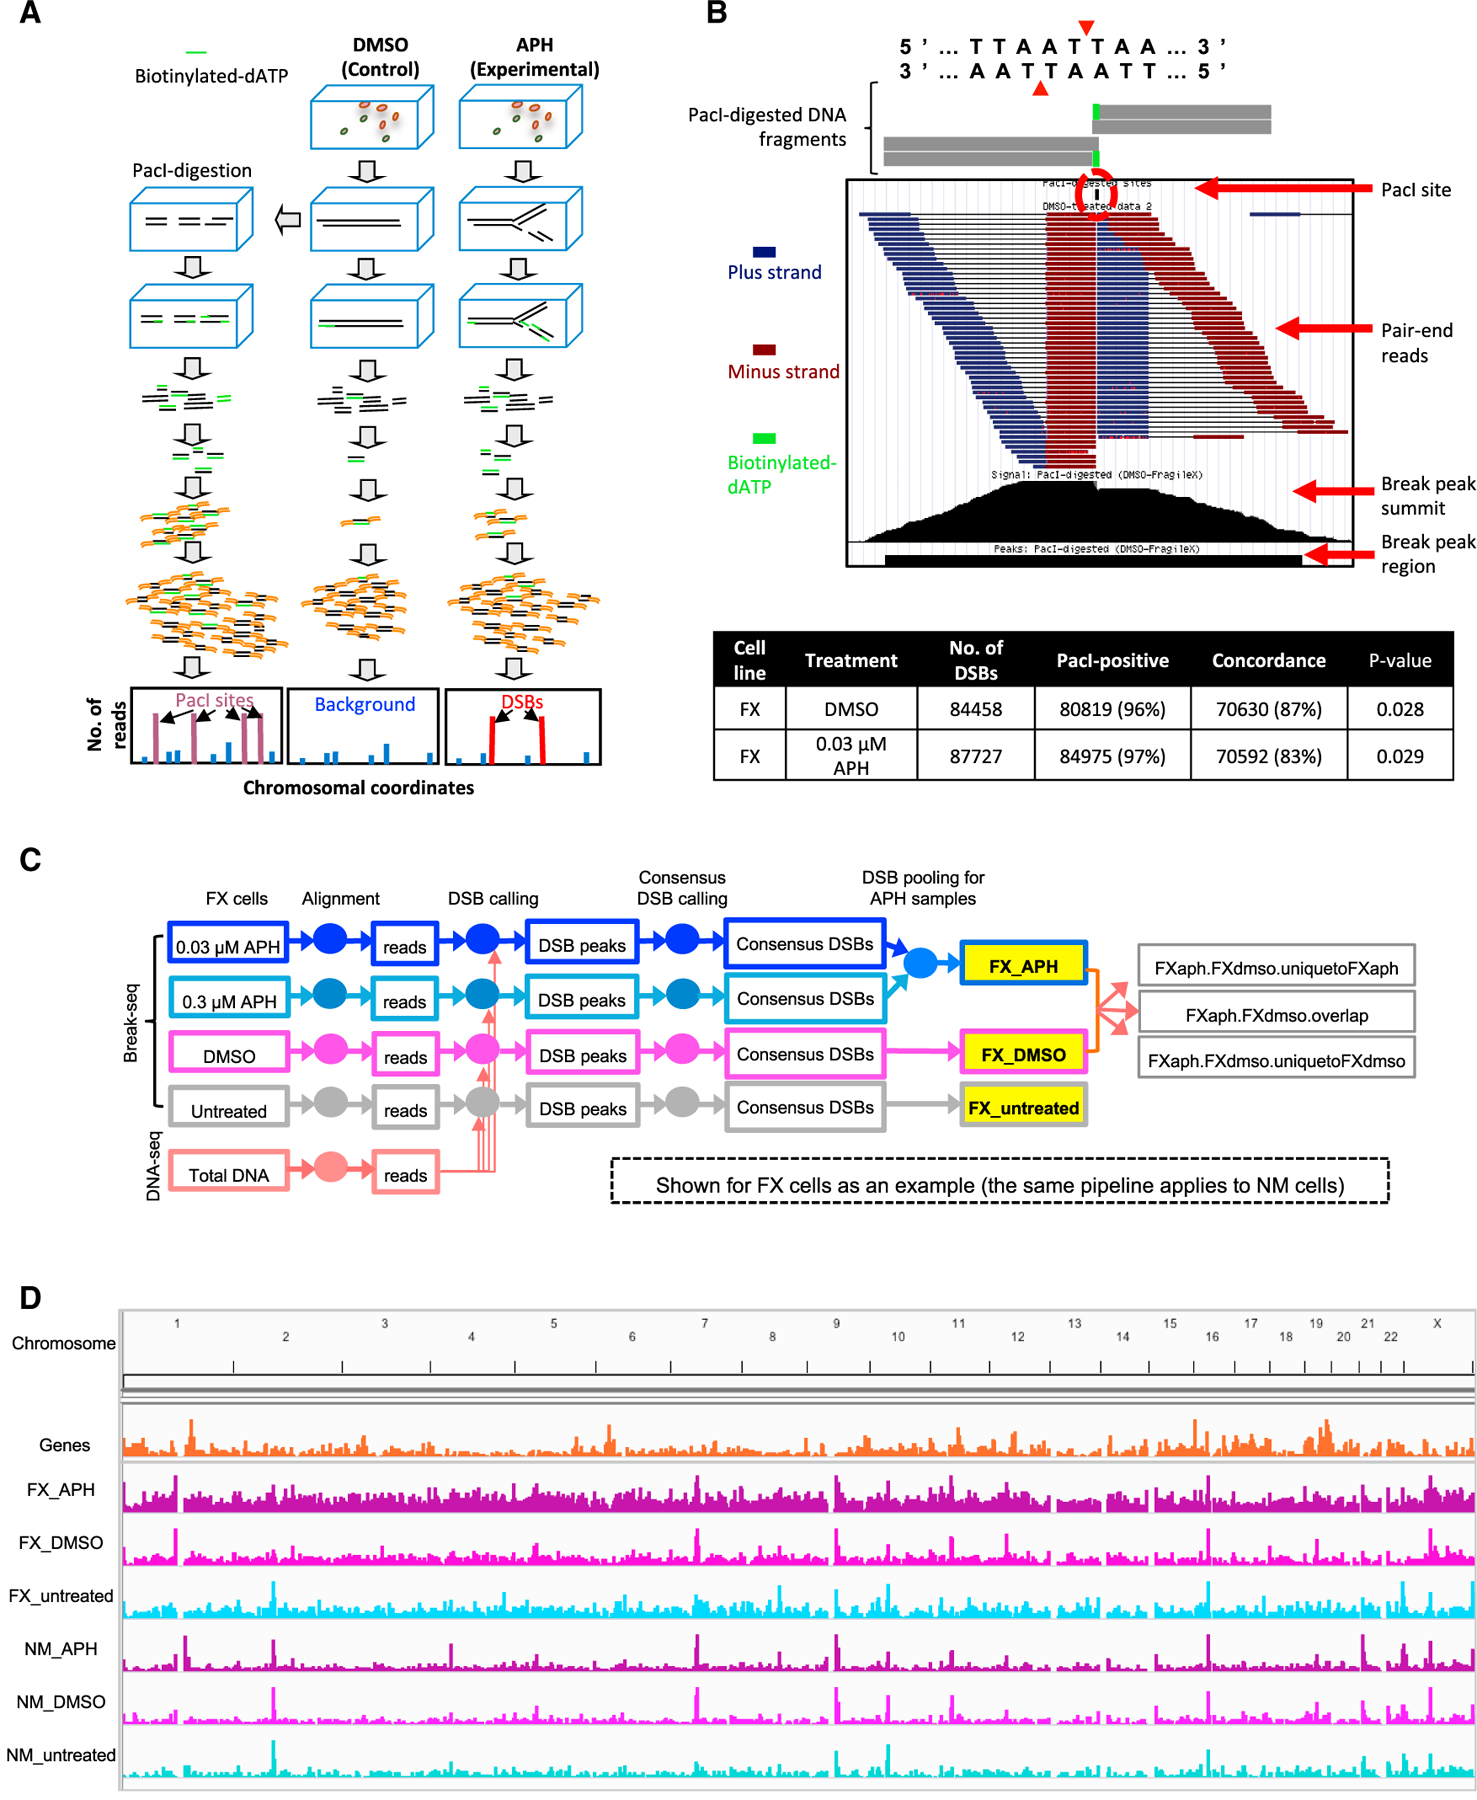
(A) Break-seq workflow.
(B) Break-seq sample read pile-up of a PacI site leading to the identification of a “peak” in the “proof-of-principle” experiment. The table denotes total PacI sites identified in DMSO-treated and (0.03 μM) APH-treated FX cells.
(C) Schematic for Break-seq analysis. The sequence reads were aligned with Bowtie2, followed by model-based analysis of ChIP-seq 2 (MACS2) peak calling while normalizing for copy-number variation by whole-genome sequencing (“total DNA”) for NM and FX cells, respectively (shown for FX cells only). DSB peaks found in at least 2 replicate experiments for each strain/treatment combination were identified as “consensus DSBs” by DiffBind. Peaks from different APH treatments (0.03 and 0.3 μM) were then pooled into a single set of “FX_ APH” DSBs, in contrast to the control datasets. The consensus DSBs for each strain/treatment combination were compared with each other (e.g., between “FX_APH” and “FX_DMSO”) to identify overlaps and condition-specific DSBs, ready for further comparison with genomic features such as RLFSs.
(D) Whole-genome distribution of DSBs in the indicated categories.
In all of the experiments, FX cells produced 2- to 2.5-fold more DSBs than NM cells with or without drugs (Figure 4A; Table S1), consistent with high levels of γH2A.X signal observed in FX cells. X chromosome showed the highest density of DSBs in APH-induced FX cells, at approximately eight DSBs per megabase of DNA (Figure 4B). Overall, 83%, 16%, and 62% of DSBs in the untreated, DMSO-treated, and APH-treated NM cells, respectively, were found in the corresponding treatments of FX cells (Figure 4C). This result suggested that spontaneous DSBs were largely concordant between the two cell lines. We examined the relative dissimilarity between DSBs in DMSO-treated NM and FX cells. We found that untreated and DMSO-treated FX cells only shared 8% common DSBs, in contrast to 78% concordance between untreated and DMSO-treated NM cells. These observations suggested that DMSO treatment caused FX cells to “reprogram” DSB formation compared to NM cells. Lastly, in both cell lines the dual treatment of DMSO and APH enhanced existent DSBs (from DMSO treatment alone), with a greater extent of new DSB induction in the FX cells: there was 82% and 67% concordance between DMSO-treated and dual APH-treated samples for NM and FX cells, respectively. Here, we concluded that drug treatment in FX cells elicited a different response than in NM cells. We proceeded to investigate the mechanism of DSB induction.
Figure 4. DSB Association with Genomic Features.
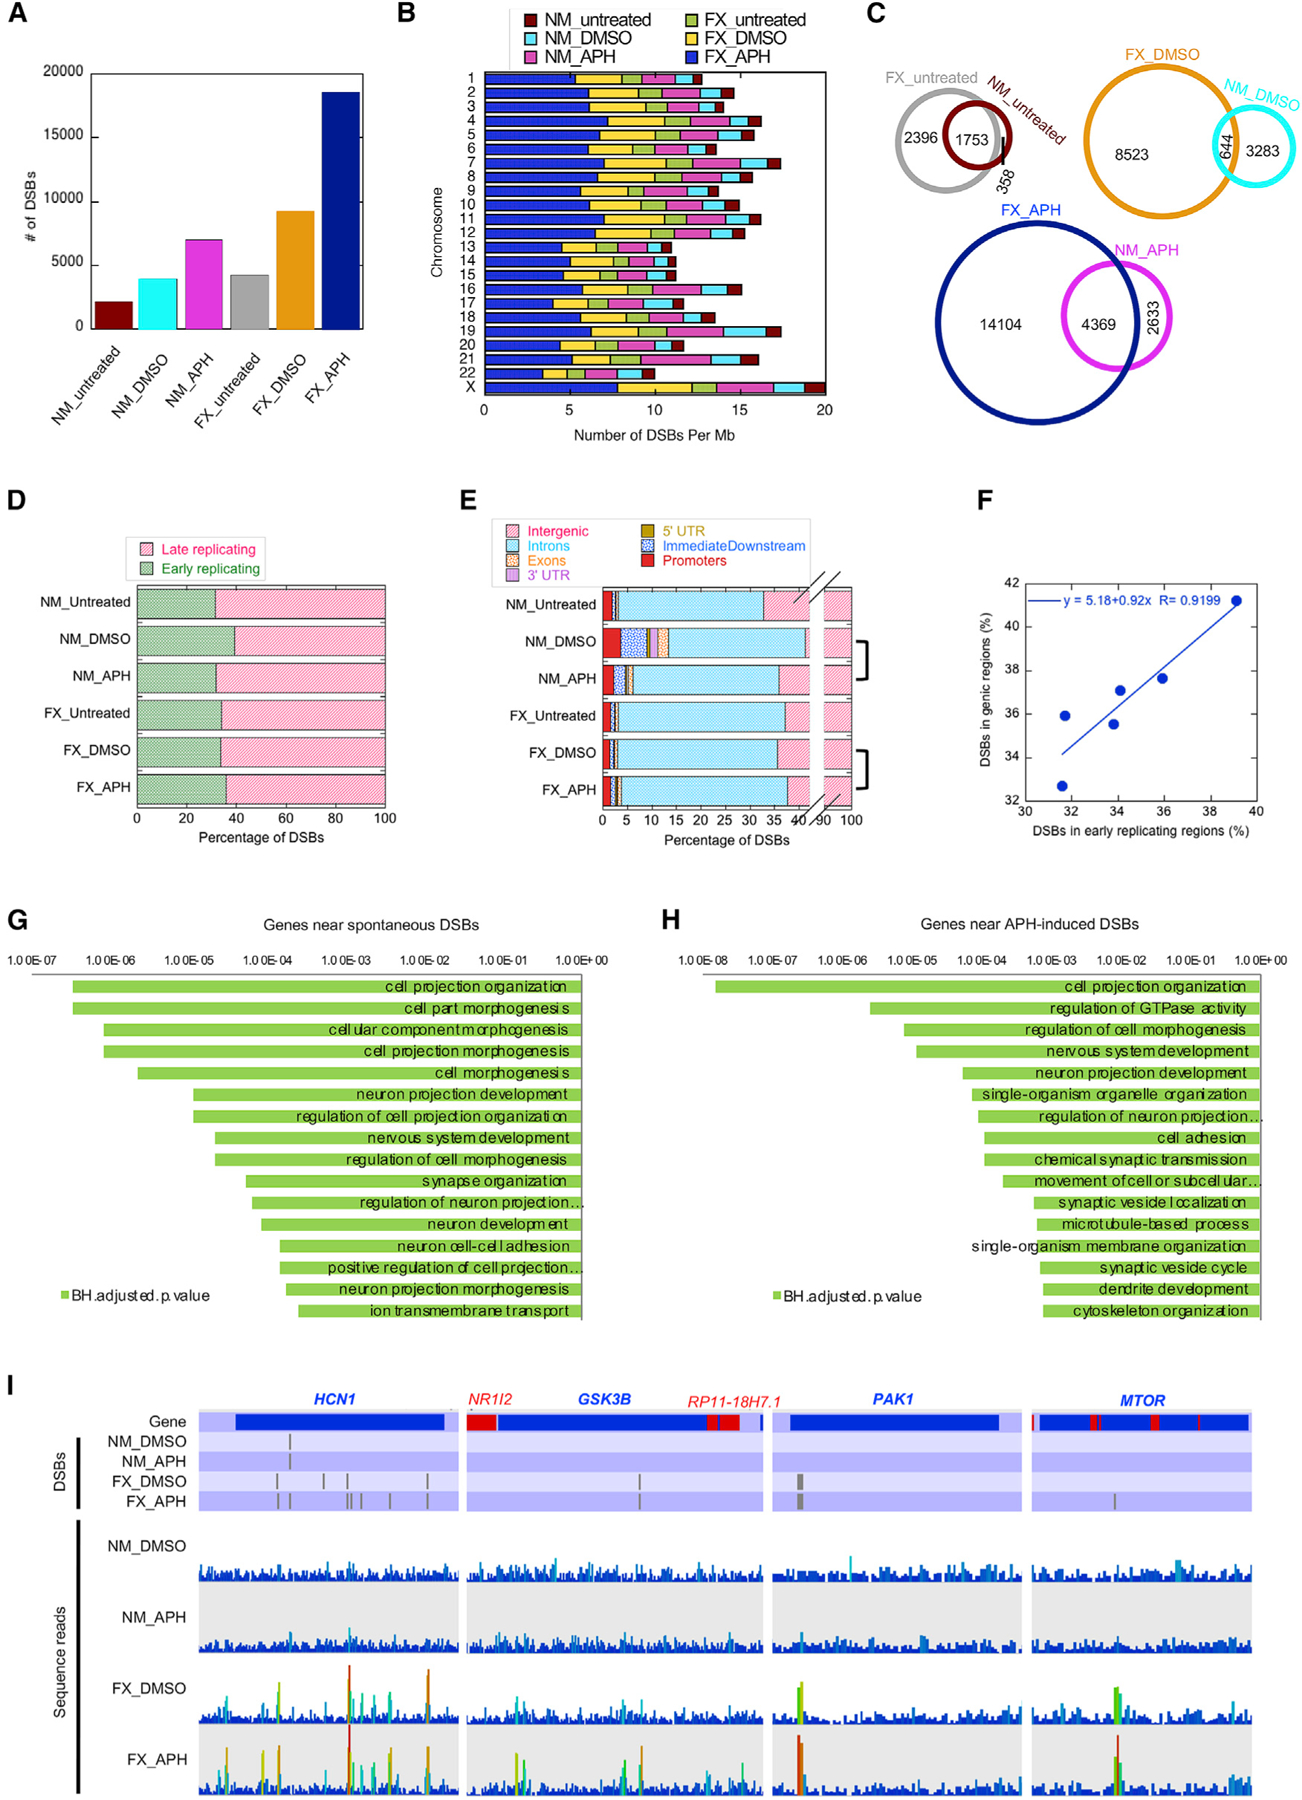
(A) Plot of total number of DSBs in each of the indicated categories.
(B) DSB density (per megabase of DNA) across each chromosome for the indicated categories.
(C) Venn diagrams compare concordance between NM and FX cells for every treatment.
(D) Distribution of DSBs in early-versus late-replicating regions of the genome, as defined by Hansen et al. (2010) in the indicated samples (see Method Details). (E) Distribution of DSB peaks relative to genes in the indicated samples. Genic features include introns, exons, 5′- and 3′ UTRs, promoters, and the immediately downstream (<1 kb from the 3′ UTR) regions (ImmediateDownstream). Note the break in the x axis to show all of the genic features.
(F) Correlation between DSBs associated with genes and with early-replication timing sequences.
(G and H) Gene Ontology (GO) terms for genes associated with DSBs in FX-untreated (G) and APH-treated (H) samples. Plotted are the BH (Benjamini-Hochberg) adjusted p values for the GO terms.
(I) Examples of genes containing drug-induced DSBs specifically in the FX cells. The top tier of the plots annotate the DSB positions in genes labeled red or blue for Watson- or Crick-strand-encoded, respectively. The bottom tier show sequence read distribution in each data track, with increasing numbers following a blue to red color scale.
DSBs and Replication Timing
APH-induced DSBs are definable as a genomic feature called common fragile sites (CFSs) (Glover et al., 1984). We systematically compared the APH-induced DSBs mapped in our study to CFSs reported in the literature that are also present in lymphocytes, the same cell type as was used in our study, including 52 CFSs from Savelyeva and Brueckner (2014) and 24 CFSs from Le Tallec et al. (2013). We also compared our DSBs to a list of DSBs mapped by a genome-wide technique named BLESS in APH-treated HeLa cells (“APH.breakome”) (Crosetto et al., 2013). We did not find significant (p < 0.001) correlation between DSBs in our study with the CFS cores (Figures S5A and S5B). Closer scrutiny of the experimental conditions in CFS studies led us to conclude that this apparent discrepancy stemmed from the differential usage of organic solvent for APH (i.e., ethanol versus DMSO; see Discussion). However, we did observe significant correlation between replication stress-induced DSBs in NM and FX cells with the APH.breakome (p < 0.001, Figure S5C).
CFSs have been characterized by late replication timing (Hellman et al., 2000; Le Beau et al., 1998; Palakodeti et al., 2004; Wang et al., 1999). Therefore, we asked whether the APH-induced DSBs in our study were located in late-replicating sequences. Using published Repli-seq data for GM06990 cells (Hansen et al., 2010), we divided the genome into 50-kb early-or late-replicating segments and calculated the percentage of DSBs in each segment. The majority of DSBs (at least 60%) were associated with late-replicating sequences in all samples (Figure 4D). In addition, the concordant DSBs (those that were shared between our data and the APH.breakome) were similarly associated with the late-replicating regions for both NM and FX cells (Figure S5D, p < 10E−3). A subset of the concordant DSBs with the APH.breakome sites was also associated with early-replicating regions, highlighting a mechanism of DSB formation that is independent of the late-replication timing archetype (Figure S5E, p < 10E−3). This observation is reminiscent of a previous study that reported early-replicating fragile sites in actively transcribing genes in B cells challenged with hydroxyurea, which induces replication stress by limiting the nucleotide pool (Barlow et al., 2013).
Therefore, we next inspected the distribution of DSBs with respect to genes. Approximately 30%–40% of DSBs in all of the samples occurred in genic regions with a dominant presence in introns. NM cells had 33% of spontaneous DSBs (from untreated cells) within genes, compared to 37% for FX cells. We do not know whether this increase in genic association for DSBs in FX cells is related to the higher level of transcription in FX cells. However, it has been shown that FMRP knockout mouse neurons exhibit increased gene expression compared to control neurons (Korb et al., 2017). Vehicle treatment increased the genic association to 41% for DSBs in NM cells, followed by a return to 36% with APH (Figure 4E). In contrast, FX cells showed a constant level of DSB-gene association, with 36% and 38% in vehicle- and APH-treated conditions, respectively (Figure 4E). The percentage of DSBs that fall in the early-replicating regions is correlated with the percentage of DSBs within genes (Figure 4F). These results suggest two types of APH-induced chromosome breakage—those in the intergenic regions that undergo delayed replication and those in the gene-rich early-replicating regions that may experience elevated levels of gene transcription. We also asked whether our DSBs are enriched in large genes that have been suggested to correspond to late-replicating CFSs. We used a published dataset of t-SDRs and t-SDWs, corresponding to “significantly delayed regions” and “significantly delayed windows” that each contain large (>300 kb) transcribed genes (Brison et al., 2019). We did observe a positive, although not statistically significant, correlation between drug-induced DSBs in FX cells with t-SDWs (Figure S5F). In contrast, the APH.breakome did not demonstrate correlation with these domains with large genes (Figure S5G).
Next, we annotated the genes neighboring spontaneous DSBs within a 5-kb maximal distance. For DSBs in NM cells, there was no significant (p < 0.001) GO (Gene Ontology) enrichment. In contrast, spontaneous DSB-associated genes in FX cells were enriched in “neuron projection development,” “synapse organization,” and “neuron cell-cell adhesion” (Figure 4G). This result suggested that neuronal developmental genes were susceptible to chromosome breakage in the FX background, even without replication stress. Moreover, APH treatment further enhanced the GO enrichment in the same pathways (Figure 4H). A complete list of pathways associated with DSBs in all of the samples is shown in Table S2. Notably, many genes previously validated as FMRP-binding mRNAs such as HCN1, GSK3B, PAK1, and MTOR, showed specific DSB formation in FX cells (Figure 4I). This result indicated that FMRP, in addition to regulating the mRNA translation of its target genes, also maintains the stability of genomic loci where these genes reside.
Preferential Association between Drug-Induced DSBs and RLFS in FX Cells
If the gene-associated DSBs were due to drug-induced replication-transcription conflict at actively transcribing genes, DSBs may correlate with R-loops, which are co-transcriptional structures. We surveyed a database of RLFSs predicted by a previously described algorithm (Wongsurawat et al., 2012) for correlation with DSBs in a Fisher’s exact test (Table S3, small right tail p value indicates more overlaps than expected from a random simulation test and is used for reporting below). Untreated cells did not show enrichment of spontaneous DSBs at RLFSs; however, DMSO-treated NM and FX cells both showed significant enrichment of DSBs at RLFSs (p = 1.22E−34 and 3.71E−37 with enrichment of 1.746 and 1.493, respectively). Notably, DSBs in APH-treated NM cells were no longer enriched at RLFSs (p = 0.96 with an enrichment ratio of 0.927), whereas those in APH-treated FX cells remained associated with RLFSs (p = 1.25E−66 with an enrichment ratio of 1.498). These results were corroborated by the absolute distance measurements between DSBs and RLFSs (Table S4) using GenometriCorr (Favorov et al., 2012). We concluded that (1) DMSO elicits transcriptional response, possibly through oxidative stress (see Discussion), in both NM and FX cells and causes DSBs at RLFSs within actively transcribing genes, and (2) replication inhibition by APH triggers NM cells to deploy a mechanism to protect genes from DSBs at RLFSs, whereas FX cells lacked such a mechanism. Consistent with our interpretations, we note that in comparing the vehicle-and APH-treated samples, NM cells underwent a decrease from 41% to 36% in DSB-gene association, whereas FX cells showed the opposite trend, increasing from 36% to 38% (Figure 4E, brackets). In fact, APH-specific DSBs in FX cells (DSB group “FXdmso.FXaph.uniquetoFXaph”) showed the greatest association with genes (58.8%) compared to DSBs in any other category (Table S5). The aggregated distribution of DSBs around RLFSs showed an enrichment of DSBs immediately downstream of the RLFS start and immediately upstream of the RLFS end, specifically in the drug-treated FX cells (Figures 5A and 5B). Overall, these results led us to conclude that FX cells form DSBs at RLFSs when treated with DMSO, a response that is further enhanced by APH. We also compared the DSBs to a composite list of DRIP-seq (DNA:RNA hybrid immunoprecipitation followed by sequencing) signals, generated by merging all DRIP-seq signals in NT2 and K562 cell lines to minimize cell-type-specific differences (Sanz et al., 2016). The results largely recapitulated the comparison between DSBs and RLFSs (Table S3).
Figure 5. DSB Correlation with RLFSs and Increased RNA:DNA Hybrids in FX Cells In Vivo.
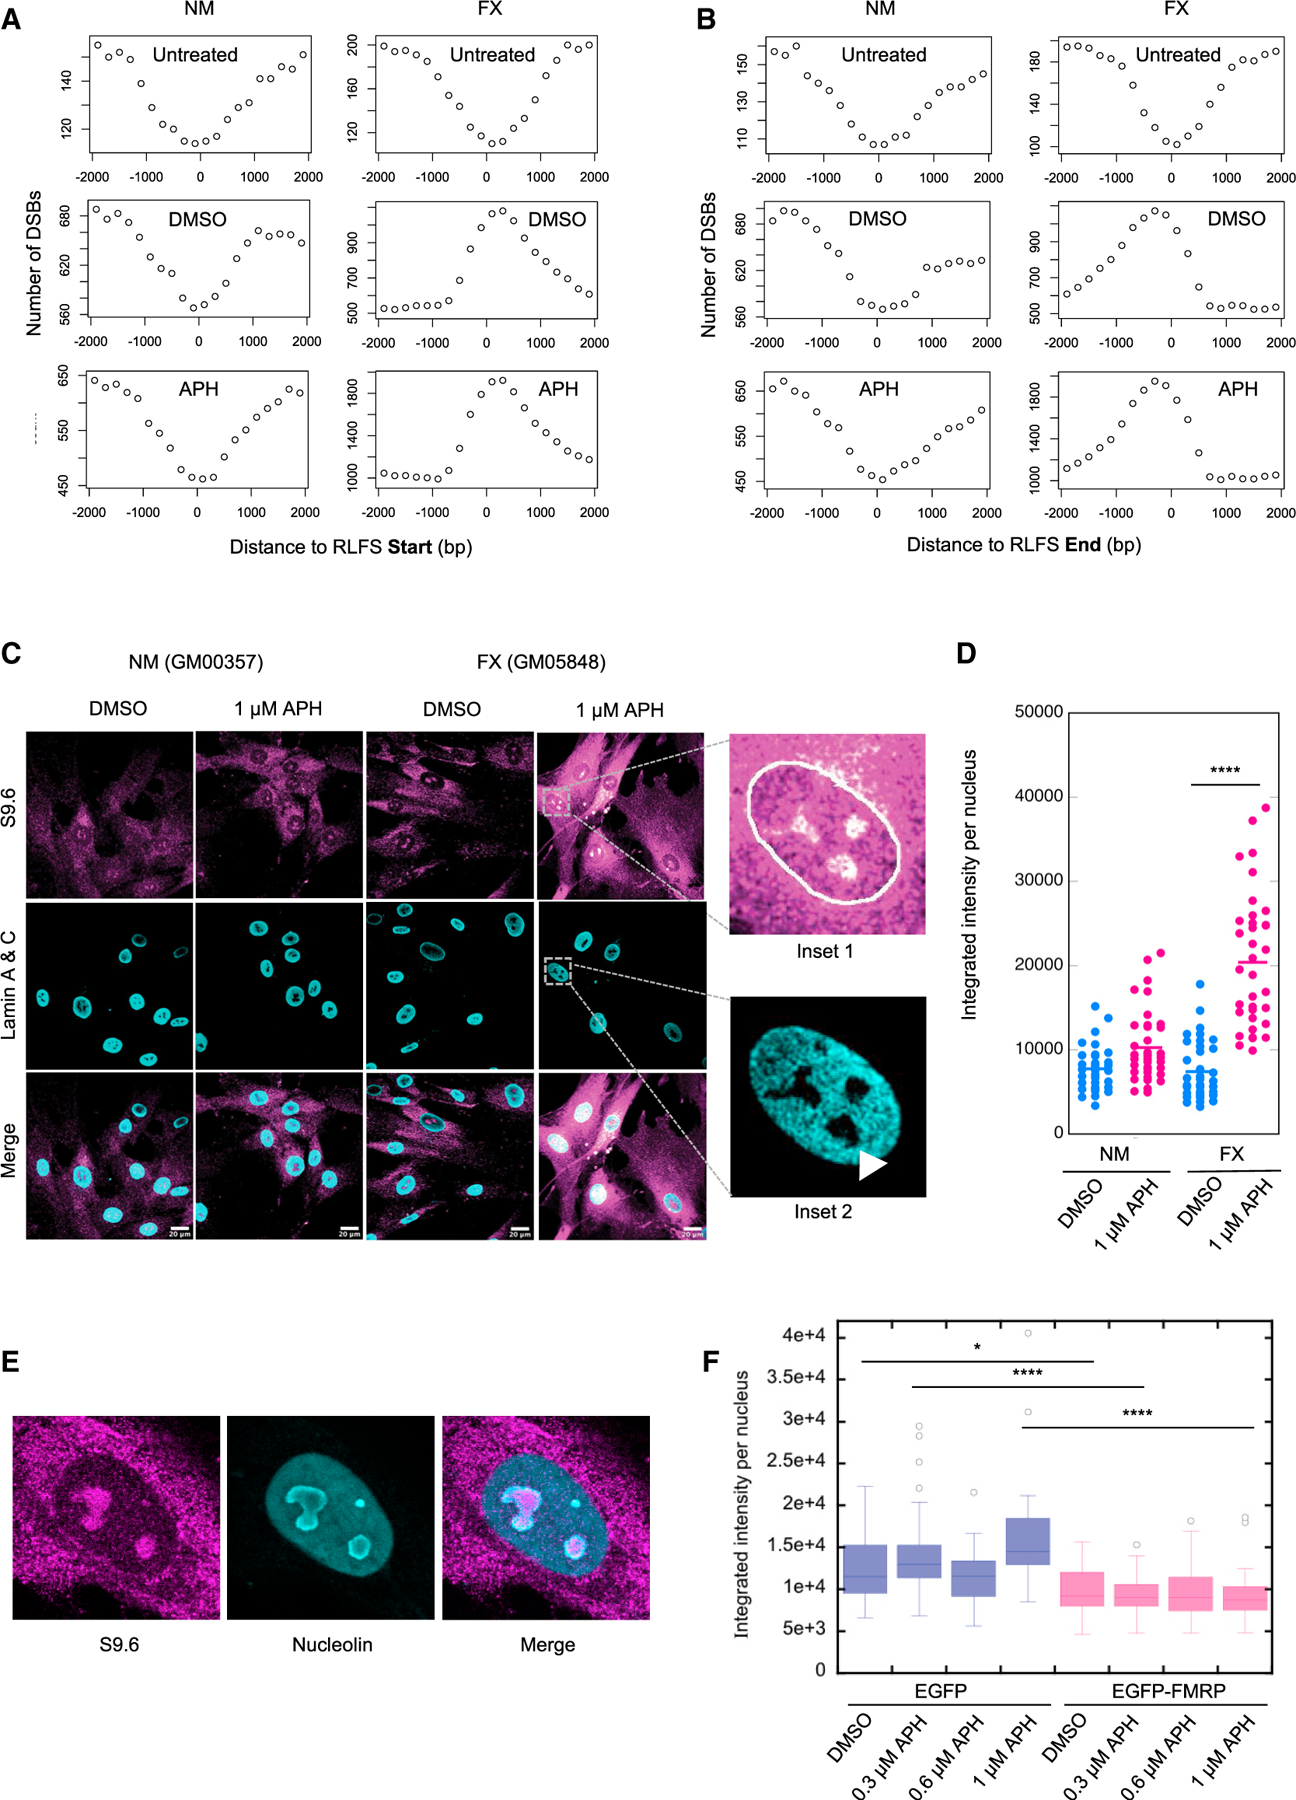
(A and B) Aggregated DSBs from the indicated samples around the start (A) or the end (B) of RLFS in a 4,000-bp window centering on the RLFS.
(C) Confocal images of immunofluorescence staining with the S9.6 antibody. The nuclear boundary is traced by Lamin staining (inset 1). The RNA:DNA hybrid signals are enriched in the areas of the nucleus lacking DAPI staining, which are presumed the nucleoli (arrowhead in inset 2). Scale bar, 20 μm.
(D) Quantification of nuclear S9.6 signals in two independent experiments (n ≥ 33 in each) using one-way ANOVA with multiple comparisons. *p < 0.0001.
(E) Validation of the co-localization of RNA:DNA hybrids with nucleolus by co-staining with S9.6 and anti-nucleolin. Shown is an example of DMSO-treated FX cells. Similar observations were made with APH-treated cells (data not shown).
(F) Nuclear S9.6 signals were reduced by the ectopic expression of EGFP-FMRP, compared to the EGFP control, in FX cells. Quantification was done similarly as in (D). *p < 0.05 and ****p < 0.0001.
The strong correlation between DSBs and RLFSs in FX cells is most pronounced on chromosomes 1, 13, 14, 15, 21, and 22, which contain rDNA clusters, followed by chromosomes 2, 6, and 12 (Table S4). Notably, the DSBs on the rDNA-bearing chromosomes were not confined to the rDNA loci. We used immunofluorescence to validate that FX cells accumulate R-loops or RNA:DNA hybrids upon replication stress using the S9.6 antibody. RNA:DNA hybrid signals in the nucleus were significantly increased upon APH treatment compared to vehicle-treated sample in FX cells, in contrast to a moderate increase in NM cells (Figures 5C and 5D). Moreover, the RNA:DNA foci appeared to be enriched in areas of the nucleus that were devoid of DAPI stain, which were characteristic of the nucleoli (Figure 5C, insets). We confirmed this finding using nucleolin co-staining with S9.6 antibody (Figure 5E). This result supported the notion that DSBs showed preferential association with RLFSs on the nucleolar resident chromosomes. Finally, we demonstrated that the ectopic expression of EGFP-FMRP also reduced the RNA:DNA hybrid levels in the FX cells (Figure 5F). Of note, the S9.6-detected signals were labile to RNase H treatment, suggesting that they corresponded to RNA:DNA hybrids (Figures S6A and S6B). Therefore, we hypothesized that FMRP is required for R-loop prevention during replication stress.
Ectopic Expression of FMRP, but Not the FMRP-I304N Mutant, Reduces RLFS-Induced DSBs
To test whether FMRP prevents R-loop formation, we used a modified yeast-based recombination assay (Prado and Aguilera, 2005) to measure DSB frequency in programmed transcription-replication conflict induced by human RLFSs (Figure 6A). We chose this model system for its simplicity and perspicuity. By co-expressing human RLFSs and FMRP, for which there is no known yeast ortholog, we were able to specifically analyze the interaction between these entities. In the absence of RLFS insertion, there was a 4.7-fold enhancement of recombination frequency (RF) on the plasmid with convergent replication and transcription compared to a co-directional configuration (Figure S7A), consistent with the previous observation (Prado and Aguilera, 2005). Two human RLFSs, when inserted in the sense direction, each caused elevated RF over the control sequence (non-RLFS), in the convergent replication-transcription configuration specifically (2- and 4-fold, p = 0.0024 and p < 0.0001, respectively; Figure S7B). RF was further enhanced in a strain lacking RNase H1, an enzyme known to resolve R-loops by degrading the RNA:DNA hybrid: ~2- and 1.5-fold for sense and anti-sense orientation, respectively, for RLFS-1, and ~1.2-fold for both sense and anti-sense orientations, for RLFS-2 (Figures S7B and S7C). Because RLFS-2 already induced high RF, further enhancement by eliminating RNase H1 was only moderate. Next, we asked whether ectopic expression of FMRP would decrease RLFS-induced DSBs. The expression of empty vector did not alter the RLFS-induced RF (comparing Figure S7B to Figure S7D). A significant decrease in RF was observed for the expression of FMRP (2- and 1.6-fold for RLFS-1 and RLFS-2, respectively) or a positive control, RNase H1, but not for a nonspecific RNA-binding protein, She2, compared to empty vector (Figure 6B). Finally, a mutant FMRP containing an I304N substitution in the KH2 domain, a rare de novo mutation that led to FXS (De Boulle et al., 1993; Siomi et al., 1994), no longer suppressed RF (Figure 6B). We also verified that FMRP and FMRP-I304N showed similar levels of protein expression in yeast (Figure S7E). The I304N mutation abolishes FMRP binding to mRNA and the polysome (Feng et al., 1997). Our results thus suggest that the KH2 domain is also involved in interactions with R-loops.
Figure 6. FMRP Expression Suppresses RLFS-Induced DSB Formation.
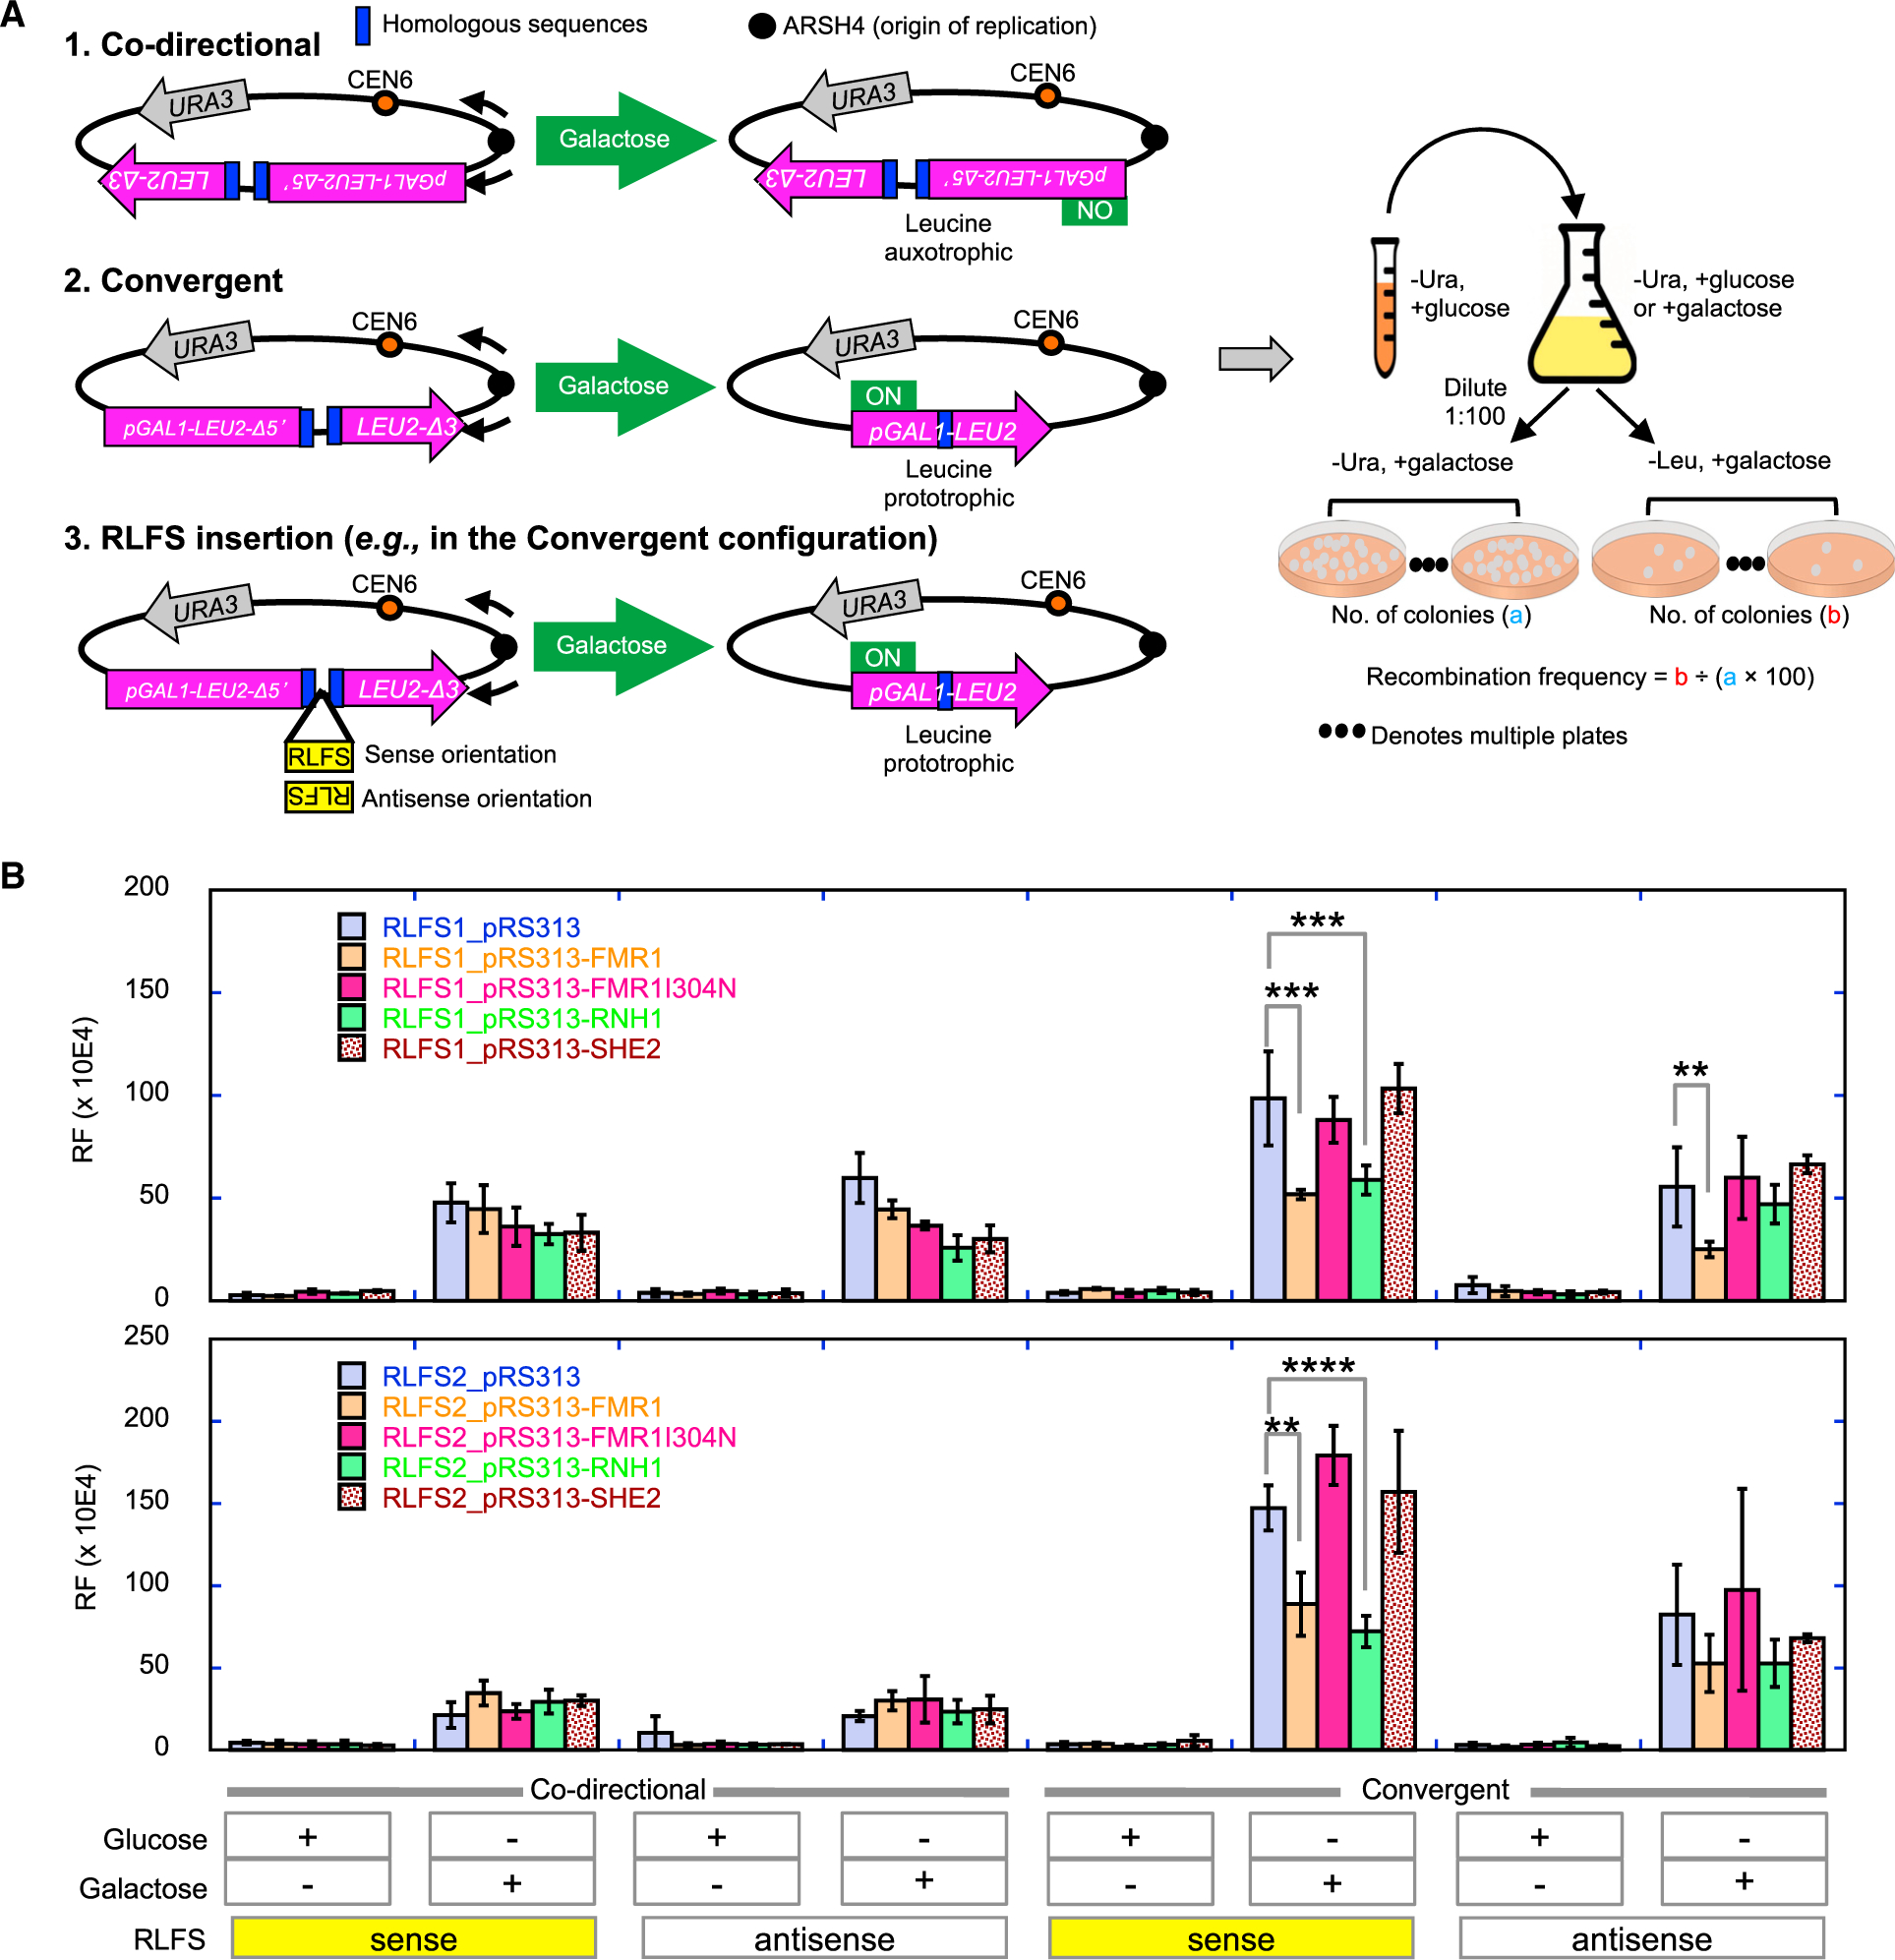
(A) A non-functional LEU2 marker containing 2 inserted direct repeats and driven by a galactose-inducible GAL1 promoter was placed next to an origin of replication (ARSH4), such that the direction of transcription is convergent or co-directional with respect to the direction of the proximal replication fork. Upon galactose induction, convergent replication and transcription would induce DSBs and homologous recombination repair to generate a functional LEU2, resulting in leucine prototrophy. Two RLFSs from the human genome (RLFS1–1 from the promoter of FMR1 and RLFS-2 from intron 5 of the fragile histidine triad) were inserted between the direct repeats to test for enhanced DSB and recombination. A non-RLFS sequence without predicted R-loop forming propensity and with similar G-richness in both strands served as the control. All of the sequences were similar in size (~500 bp). The RLFSs were inserted in the sense or anti-sense orientation with respect to LEU2 transcription (i.e., G-rich strand on the non-template or template strand, respectively), with the sense orientation expected to preferentially induce R-loop formation. The control sequence was also inserted in two orientations, and no difference in RF was observed between them (see Figure S5C). RF is calculated based on the percentage of leucine prototrophs after plating.
(B) The effect of ectopic expression of indicated genes on the pRS313 plasmid, under the cytomegalovirus (CMV) promoter, on RLFS-induced RF. Error bars indicate standard deviation. **p < 0.01, ***p < 0.001, and ****p < 0.0001.
See Figure S7 for additional control experiments.
DISCUSSION
FX Cells Are Intrinsically Unstable and More Susceptible to Replication Stress-Induced Chromosome Breakage on a Genome-wide Scale
The main discovery from our study is the inherent genome instability in FX cells. Our study marks the first demonstration of genome-wide chromosomal breakage in FX cells, with or without replication stress by APH. This represents a development in our understanding of FXS biology. FX cells were molecularly characterized by a fragile site called FRAXA at the FMR1 locus on the metaphase chromosome, specifically induced by folate stress, in individuals with full mutation of the CGG repeat expansion. While there were abundant studies measuring FRAXA site expression, relatively few compared the number of CFSs induced by APH in FX cells to controls. One study reported a >3-fold increase in the CFS frequencies in FX patients (27.9%) compared to unaffected controls (7.9%) when their cells were treated with APH (Murano et al., 1989). This result is consistent with our observation of the >2-fold increase in DSBs in FX cells compared to controls. The global induction of DSBs in the FX genome also corroborated the observed increased DSB formation assayed by γH2A.X staining and Comet assay. It is noteworthy that our observation of increased γH2A.X staining in human FXS patient-derived cells contrasts the reduced γH2A.X staining in fmr1−/− mouse embryonic fibroblasts (Alpatov et al., 2014). Moreover, we observed a robust DDR in the FX cells in response to APH, also contrary to the reported deficiency in DDR in the FX mouse model (Alpatov et al., 2014). Our study thus revealed fundamental differences between the human cells from FXS and those from the mouse model. However, we note that the ATM protein level in the untreated conditions is lower in the FX cells relative to the control, consistent with a previous report of decreased expression of DNA repair genes in the FX patients (Xu et al., 2013). Therefore, future investigation into how changes in the gene expression of the DNA repair pathway directly affects genome stability in FX cells would be warranted.
The comparison between our DSBs and previously identified core sequences of CFSs did not yield a statistically significant correlation. We believe this was at least partially due to the differential usage of solvents for APH in the literature. Since the first documented usage of ethanol and DMSO as solvents for APH in inducing CFSs (Glover et al., 1984), different laboratories have taken to use either solvent for their studies. To the best of our knowledge direct comparison of DMSO and APH has only been documented in a single study using two subjects (Kuwano and Kajii, 1987). Unfortunately, the effect of DMSO alone on CFS induction was not measured. Among the studies in which the CFS core sequences were derived (Savelyeva and Brueckner, 2014), all but one study used ethanol. The study by Zimonjic et al. (1997) used either ethanol or DMSO to map FRA3B and the results were an undifferentiated mixture. The study by Le Tallec et al. (2013) did not indicate the solvent used. Notably, the DSBs in our study showed significant correlation with those identified by another DSB mapping method (BLESS) (Crosetto et al., 2013). Both studies used DMSO as the solvent. Therefore, it appears that CFS formation is a product of both APH and other undefined cellular effects by ethanol or DMSO, rendering comparison between studies that have differential usage of solvent rather tenuous. Our study showed that DMSO sensitizes RLFS regions for DSBs in both NM and FX cells. DMSO is one of the most common solvents for organic compounds and facilitates the delivery of drugs across cellular membranes. It is also known as an antioxidant with a protective role for human tissues by interacting with the hydroxyl group on various substances. However, depending on the concentration and cellular context, DMSO can function as an antioxidant or a pro-oxidant (Kang et al., 2017; Liu et al., 2001; Pérez-Pastén et al., 2006; Sadowska-Bartosz et al., 2013). We discovered that 0.02% DMSO can cause chromosome breakage, at least in human lymphoblastoids, through an unknown mechanism. Thus, it is imperative to understand the full cellular and genomic impact by DMSO to inform drug treatment involving DMSO as a solvent.
A Role for FMRP in Preventing R-Loop Formation during Replication Stress
Our study also provided an explanation for why the FX genome is inherently unstable. We showed that there are two types of DSBs in FMRP-deficient FX cells: those occurring in both control and FX cells in gene-poor regions with delayed replication timing and those occurring specifically in FX cells near RLFSs within genes. The latter suggests that FMRP plays a role in preventing R-loop formation during replication-transcription conflicts. We demonstrated that FX cells accumulate R-loops upon replication stress. We then homed in on those “at-risk” genes that harbor DSBs in the FX genome and found them to be enriched in the neuronal differentiation and synapse organization pathways, linking genomic instability to the FXS pathology. The notion that replication-transcription conflict underlies defective neuronal gene expression presents an apparent conundrum that neurons are predominantly postmitotic cells. However, we reckoned the following. FX patients usually develop signs of ID such as delayed speech by the age of 2 years, shortly after new neuronal growth stops at ~18 months. This suggests that FMRP deficiency may affect neurogenesis during a period of mitotic growth with active replication and gene expression. In addition, neurogenesis continues to occur in adult brain regions such as the hippocampus, and specifically, the dentate gyrus (Boldrini et al., 2018; Curtis et al., 2012; Eriksson et al., 1998; Kempermann et al., 2015). ID in FX is thought to be due to dysregulated synaptic plasticity in the hippocampus, and FMRP expression is enriched in the dentate gyrus and field CA1 neuronal cells in the hippocampus, among other regions of the mouse brain (Zorio et al., 2017). Moreover, FMRP is also expressed in glial cells such as astrocytes of the developing central nervous system in mice. These cells are important regulators of neuronal development in FX. Studies have shown that hippocampal neurons from a normal mouse displayed abnormal dendritic morphology when co-cultured with astrocytes from a mouse with FMRP deficiency, and this phenotype was rescued by normal astrocytes (Jacobs et al., 2016). Finally, our results indicate that not all DSBs in FX cells are induced as a result of replication-transcription conflict.
Many of the “at-risk” genes in FX cells were previously identified as mRNA substrates regulated by FMRP on the polysomes. These results led us to hypothesize that FMRP binds to its gene substrates on the chromatin during transcription, before transporting the mRNAs to the ribosomes for translation. We observed that DMSO or APH caused DSBs to gravitate toward RLFSs in FX cells, whereas only DMSO, not APH, elicited the same response in NM cells. The implications for these results are 2-fold. First, they suggest that DMSO induces a strong transcriptional response and can cause DSBs at RLFSs. Second, replication stress by APH activates FMRP and lowers the incidence of DSBs at RLFSs compared to DMSO in NM cells. Hence, in the absence of FMRP, FX cells fail to protect their genome upon replication stress. This notion is supported by the observation that ectopic expression of FMRP reduced DNA damage in FX cells. These results are consistent with an FMRP function in genome maintenance, particularly during replication stress.
However, we do not believe FMRP interacts with the replication fork directly. In fact, we have not found any evidence for FMRPs associating with replication forks from the literature. Instead, our results suggest a scenario in which FMRP interacts with transiently formed R-loops during transcription and facilitates the passaging of replication forks traversing toward the transcription machinery so as to prevent chromosome breakage. This previously unknown function of FMRP is supported by its ability to suppress RLFS-induced recombination during programmed replication-transcription conflict, which is dependent on its KH2 RNA-binding domain. This function is also consistent with the known affinity of FMRP for RNA, single-strand DNA (ssDNA), and dsDNA (Ashley et al., 1993), three substrates that are all present in an R-loop. Alternatively, FMRP can mediate R-loop formation by forming complex with other R-loop interacting proteins. For instance, FMRP can form complex with DNA topoisomerase III β (TOP3B) and Tudor domain-containing protein 3 (TDRD3), which have been shown to prevent R-loop formation at cMYC/immunoglobulin DSB sites (Nott and Tsai, 2013). FMRP was also reported to interact with the THO/TREX (suppressors of the transcription defects of hpr1Δ mutants by overexpression-Transcription and Export) complex, a messenger ribonucleoprotein (mRNP) transporter known to be involved in R-loop prevention (Domínguez-Sánchez et al., 2011), through affinity purification (Hein et al., 2015). Finally, the DSBs in FX cells might be triggered by the dysregulated expression of nucleases such as MUS81, ERCC1, and XPF, independent of R-loop formation (Chappidi et al., 2020; Matos et al., 2020; Naim et al., 2013; Ying et al., 2013).
A Potential Mechanism Linking Increased Protein Synthesis to Genome Instability in the Absence of FMRP
Our data suggested that RNA:DNA hybrids localized to dark areas of the nucleus, likely the nucleolus, in FX cells. These results are consistent with the observed correlation between DSBs and RLFSs, preferentially occurring on rDNA-bearing chromosomes, which are residents of the nucleolus. Are rDNA-bearing chromosomes prone to DSBs simply by virtue of being proximal to the nucleolus as a locale, or is there an underlying cause for these chromosomes to generate RLFS-associated DSBs? We favor the latter explanation. While the 45S rDNA array residing on the short arms of five acrocentric chromosomes (13, 14, 15, 21, and 22) defines the nucleolus, the 5S rDNA array is a resident of chromosome 1 and the 5S and 45S rDNA arrays are not in close proximity spatially in human lymphoblastoid cells (Yu and Lemos, 2016). This suggests that DSB-RLFS association on these chromosomes is not mediated by proximity to the nucleolus per se. Instead, we reason that the act of transcription on the chromosomes containing 45S rDNA subjects them to increased R-loop formation and chromosome breakage. FMRP deficiency leads to elevated levels of protein translation (Darnell et al., 2011), which would be reliant on an increased rate of ribo-some production. Therefore, we hypothesized that FX cells, to sustain high levels of rRNA transcription, relay the stress, likely torsional in nature, from the rDNA loci intrachromosomally onto the remainder of the chromosome, causing heightened replication-transcription conflicts and chromosome breakage.
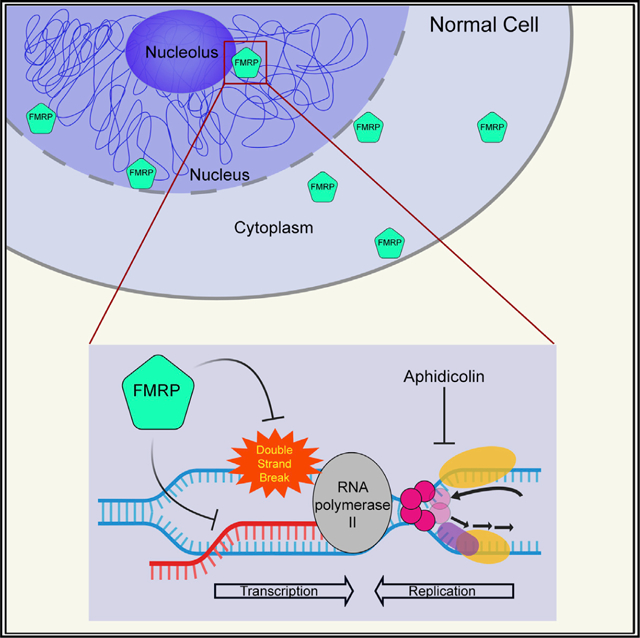
In summary, our study led us to a model in which FMRP guards its gene substrates from the nucleus to the cytoplasm (Figure 7). While its main function is a translation regulator on the polysomes, FMRP increases its nuclear presence to prevent R-loop formation and chromosome breakage during heightened replication-transcription conflicts. We note that FX cells also produce spontaneous DSBs at a higher level than NM cells, and these spontaneous DSBs are not correlated with RLFSs. This suggests that FMRP has additional protective role(s) toward the genome without external replication stress. Recent studies have shown that FMRP deficiency causes an imbalance of epigenetic modifications due to unregulated protein synthesis (Korb et al., 2017; Li et al., 2018). It is plausible that the spontaneous chromosome breakage in FX cells is a result of altered histone modifications that predispose specific regions of the chromatin to breakage. Together with our discovery that FMRP directly interacts with the chromatin (data not shown), these attributes make FMRP a mediator of transcription and replication to prevent R-loop accumulation and ensure genome integrity, thereby maintaining synaptic plasticity in neuronal cells.
Figure 7. Proposed Model for FMRP R-Loop Regulation and DSB Prevention.
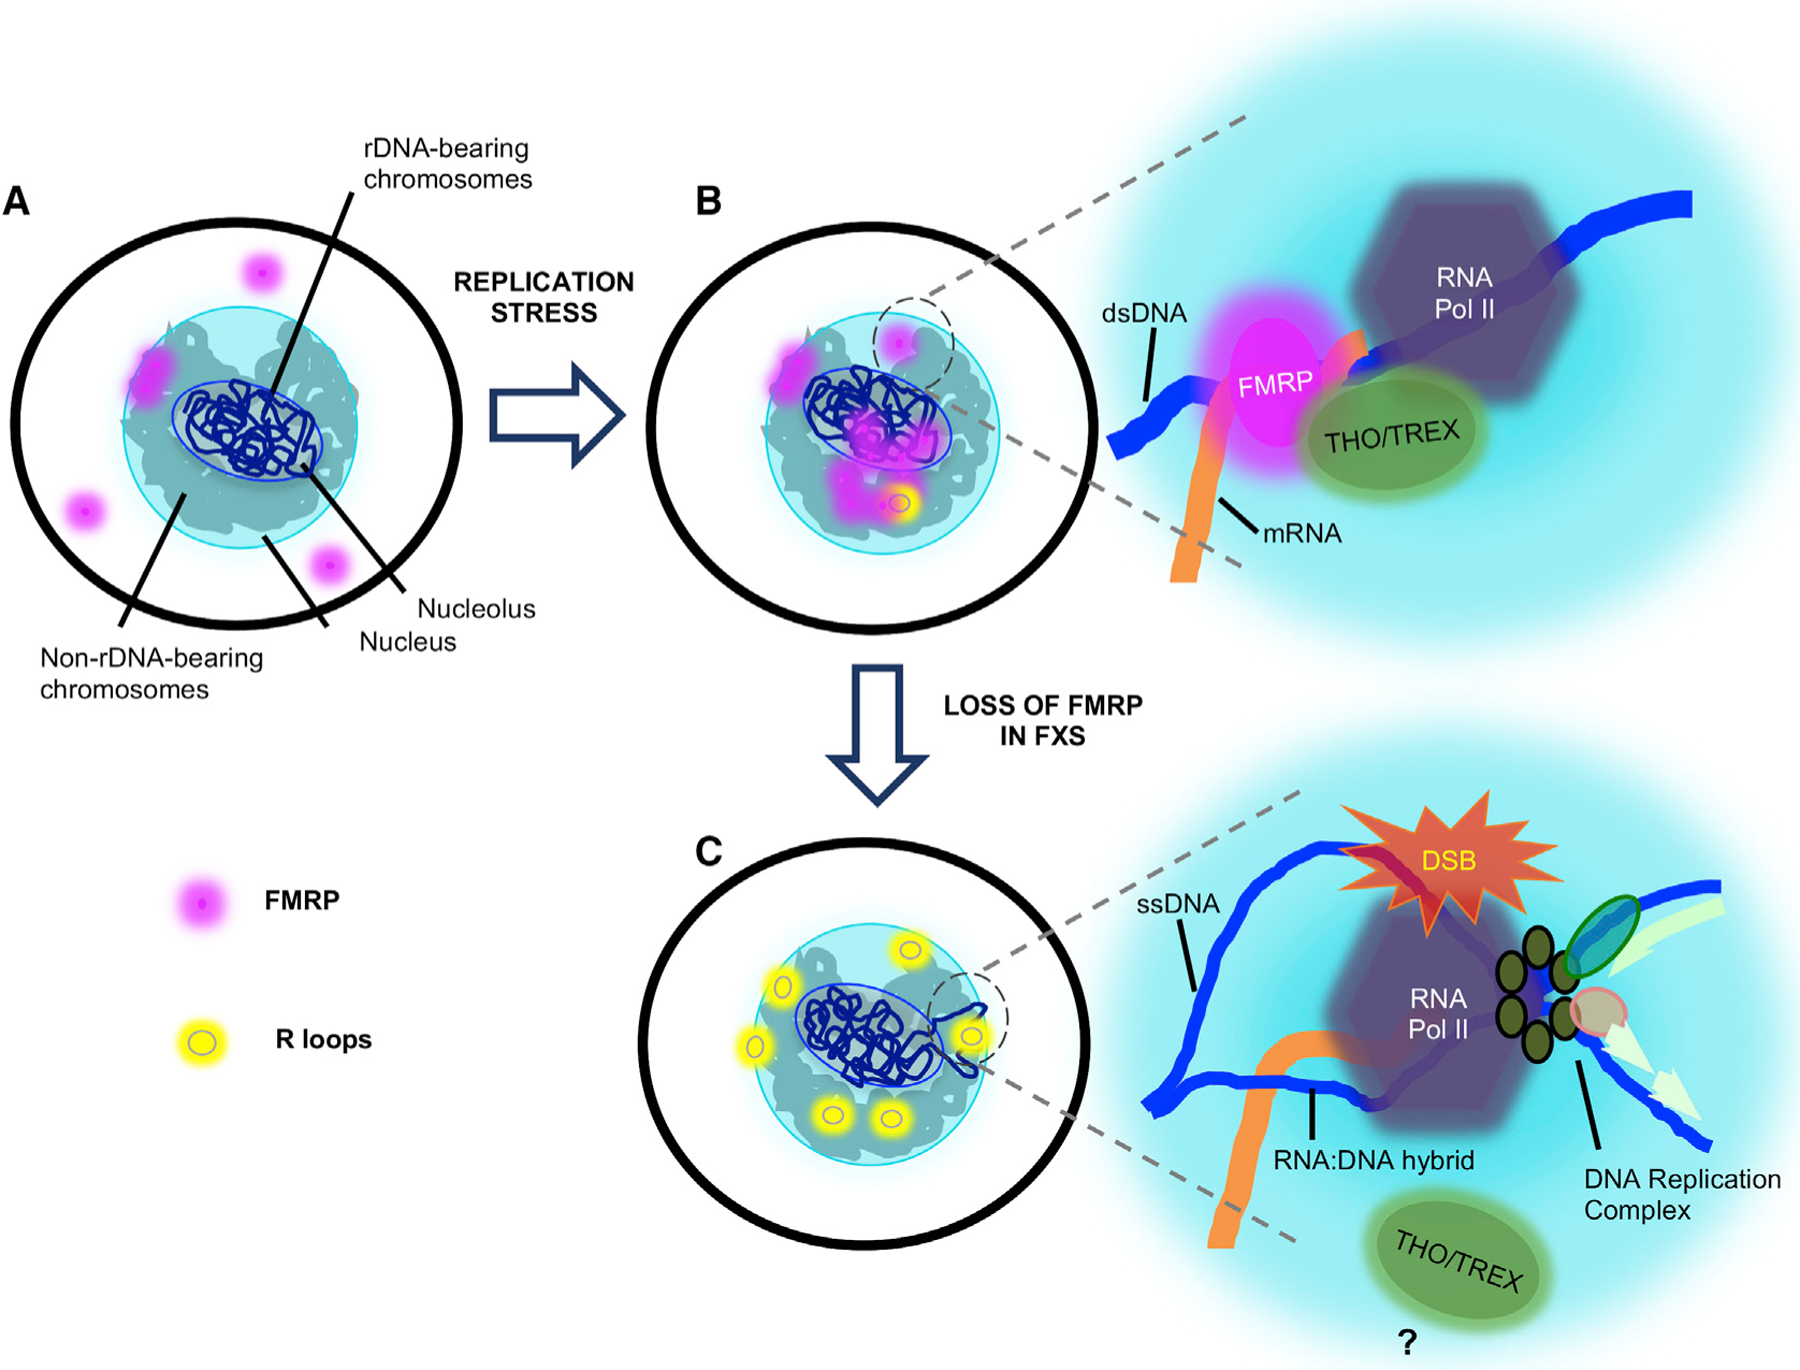
(A) Illustration of a normal cell without any treatment, showing FMRP in the cytoplasm and in the nuclear periphery, possibly engaged in mRNA transport.
(B) Under replication stress induced by DMSO and APH, FMRP increases its presence in the nucleus. At the junction of replication and transcription collision, FMRP, in conjunction with R-loop processing factors such as the THO-TREX complex, is involved in R-loop removal and avoidance of a deleterious collision (inset). dsDNA, double-stranded DNA.
(C) In FX cells, increased protein synthesis rate demands high-level rRNA production on the rDNA-bearing chromosomes, which in turn causes increased levels of (RNA Pol II) transcription elsewhere on these chromosomes, represented by the chromosome loops tethered to the nuclear pores for active transcription. The absence of FMRP permits stable R-loop formation and DSBs upon the collision of replication and transcription (inset). ssDNA, single-strand DNA.
STAR★METHODS
RESOURCE AVAILABILITY
Lead Contact
Further information and requests for resources and reagents should be directed to and will be fulfilled by the Lead Contact, Wenyi Feng (fengw@upstate.edu).
Materials Availability
Plasmids generated in this study will be made available upon request following publication.
Data and Code Availability
All primary sequencing data and processed data described in this manuscript have been deposited in the NCBI Gene Expression Omnibus (GEO; http://www.ncbi.nlm.nih.gov/geo/) under the accession number GEO: GSE124403.
EXPERIMENTAL MODEL AND SUBJECT DETAILS
Cell line growth and culture conditions
Human EBV transformed lymphoblastoid cell lines, GM06990 (control) and GM03200 (Fragile X), and fibroblast cell lines, GM00357 (control) and GM05848 (Fragile X), were purchased from Corielle institute. Lymphoblastoids were grown in RPMI1640 (Corning), supplemented with GlutaMAX (GIBCO), 15% heat-inactivated FBS (Fetal Bovine Serum, Benchmark), 100 IU/mL penicillin and 100 μg/mL streptomycin (Corning) at 37°C with 5% CO2. Fibroblast cells were cultured in MEM culture media with 15% FBS (Corning), 1X GlutaMAX, 100 IU/mL penicillin and 100 μg/mL streptomycin. Cell lines were verified for presence or absence of FMRP and expansion of the FMR1 5′UTR using western blot and Southern blot respectively. See Figures 1A and S1A for results. Phoenix-AMPHO producer cells (ATCC) were grown in DMEM medium (GIBCO) supplemented with 10% FBS, 1X GlutaMAX, 100 IU/mL penicillin and 100 μg/mL streptomycin, 1mM sodium pyruvate (Corning), 10mM HEPES buffer (Corning) and 1X MEM non-essential amino acids (Corning).
Yeast strains
Yeast strains used in this study were BY4741 (MATa his3Δ1 leu2Δ0 ura3Δ0 met15Δ) and its isogenic derivative rnh1Δ (MATa ura3Δ0 leu2Δ0 his3Δ1 met15Δ0 rnh1Δ::KAN, EUROSCARF collection (Entian et al., 1999)). Yeast cells were either grown in YEPD or synthetic complete (SC) media with specific amino acids omitted as indicated in ‘Recombination Frequency Assay’ below. All yeast strains were grown at 30°C with horizontal shaking for liquid cultures.
METHOD DETAILS
Cell line drug treatment conditions
Cells were treated at a density of 0.4–0.5×10⁶ cells/ml or 30%–40% confluency for lymphoblastoids and fibroblasts, respectively, with APH (A. G. Scientific) at the indicated concentrations, solvent (DMSO, 0.02%, same as the concentration in the APH-treated samples) only, or nothing, for 24 h before harvest.
Cloning
EGFP was PCR amplified from pcDNA3-EGFP (Addgene #13031) using forward primer, pcDNA3_RMEGFP_JL_FWD2, and reverse primer, pcDNA3_RMEGFP_JL_REV2, and cloned into pMSCVpuro (Addgene K1062–1) at the HpaI site to create pMSCVpuro-EGFP. Full length FMR1 was PCR amplified from pFRT-TODestFLAGHAhFMRPiso1 (Addgene #48690) using forward primer, pFRT_RMFMRP_JL_FWD2 and reverse primer, pFRT_RMFMRP_JL_REV2, and cloned into pMSCVpuro-EGFP at EcoRI site, creating pMSCVpuro-EGFP-FMRP.
Lentiviral-assisted cell transfection
pMSCVpuro-EGFP-FMRP and pMSCVpuro-EGFP constructs were packaged into retrovirus using Phoenix-AMPHO producer cells (ATCC) following the manufacturer’s protocol. Briefly, Phoenix cells were grown to 30%–40% confluence in a 100-mm plate and were transfected with 20 μg plasmid DNA using 60 μl of TransIT-2020 transfection reagent (Mirus Bio), followed by incubation at 37°C for 48 h with a medium change at 24 h. At 48 h, the supernatant containing virus (T1) was collected, passed through a 0.45-μm filter, and used immediately for infection, while the remaining cells was used for second round of virus collection after the addition of 8 mL fresh DMEM. A second production of virus (T2) was collected after 24 h, processed as described above and used for a second round of infection. GM05848 (FX) cells were transduced for two rounds with retrovirus produced above, pooled and subjected to 2 μg/ml puromycin selection for 3 days. Cells were passaged after reaching confluency and maintained in DMEM containing 0.25 μg/ml puromycin. FMRP expression was confirmed with western blot.
Flow cytometry for cell cycle analysis
Approximately 1.5–2×10⁶ cells from the Break-seq experiments were harvested for flow cytometry. Cells suspended in 1 mL of PBS were slowly added to chilled absolute ethanol and stored in −20°C. Fixed cells were pelleted at 250xg for 15 m at room temperature and then rehydrated with 5 mL PBS for 15 m. Cells were again pelleted and resuspended at 0.5×10⁶ cells/ml in propidium iodide solution (40 μg/ml propidium iodide, 100 μg/ml RNase A in PBS) and incubated for 20 m at 37°C. Cells were passed through filter-topped flow tubes (BD Falcon) using a luer-lock syringe and analyzed using Becton Dickinson Fortessa Cell Analyzer (BD Biosciences). Data were analyzed by FlowJo.
Flow cytometry for quantification of cells stained for γH2A.X
Approximately 3×10⁶ lymphoblastoids were treated with APH, DMSO or nothing. For compensation control, an additional 3×10⁶ cells were subjected to 2 flashes of UV irradiation at 20 μJ/cm2 and allowed to recover for 4 h before harvest. Cells were treated with 1:500 diluted Zombie Aqua (Violet, Biolegend) to stain dead cells, followed by a wash in FACS buffer (2% FBS in PBS). Cells were then fixed in 500 μL of 4% paraformaldehyde, permeabilized by 500 μL methanol, and stained with 100 μL of a 1:50 dilution of anti-γH2A.X conjugated to phycoerythrin (Cell signaling #5763S) in dilution buffer (0.5% BSA in 1x PBS) for 1 h. Cells were then centrifuged and washed in dilution buffer followed by 1x PBS. Cells were resuspended in FACS buffer and filtered through filter-topped flow tubes (BD falcon) using a luer-lock syringe. Samples were analyzed using Becton Dickinson Fortessa Cell Analyzer (BD Biosciences) and data analyzed by FlowJo. Live and γ-H2A.X-positive cells were gated by Zombie Aqua dye (staining for dead cells) and γ-H2A.X signals from untreated NM cells. The same gate was applied to all other samples for quantification of percentage of cells with γ-H2A.X signals greater than those gated cells (solid red boxes in Figure 1). Ten thousand cells were analyzed in each of three independent experiments. Percentage of cells with DNA damage were calculated based on the number of cells above the baseline FI and total live cells.
Immunocytochemistry and microscopy
For lymphoblastoid cells: Approximately 3×10⁶ cells having undergone drug treatment described above were washed twice in PBS before fixing with 500 μL of methanol or 4% paraformaldehyde in microfuge tubes. For fibroblasts: Approximately 1×10⁵ cells were plated on poly-D-lysine (Sigma Aldrich)-coated coverslips and cultured for 72 h, followed by drug treatment for 24 h. For both lymphoblastoid cells and fibroblasts: Cells were washed with 500 μL PBS twice, fixed with 500 μL 2%–4% paraformaldehyde for 20 m at room temperature followed by gentle washing with PBS three times. Cells were then blocked with 500 μL PBSAT (1% BSA, 0.5% Triton X in PBS) for 1 h, followed by incubation with 100 μL of primary antibody solution for 1 h or overnight, washed with PBSAT, and incubation with 100 μL secondary antibody for 1 h. For experiments with RNase H treatment, cells were first permeabilized with PBSAT for 20 m before incubation with 15 U RNase H (NEB M0297L) in 500 μl reaction buffer per sample, with control cells incubated in 500 μl of PBS per sample, at 37°C for 3 h. Cells were then blocked with PBSAT and incubated with antibodies as described above. Cells were then washed with PBSAT, followed by PBS, and mounted onto microscope slides in mounting media (Prolong Diamond antifade plus DAPI, Invitrogen) and allowed to solidify for 24 h before imaging on Leica STP 800 wide-field fluorescence microscope (for lymphoblasts) or Leica SP8 confocal (for fibroblasts). Antibodies used for immunostaining include the following: primary antibodies (anti-γH2A.X, Cell Signaling #9817S, 1:400; S9.6, Kerafast #ENH001, 1:250; anti-Lamin A&C, Novus Biologicals #NBP2–25152, 1:500; and anti-nucleolin, Abcam #22758, 1:1000) and secondary antibodies (Alexa fluor 488, 568, and 647 [anti-chicken or anti-rabbit], Invitrogen #A21206, A10037, A21449, A21244 respectively, 1:400).
To quantify γH2A.X staining signals maximum projection of 3D image stacks acquired from 2D imaging planes with a step size of 0.2 micron along the z axis was performed using the MetaMorph software (Molecular Devices). Image stacks were deconvolved using the AutoQuant software. In Fiji, DAPI was used to create region of interest (ROI) of nuclei in γH2A.X channel for individual cells. Maximum intensity projections adjusted for background in Fiji were used to quantify γH2A.X intensities in ROI. At least 28 nuclei per sample per experiment in three independent experiments were analyzed. To determine R-loop signals in the nucleus, 2D single plane images from two biological replicate experiments were acquired and analyzed. Lamin or DAPI staining was used to define the nuclear periphery, which was overlaid with S9.6 channel to measure integrated density in Fiji. Representative images adjusted for background and contrast are shown. Statistical analysis was done using GraphPad Prism 7 and values were plotted in Kaleidagraph.
Single cell gel electrophoresis assay
Neutral comet assay was performed using the TREVIGEN reagent kit (cat#4250–050-K) according to the manufacturer’s instructions. Comet images were analyzed using the CaspLab software (Końca et al., 2003).
Break-seq library construction
Lymphoblastoids GM03200 and GM06990 were used for Break-seq analysis. Three independent experiments were performed, wherein Set A and B were technical replicates from the same experiment and Set D and E were biological replicates. Break-seq procedures were as described previously with modifications (Hoffman et al., 2015). 5×10⁶ cells were embedded into 0.5% Incert low-melting point agarose in PBS and cast into plugs. The agarose plugs were then incubated at 50°C overnight in 6 mL of lysis buffer (0.5 M EDTA, 1% Sarkosyl, 200 μg/ml Proteinase K). The DNA in the agarose plugs was then end-labeled in-gel using the End-It Kit (Epicenter) with biotinylated dNTP mix (1 mM dTTP, dCTP, dGTP, 0.84 mM dATP, 0.16 mM Biotin-14-dATP). Plugs were then treated with β-Agarase (NEB) to digest agarose and release DNA. DNA sample was then sonicated using a Covaris M220 using the snap-cap DNA 300 bp shearing protocol. DNA was then processed using a PCR Cleanup Kit (QIAGEN) and run on agarose gel to verify the fragmentation pattern of DNA and quantified on a Nanodrop. 10–11 μg of DNA was then end repaired (Epicenter) and purified by the PCR Cleanup Kit (QIAGEN). The DNA was then A-tailed by A-tail Kit (NEB) or Klenow exo- (NEB E6054A) and purified by PCR Clean-up Kit (QIAGEN), followed by quantification on a Nanodrop. M270 Dynabeads (Life Technologies) were used to purify biotinylated DNA. The amount of DNA bound to beads was calculated by measuring the quantity of DNA in the flow through. DNA-bound beads were then resuspended in ligation mix containing Illumina adaptors (50 μM adaptor-1, 50 μM adaptor-2, 1x T4 ligase buffer, 3 μl T4 DNA ligase) and incubated overnight at room temperature on a roller. 400 ng of DNA bound to beads was used for PCR amplification using KAPA Hotstart Ready Mix (KAPA). Each sample was given a specific index primer for multiplexing. PCR product was then run on agarose gel to verify amplification and quantity. AMPure beads (Agencourt) were used to remove free adaptors and the final product was analyzed on agarose gel. Break-seq libraries were sequenced on Illumina Hi-Seq 2500 with 100 or 150 bp paired-end reads, followed by Break-seq data analysis. Adaptor sequences and index primer sequences were previously described (Hoffman et al., 2015).
Western blot
For protein expression in human cell lines, whole cell extracts were prepared by lysing cells in RIPA buffer (50mM Tris HCl pH 7.4 / 150mM NaCl / 0.5% sodium deoxycholate / 0.1% sodium dodecyl sulfate/ 1% NP-40) containing Halt protease and phosphatase inhibitor cocktail (Thermo Scientific) and approximately 20 μg of proteins were analyzed by 4%–15% gradient TGX Precast polyacrylamide gel (Bio-Rad), transferred onto a nitrocellulose membrane and probed for specific proteins. The following antibodies were used: anti-ATR (Santa Cruz Biotechnology #sc-516173, 1:250), anti-ATM (abcam #ab32420, 1:250), anti-Chk1 (Santa Cruz Biotechnology #sc-8408, 1:100), anti-RPA2 (abcam #2175, 1:200), anti-H2A.X (Santa Cruz Biotechnology #sc-517336, 1:1000), anti-phospho-ATM (Ser1981) (abcam #ab81292, 1:500), anti-phospho-ATR (Ser428) (Cell signaling technology #2853S, 1:500), anti-phospho-Chk1 (Ser345) (ThermoFisher Scientific #MA5–15145, 1:50), anti-phospho-RPA2 (Thr21) (abcam #109394, 1:1000), anti-phospho-H2A.X (Ser139) (Cell signaling technology #9817S, 1:250), anti-GAPDH (Santa Cruz Biotechnology #sc-47724, 1:1000) and anti-FMRP (Biolegend #834601, 1:1000).
For yeast whole cell extracts, a single colony was inoculated in 10 mL SC-HIS-URA and grown overnight. Cells were centrifuged at 3000 rpm for 5 m, frozen and stored at −80°C until further use. Frozen cell pellets were thawed in 250 μl TBS [50 mM Tris pH 7.5 / 100 mM NaCl / Halt protease inhibitor cocktail (Thermo Scientific)]. Cell suspension was vortexed at 4°C for 15 m after the addition of 200 μL sterile glass beads, followed by centrifugation at 13500 rpm at 4°C for 10 m. The supernatant was retained and protein concentration was determined by Bradford assay (BioRad). Approximately 25 μg of proteins was analyzed on 10% SDS-PAGE followed by western blots using monoclonal anti-FLAG-M2-Peroxidase (HRP) (Sigma Aldrich, 1:2000) and anti-actin (MP Biochemical, 1:4000).
Yeast strains and plasmids
Yeast centromeric plasmids pARS-GLB-OUT (OUT) and pARS-GLB-IN (IN) containing GAL-OUT/IN recombination constructs were provided by and described previously (Prado and Aguilera, 2005). Specifically, these plasmids were designed with the leu2Δ3’::leu2Δ5’ direct-repeat recombination system under the GAL1 promoter. The plasmid also contains ARSH4, URA3, CEN6 and the 83 bp (C-A1–3)n telomeric sequences from pRS304 lacking the EcoRI site at the polylinker. Human gene sequences for recombination assay (see below) were cloned between the direct-repeat recombination system (leu2Δ3′:human gene sequence: leu2Δ5′) using BglII. The following primers containing BglII site in the forward and BamHI site in the reverse were used for the described sequences: a) control-1_F and control-1_R; b) control-2_F and control-2_R; c) RLFS-1_F and RLFS-1_R; d) RLFS-2_F and RLFS-2_R.
The above sequences were PCR amplified from human genomic DNA. Sequences were inserted in two orientations due to compatibility of ends generated by BglII and BamHI and both the orientations were used to measure recombination frequencies for all sequences. The sequences were inserted in both the IN and the OUT constructs. pFRT-TODestFLAGHAhFMRPiso1 plasmid (Addgene) was used to subclone an SpeI/BclI-digested CMV-FMRPiso1 fragment into pRS316 at the XbaI and BamHI cloning sites. The resulting construct, pRS316-CMV-FMRPiso1, was then digested with NotI and EcoRI to obtain the CMV-FMRPiso1 fragment. The fragment was subcloned into pRS313 digested with NotI and EcoRI producing the final construct pRS313-CMV-FMRPiso1. pRS313-CMV-FMRPiso1I304N was generated using the same procedure from the pFRT-TODestFLAGHAhFMRPiso1I304N plasmid (Addgene).
Recombination frequency assay
The IN and OUT plasmids were first transformed in BY4741 or rnh1Δ and selected in SC without uracil in 2% glucose. The fluctuation assay was performed as previously described with modifications (Prado and Aguilera, 2005). Briefly, selected transformants were streaked onto SC-URA+2% Glucose and SC-URA+3% Galactose. Plates were incubated for 4 days at 30°C to suppress or induce transcription through the GAL1 promoter respectively. Six single colonies for every sample were re-suspended in 1 mL –N media (1.61 g/l YNB without (NH4)2SO4 or amino acids, 94 mM succinic acid and 167 mM NaOH) and sonicated. Serial dilutions were prepared for each of the six colonies per sample: 1:15, 1:150 and 1:1500 in a 96-well plate. 100 μL of diluted samples were plated in SC-URA+3% Galactose for calculation of totals. For calculation of recombinants; 100 μl from undiluted was plated onto SC-LEUURA+3% Galactose. Plates were incubated for 3 days at 30°C, and colonies were counted to calculate recombination frequency as follows:
Recombination frequency was calculated for each of the six colonies per sample and the median value was used as the recombination frequency of a sample. Three independent experiments were conducted for each construct and treatment (glucose and galactose) and standard deviations were calculated for graphical representation and to estimate error.
For experiments with FMRP expression the IN and OUT plasmids with or without RLFS were co-transformed with pRS313-CMV-FMRPiso1, pRS313-CMV-FMRPiso1I304N or pRS313 into BY4741 and selected in SC-URA-HIS+2% glucose. Recombination frequency assay was conducted as described above with the totals plated in SC-URA-HIS+3% galactose and the recombinants were plated in SC-LEU-URA-HIS+3% galactose.
Gene ontology analysis and identification of pathways that are potentially altered by treatment
Gene ontology analyses were performed via DAVID Bioinformatics tools (https://david.ncifcrf.gov), DiffBind, or WebGestalt (http://webgestalt.org).
QUANTIFICATION AND STATISTICAL ANALYSIS
Break-seq DSB peak identification
Raw sequence reads were obtained from Illumina Hi-seq 2500 and then aligned to the UCSC human genome assembly, GRCh37/hg19 (http://hgdownload.soe.ucsc.edu/goldenPath/hg19/bigZips/), using Bowtie 2 (http://bowtie-bio.sourceforge.net/bowtie2/index.shtml) in the “–local” mode. The PCR duplicate reads were removed using Picard MarkDuplicates (http://broadinstitute.github.io/picard). The non-redundant mapped sequence reads were sorted and then converted to BAM files using SAMtools (Li et al., 2009) (http://samtools.sourceforge.net/) and subjected to subsequent processing with Model-based Analysis for ChIP-seq (MACS version 2.1.1, https://pypi.org/project/MACS2/2.1.1.20160309/) using two-sample analysis between break-seq samples (treatment) and whole genome sequencing data (control) using the callpeak function in MACS2 with a p value < 1e-5. For identification of PacI-digested breaks, DSB peaks with perfect match to PacI motif (TTAATTAA) were mapped onto the hg19 reference genome with Bowtie. IntersectBED function from BEDtools (Quinlan and Hall, 2010) was then used to find overlap between PacI motif sites and peaks identified through MACS2. These overlapping peaks were considered PacI sites found in the Break-seq sample.
Random permutation tests for identification of PacI sites
The shuffleBed function in BEDtools was used to randomly permute the genomic locations of DSBs identified as PacI sites with default parameters to generate random genomic locations as a null distribution, preserving the size of DSBs and number of DSBs per chromosome. The fraction of sequences containing PacI motif was calculated. One thousand iterations of this process were performed. The distribution of the PacI-positive fractions was then compared to that from the experimental dataset and One Sample Student’s t test was performed.
Break-seq library complexity calculation and identification of consensus DSB peaks in replicate experiments
All biological replicates for each sample (strain/treatment combination) were pooled for assessment of library complexity by preseq (Daley and Smith, 2013). All 23 Break-seq peak files were analyzed in DiffBind (Ross-Innes et al., 2012) for consensus DSB peak identification. Consensus DSB peaks were defined as those that appear in at least two replicate experiments, regardless of the total number of replicates, for each sample (cell line/treatment). Aphidicolin-treated samples (0.03 μM and 0.3 μM) were combined to form a composite APH-treated sample, for both NM and FX cells, and consensus DSB peaks were then extracted similarly as described.
Correlation between DSBs and other genomic features
The association between DSBs and other genomic features including RLFSs and DRIP-seq signals was determined using the bedtools annotate function. Multiple datasets of DRIP-seq were concatenated (cat GSE70189_NT2_DRIPc_peaks GSM1720615_NT2_DRIP_1_peaks GSM1720616_NT2_DRIP_2_peaks GSM1720617_NT2_DRIP_RNaseA_peaks GSM1720618_NT2_DRIP_RNaseH_peaks GSM1720619_K562_DRIP_peaks.clip > composite.DRIP), sorted (sort -k1,1 -k2,2n composite.DRIP > composite.DRIP.sorted) and then merged into a composite dataset using the bedtools merge function (bedtools merge –i composite.DRIP.sorted > composite.DRIP.sorted.merged). The significance of the association or p value was calculated using the fisher exact test (fisher) in BEDtools (https://bedtools.readthedocs.io/en/latest/content/tools/fisher.html). Calculation of DSB coverage over RLFS and annotation of genes associated with DSBs were performed with the binOverFeature and annotatePeakInBatch functions from the ChIPpeakAnno R package, respectively (Zhu et al., 2010).
Calculation of replication timing for DSB regions
Replication timing data were derived from Repli-seq data of lymphoblastoid GM06990 cells (accession: ENCSR595CLF) publicly available from ENCODE (https://www.encodeproject.org/replication-timing-series/ENCSR595CLF/). An S50 (0 < S50 < 1) value, defined as the fraction of the S phase at which 50% of the DNA is replicated (50% of the cumulative enrichment), was computed for any 50-kb segment of the genome (Hansen et al., 2010). The cumulative enrichment was calculated for each sliding window of 50 kb at a 1-kb step size by linear interpolation of enrichment values in 6 evenly divided temporal windows of the S phase, as previously described (Chen et al., 2010). If a given 50-kb segment was not significantly enriched in any window in the S phase, no S50 value was attributed (S50 = NA). Approximately 5% of the genome fell in this category. The DSB regions were then assigned the same S50 values as that of the 50-kb segment in which they reside. For FX cells DSBs on the Y chromosome were excluded from further analysis due to the lack of replication timing data in the reference genome of GM06990. Finally, the DSBs with assigned replication timing values were further parsed into early (S50 < 0.5) and late (S50 > 0.5) replicating domains. The resulting distribution of DSBs in the early and late replicating domains was subjected to a Genomic Association Test (GAT) to determine if the DSBs were enriched in either of the two domains through 1000 randomized simulation (Heger et al., 2013).
Genomic association tests for correlation between DSBs and CFS cores and the “APH.breakome.”
The DSB regions with assigned replication timing indices (early versus late, see above) were compared to previously published finely mapped CFS core sequences (Le Tallec et al., 2013; Savelyeva and Brueckner, 2014) and the “APH.breakome” (Crosetto et al., 2013), using the Genomic Association Tester (GAT) software (Heger et al., 2013). In all tests the DSBs were set as segments and the other datasets as annotation, with the genomic regions previously assigned with S50 values as workspace (i.e., excluding those regions with S50 value of “NA”) and default parameter for sampling rounds (−num-samples = 1000).
Statistical analysis
Two-way ANOVA test followed by Tukey’s multiple testing for all pairwise comparisons was performed for all experiments unless otherwise noted. Annotation for P values in figure legends regardless of statistical test type are: *, p < 0.05; **, p < 0.01; ***, p < 0.001; ****, p < 0.0001. Error bars denote standard deviation unless otherwise noted.
Supplementary Material
KEY RESOURCES TABLE
| REAGENT or RESOURCESOURCE | SOURCE | IDENTIFIER |
|---|---|---|
| Antibodies | ||
| Rabbit anti-γH2A.X (Ser139) conjugated to phycoerythrin | Cell Signaling Technology | Cat#5763S; RRID: AB_10706778 |
| Rabbit anti-γH2A.X(Ser139) | Cell Signaling Technology | Cat#9718S; RRID: AB_2118009 |
| Mouse S9.6 antibody | Kerafast | Cat#ENH001; RRID:AB_2687463 |
| Chicken anti-Lamin A+C | Novus Biologicals | Cat#NBP2–25152; RRID: N/A |
| anti-nucleolin | Abcam | Cat#ab22758; RRID: AB_776878 |
| Mouse anti-ATR | Santa Cruz Biotechnology | Cat#sc-516173; RRID: N/A |
| Rabbit anti-ATM | Abcam | Cat#ab32420; RRID: AB_725574 |
| Mouse anti-Chk1 | Santa Cruz Biotechnology | Cat#sc-8408; RRID: AB_627257 |
| Mouse anti-RPA2 | Abcam | Cat#ab2175; RRID: AB_302873 |
| Mouse anti-H2A.X | Santa Cruz Biotechnology | Cat#sc-517336; RRID: N/A |
| Rabbit anti-phospho-ATR (Ser428) | Cell Signaling Technology | Cat#2853S; RRID: AB_2290281 |
| Rabbit anti-phospho-ATM (Ser1981) | Abcam | Cat#ab81292; RRID: AB_1640207 |
| Rabbit anti-phospho-Chk1 (Ser345) | Thermo Fisher Scientific | Cat#MA5–15145; RRID: AB_10979221 |
| Rabbit anti-phospho-RPA2 (Thr21) | Abcam | Cat#ab109394; RRID: AB_10860648 |
| Mouse anti-GAPDH | Santa Cruz Biotechnology | Cat#sc-47724; RRID: AB_627678 |
| Mouse anti-FMRP | Biolegend | Cat#834601; RRID: AB_2564992 |
| Mouse anti-FLAG-M2-Peroxidase (HRP) | Sigma-Aldrich | Cat#A8592-.2MG; RRID: AB_439702 |
| Mouse anti-actin | MP Biomedical | Cat#691001; RRID: N/A |
| Donkey anti-Rabbit Secondary Antibody, Alexa fluor 488 | Invitrogen | Cat#A-21206; RRID:AB_2535792 |
| Donkey anti-Mouse Secondary Antibody, Alexa Fluor 568 | Invitrogen | Cat#A10037; RRID:AB_2534013 |
| Goat anti-Chicken Secondary Antibody, Alexa Fluor 647 | Invitrogen | Cat#A-21449; RRID:AB_2535866 |
| Goat anti-Rabbit Secondary Antibody, Alexa Fluor 647 | Invitrogen | Cat#A-21244; RRID:AB_2535812 |
| Bacterial and Virus Strains | ||
| Turbo competent E. coli cells | NEB | Cat#C2984H |
| Chemicals, Peptides, and Recombinant Proteins | ||
| TransIT-2020 transfection reagent | Mirus Bio | Cat#MIR 6003 |
| poly-D-lysine | Sigma Aldrich | Cat#P6407 |
| RNase H | NEB | Cat#M0297L |
| β-Agarase I | NEB | Cat#M0392L |
| Aphidicolin | AG Scientific | Cat#A-1026-1 mg |
| Propidium Iodide | Acros Organics | Cat#AC440300250 |
| Prolong Diamond antifade mountant plus DAPI | Invitrogen | Cat#P36962 |
| Halt protease and phosphatase inhibitor | Thermo Scientific | Cat#1861280 |
| Biotin-14-dTAP | Invitrogen | Cat#19524016 |
| Dynabeads M-270 Streptavidin | Invitrogen | Cat#65305 |
| DMEM | GIBCO | Cat#11965-092 |
| RPMI1640 | Corning | Cat#15-040-CV |
| MEM | GIBCO | Cat#10370-021 |
| BenchMark FBS heat inactivated | Gemini Bioproducts | Cat#100-106 |
| FBS | Corning | Cat#350-010-CV |
| HEPES buffer | Corning | Cat#25-060-CI |
| Sodium pyruvate | Corning | Cat#25-000-CI |
| MEM nonessential amino acids | Corning | Cat#25-025-CI |
| GlutaMAX | GIBCO | Cat#35050-061 |
| Penicillin streptomycin solution | Corning | Cat#30-002-CI |
| KAPA HiFi HotStart Ready mix | Kapabiosystems/Roche | Cat#07958927001 |
| AMPure XP beads | Beckman Coulter | Cat#A63880 |
| Critical Commercial Assays | ||
| CometAssay Kit | Trevigen | Cat#4250-050-K |
| Zombie Aqua Fixable Viability Kit | Biolegend | Cat#423101 |
| End-It Kit | Epicenter/Lucigen | Cat#ER81050 |
| A-tailing Kit | NEB | Cat#E6053L |
| Deposited Data | ||
| Break-seq and DNA-seq sequencing data | This paper | GEO:GSE124403 |
| GRCh37/hg19 | UCSC human genome assembly | http://hgdownload.soe.ucsc.edu/goldenPath/hg19/bigZips/ |
| Replication timing series in GM06990 | Hansenetal., 2010 | https://www.encodeproject.org/replication-timing-series/ENCSR595CLF/ |
| APH_breakome | Crosetto et al., 2013 | http://breakome.utmb.edu/supplementary_database/Downloads.html |
| NT2 and K562 cells_DRIP-seq | Sanzet al., 2016 | GEO: GSE70189 (GSM1720615, GSM1720616,GSM1720617, GSM1720618,GSM1720619) |
| RLFS computationally predicted sequences | Wongsurawat et al., 2012 | http://rloop.bii.a-star.edu.sg/ |
| Experimental Models: Cell Lines | ||
| Human EBV transformed lymphoblastoid cell lines GM06990 (control) | Coriell Institute | GM06990; RRID:CVCL_9587 |
| Human EBV transformed lymphoblastoid cell line: GM03200 (Fragile X) | Coriell Institute | GM03200; RRID:CVCL_AX76 |
| Human fibroblast cell line: GM00357 (control) | Coriell Institute | GM00357; RRID:CVCL_6B36 |
| Human fibroblast cell line: GM05848 (Fragile X) | Coriell Institute | GM05848; RRID:CVCL_AX83 |
| Phoenix-AMPHO producer cells (ATCC) | ATCC | ATCC® CRL-3213; RRID:CVCL_H716 |
| Experimental Models: Organisms/Strains | ||
| S. cerevisiae: BY4741 (MATa his3Δ1 leu2Δ0 met15Δ ura3Δ0) | Charlie Boone lab | N/A |
| S. cerevisiae: rnh1Δ (MATa rnh1Δ::KAN leu2Δ0 his3Δ 1met15Δ0 ura3Δ0) | Charlie Boone lab | N/A |
| Oligonucleotides | ||
| See Table S6 for the list of Oligonucleotides. | N/A | |
| Recombinant DNA | ||
| pcDNA3-EGFP | Addgene | Cat#13031, RRID:Addgene_13031 |
| pMSCVpuro | Addgene | Cat#K1062–1, RRID: N/A |
| pFRT-TODestFLAGHAhFMRPiso1 | Addgene | Cat#48690, RRID:Addgene_48690 |
| pMSCVpuro-EGFP | This paper | N/A |
| pMSCVpuro-EGFP-FMRP | This paper | N/A |
| pARS-GLB-OUT | Prado and Aguilera, 2005 | N/A |
| pARS-GLB-IN | Prado and Aguilera, 2005 | N/A |
| pARS-GLB-OUT-Control-1 | This paper | N/A |
| pARS-GLB-OUT-Control-2 | This paper | N/A |
| pARS-GLB-IN-Control-1 | This paper | N/A |
| pARS-GLB-IN-Control-2 | This paper | N/A |
| pARS-GLB-OUT-RLFS1 | This paper | N/A |
| pARS-GLB-OUT-RLFS2 | This paper | N/A |
| pARS-GLB-IN-RLFS1 | This paper | N/A |
| pARS-GLB-IN-RLFS2 | This paper | N/A |
| pFRT-TODestFLAGHAhFMRPiso1I304N | Addgene | Cat#48692, RRID:Addgene_48692 |
| pRS313 | ATCC | Cat#ATCC® 77142 |
| pRS316 | ATCC | Ca#tUATCC® 77145 |
| pRS313-CMV-FMRPiso1 | This paper | N/A |
| pRS313-CMV-FMRPiso1I304N | This paper | N/A |
| pRS313-CMV-RNH1 | This paper | N/A |
| pRS313-CMV-SHE2 | This paper | N/A |
| Software and Algorithms | ||
| DAVID Bioinformatics tools | Huang et al., 2009 | https://david.ncifcrf.gov/ |
| Bowtie 2 | Langmead and Salzberg, 2012 | http://bowtie-bio.sourceforge.net/bowtie2/index.shtml |
| Picard MarkDuplicates | Broad Institute/ Github | http://broadinstitute.github.io/picard |
| Samtools | Li et al., 2009 | http://samtools.sourceforge.net/ |
| BEDtools | Quinlan and Hall, 2010 | https://bedtools.readthedocs.io/en/latest/ |
| Preseq | Daley and Smith, 2013 | https://github.com/smithlabcode/preseq |
| DiffBind | Ross-Innes et al., 2012 | https://bioconductor.org/packages/release/bioc/html/DiffBind.html |
| ChIPpeakAnno R package (binOverFeature and annotatePeakInBatch functions) | Zhuetal., 2010 | https://www.rdocumentation.org/packages/ChIPpeakAnno/versions/ure and https://www.rdocumentation.org/packages/ChIPpeakAnno/versions/3.6.5/topics/annotatePeakInBatch |
| Model-based Analysis for ChIP-seq (MACS version 2.1.1) | Zhang et al., 2008 | https://pypi.org/project/MACS2/ |
| Genomic Association Test | Heger et al., 2013 | https://github.com/AndreasHeger/gat |
| WebGestalt | Wang etal., 2017 | http://webgestalt.org |
| Fiji | Schindelin et al., 2012 | https://fiji.sc/ |
| Graphpad Prism | https://www.graphpad.com/scientific-software/prism/ | |
| OpenComet v1.3.1 | Gyoriet al., 2014 | https://www.cometbio.org |
| Kaleidagraph | Hoover, 2000 | https://www.synergy.com |
| Flowjo | Ashland, OR: Becton, Dickinson and Company | https://www.flowjo.com |
| SeqMonkv1.43.0 | Babraham Bioinformatics | https://www.bioinformatics.babraham.ac.uk/ |
Highlights.
Fragile X cells have increased DNA damage with or without DNA replication stress
Break-seq identifies genome-wide DNA double-strand breaks in fragile X cells
Fragile X cells have elevated R-loop formation under DNA replication stress
FMRP, but not a disease-causing FMRP-I304N mutant, reduces R-loop-induced DSBs
ACKNOWLEDGMENTS
We thank V. Van Steenkist for systems support; Drs. L. Kotula, C. Dobkin, B. Howell, and A. Aguilera for antibodies and plasmids; and Drs. L. Kotula, F. Middleton, P. Kane, and T. Wongsurawat for helpful discussions. We also thank the staff at SUNY Upstate Flow Cytometry Core and the University at Buffalo Genomics Core for flow sorting and HiSeq sequencing, respectively. This work was supported by the National Institutes of Health grants 5R00GM08137805 and 5R01-GM118799 to W.F.; the Department of Defense CDMRP Discovery Award W81XWH-15-1-0204 to W.F.; institutional support from A*STAR and a SUNY EMPIRE scholar grant to V.A.K.; the Department of Defense grant PC160083 to H.H.; the I. Curie YPI program, the ATIP-Avenir program from CNRS and Plan Cancer from INSERM, and the Agence Nationale pour la Recherche (ANR) to C.L.C.; and the National Institutes of Health grant 5R01-GM045751 to C.S.
Footnotes
SUPPLEMENTAL INFORMATION
Supplemental Information can be found online at https://doi.org/10.1016/j.celrep.2020.108179.
DECLARATION OF INTERESTS
The authors declare no competing interests.
REFERENCES
- Alpatov R, Lesch BJ, Nakamoto-Kinoshita M, Blanco A, Chen S, Stützer A, Armache KJ, Simon MD, Xu C, Ali M, et al. (2014). A chromatin-dependent role of the fragile X mental retardation protein FMRP in the DNA damage response. Cell 157, 869–881. [DOI] [PMC free article] [PubMed] [Google Scholar]
- Ashley CT Jr., Wilkinson KD, Reines D, and Warren ST (1993). FMR1 protein: conserved RNP family domains and selective RNA binding. Science 262, 563–566. [DOI] [PubMed] [Google Scholar]
- Barlow JH, Faryabi RB, Callén E, Wong N, Malhowski A, Chen HT, Gutierrez-Cruz G, Sun HW, McKinnon P, Wright G, et al. (2013). Identification of early replicating fragile sites that contribute to genome instability. Cell 152, 620–632. [DOI] [PMC free article] [PubMed] [Google Scholar]
- Bear MF, Huber KM, and Warren ST (2004). The mGluR theory of fragile X mental retardation. Trends Neurosci. 27, 370–377. [DOI] [PubMed] [Google Scholar]
- Boldrini M, Fulmore CA, Tartt AN, Simeon LR, Pavlova I, Poposka V, Rosoklija GB, Stankov A, Arango V, Dwork AJ, et al. (2018). Human Hippocampal Neurogenesis Persists throughout Aging. Cell Stem Cell 22, 589–599.e5. [DOI] [PMC free article] [PubMed] [Google Scholar]
- Brison O, El-Hilali S, Azar D, Koundrioukoff S, Schmidt M, Nähse V, Jaszczyszyn Y, Lachages AM, Dutrillaux B, Thermes C, et al. (2019). Transcription-mediated organization of the replication initiation program across large genes sets common fragile sites genome-wide. Nat. Commun 10, 5693. [DOI] [PMC free article] [PubMed] [Google Scholar]
- Brown V, Jin P, Ceman S, Darnell JC, O’Donnell WT, Tenenbaum SA, Jin X, Feng Y, Wilkinson KD, Keene JD, et al. (2001). Microarray identification of FMRP-associated brain mRNAs and altered mRNA translational profiles in fragile X syndrome. Cell 107, 477–487. [DOI] [PubMed] [Google Scholar]
- Chappidi N, Nascakova Z, Boleslavska B, Zellweger R, Isik E, Andrs M, Menon S, Dobrovolna J, Balbo Pogliano C, Matos J, et al. (2020). Fork Cleavage-Religation Cycle and Active Transcription Mediate Replication Restart after Fork Stalling at Co-transcriptional R-Loops. Mol. Cell 77, 528–541.e8. [DOI] [PubMed] [Google Scholar]
- Chen CL, Rappailles A, Duquenne L, Huvet M, Guilbaud G, Farinelli L, Audit B, d’Aubenton-Carafa Y, Arneodo A, Hyrien O, and Thermes C (2010). Impact of replication timing on non-CpG and CpG substitution rates in mammalian genomes. Genome Res. 20, 447–457. [DOI] [PMC free article] [PubMed] [Google Scholar]
- Ciaccio C, Fontana L, Milani D, Tabano S, Miozzo M, and Esposito S (2017). Fragile X syndrome: a review of clinical and molecular diagnoses. Ital. J. Pediatr 43, 39. [DOI] [PMC free article] [PubMed] [Google Scholar]
- Coffee B, Zhang F, Ceman S, Warren ST, and Reines D (2002). Histone modifications depict an aberrantly heterochromatinized FMR1 gene in fragile x syndrome. Am. J. Hum. Genet 71, 923–932. [DOI] [PMC free article] [PubMed] [Google Scholar]
- Crosetto N, Mitra A, Silva MJ, Bienko M, Dojer N, Wang Q, Karaca E, Chiarle R, Skrzypczak M, Ginalski K, et al. (2013). Nucleotide-resolution DNA double-strand break mapping by next-generation sequencing. Nat. Methods 10, 361–365. [DOI] [PMC free article] [PubMed] [Google Scholar]
- Curtis MA, Low VF, and Faull RL (2012). Neurogenesis and progenitor cells in the adult human brain: a comparison between hippocampal and subventricular progenitor proliferation. Dev. Neurobiol 72, 990–1005. [DOI] [PubMed] [Google Scholar]
- Daley T, and Smith AD (2013). Predicting the molecular complexity of sequencing libraries. Nat. Methods 10, 325–327. [DOI] [PMC free article] [PubMed] [Google Scholar]
- Darnell JC, Van Driesche SJ, Zhang C, Hung KY, Mele A, Fraser CE, Stone EF, Chen C, Fak JJ, Chi SW, et al. (2011). FMRP stalls ribosomal translocation on mRNAs linked to synaptic function and autism. Cell 146, 247–261. [DOI] [PMC free article] [PubMed] [Google Scholar]
- De Boulle K, Verkerk AJ, Reyniers E, Vits L, Hendrickx J, Van Roy B, Van den Bos F, de Graaff E, Oostra BA, and Willems PJ (1993). A point mutation in the FMR-1 gene associated with fragile X mental retardation. Nat. Genet 3, 31–35. [DOI] [PubMed] [Google Scholar]
- Domínguez-Sánchez MS, Barroso S, Gómez-González B, Luna R, and Aguilera A (2011). Genome instability and transcription elongation impairment in human cells depleted of THO/TREX. PLOS Genet. 7, e1002386. [DOI] [PMC free article] [PubMed] [Google Scholar]
- Entian KD, Schuster T, Hegemann JH, Becher D, Feldmann H, Güldener U, Götz R, Hansen M, Hollenberg CP, Jansen G, et al. (1999). Functional analysis of 150 deletion mutants in Saccharomyces cerevisiae by a systematic approach. Mol. Gen. Genet 262, 683–702. [DOI] [PubMed] [Google Scholar]
- Erickson CA, Davenport MH, Schaefer TL, Wink LK, Pedapati EV, Sweeney JA, Fitzpatrick SE, Brown WT, Budimirovic D, Hagerman RJ, et al. (2017). Fragile X targeted pharmacotherapy: lessons learned and future directions. J. Neurodev. Disord 9, 7. [DOI] [PMC free article] [PubMed] [Google Scholar]
- Eriksson PS, Perfilieva E, Björk-Eriksson T, Alborn AM, Nordborg C, Peterson DA, and Gage FH (1998). Neurogenesis in the adult human hippocampus. Nat. Med 4, 1313–1317. [DOI] [PubMed] [Google Scholar]
- Favorov A, Mularoni L, Cope LM, Medvedeva Y, Mironov AA, Makeev VJ, and Wheelan SJ (2012). Exploring massive, genome scale datasets with the GenometriCorr package. PLOS Comput. Biol 8, e1002529. [DOI] [PMC free article] [PubMed] [Google Scholar]
- Feng Y, Absher D, Eberhart DE, Brown V, Malter HE, and Warren ST (1997). FMRP associates with polyribosomes as an mRNP, and the I304N mutation of severe fragile X syndrome abolishes this association. Mol. Cell 1, 109–118. [DOI] [PubMed] [Google Scholar]
- Fu YH, Kuhl DP, Pizzuti A, Pieretti M, Sutcliffe JS, Richards S, Verkerk AJ, Holden JJ, Fenwick RG Jr., Warren ST, et al. (1991). Variation of the CGG repeat at the fragile X site results in genetic instability: resolution of the Sherman paradox. Cell 67, 1047–1058. [DOI] [PubMed] [Google Scholar]
- García-Rubio M, Aguilera P, Lafuente-Barquero J, Ruiz JF, Simon MN, Geli V, Rondón AG, and Aguilera A (2018). Yra1-bound RNA-DNA hybrids cause orientation-independent transcription-replication collisions and telomere instability. Genes Dev. 32, 965–977. [DOI] [PMC free article] [PubMed] [Google Scholar]
- Gerhardt J, Tomishima MJ, Zaninovic N, Colak D, Yan Z, Zhan Q, Rosenwaks Z, Jaffrey SR, and Schildkraut CL (2014). The DNA replication program is altered at the FMR1 locus in fragile X embryonic stem cells. Mol. Cell 53, 19–31. [DOI] [PMC free article] [PubMed] [Google Scholar]
- Glover TW, Berger C, Coyle J, and Echo B (1984). DNA polymerase alpha inhibition by aphidicolin induces gaps and breaks at common fragile sites in human chromosomes. Hum. Genet 67, 136–142. [DOI] [PubMed] [Google Scholar]
- Gyori BM, Venkatachalam G, Thiagarajan PS, Hsu D, and Clement MV (2014). OpenComet: an automated tool for comet assay image analysis. Redox Biol. 2, 457–465. [DOI] [PMC free article] [PubMed] [Google Scholar]
- Hamperl S, Bocek MJ, Saldivar JC, Swigut T, and Cimprich KA (2017). Transcription-Replication Conflict Orientation Modulates R-Loop Levels and Activates Distinct DNA Damage Responses. Cell 170, 774–786.e19. [DOI] [PMC free article] [PubMed] [Google Scholar]
- Hansen RS, Thomas S, Sandstrom R, Canfield TK, Thurman RE, Weaver M, Dorschner MO, Gartler SM, and Stamatoyannopoulos JA (2010). Sequencing newly replicated DNA reveals widespread plasticity in human replication timing. Proc. Natl. Acad. Sci. USA 107, 139–144. [DOI] [PMC free article] [PubMed] [Google Scholar]
- Heger A, Webber C, Goodson M, Ponting CP, and Lunter G (2013). GAT: a simulation framework for testing the association of genomic intervals. Bioinformatics 29, 2046–2048. [DOI] [PMC free article] [PubMed] [Google Scholar]
- Hein MY, Hubner NC, Poser I, Cox J, Nagaraj N, Toyoda Y, Gak IA, Weisswange I, Mansfeld J, Buchholz F, et al. (2015). A human interactome in three quantitative dimensions organized by stoichiometries and abundances. Cell 163, 712–723. [DOI] [PubMed] [Google Scholar]
- Hellman A, Rahat A, Scherer SW, Darvasi A, Tsui LC, and Kerem B (2000). Replication delay along FRA7H, a common fragile site on human chromosome 7, leads to chromosomal instability. Mol. Cell. Biol 20, 4420–4427. [DOI] [PMC free article] [PubMed] [Google Scholar]
- Hoffman EA, McCulley A, Haarer B, Arnak R, and Feng W (2015). Break-seq reveals hydroxyurea-induced chromosome fragility as a result of unscheduled conflict between DNA replication and transcription. Genome Res. 25, 402–412. [DOI] [PMC free article] [PubMed] [Google Scholar]
- Hoover F (2000). KaleidaGraph 3.5. Science 289, 1893. [Google Scholar]
- Huang W, Sherman BT, and Lempicki RA (2009). Systematic and integrative analysis of large gene lists using DAVID bioinformatics resources. Nat. Protoc 4, 44–57. [DOI] [PubMed] [Google Scholar]
- Jacobs S, Cheng C, and Doering LC (2016). Hippocampal neuronal sub-types develop abnormal dendritic arbors in the presence of Fragile X astrocytes. Neuroscience 324, 202–217. [DOI] [PubMed] [Google Scholar]
- Kang MH, Das J, Gurunathan S, Park HW, Song H, Park C, and Kim JH (2017). The cytotoxic effects of dimethyl sulfoxide in mouse preimplantation embryos: a mechanistic study. Theranostics 7, 4735–4752. [DOI] [PMC free article] [PubMed] [Google Scholar]
- Kempermann G, Song H, and Gage FH (2015). Neurogenesis in the Adult Hippocampus. Cold Spring Harb. Perspect. Biol 7, a018812. [DOI] [PMC free article] [PubMed] [Google Scholar]
- Khandjian EW, Huot ME, Tremblay S, Davidovic L, Mazroui R, and Bardoni B (2004). Biochemical evidence for the association of fragile X mental retardation protein with brain polyribosomal ribonucleoparticles. Proc. Natl. Acad. Sci. USA 101, 13357–13362. [DOI] [PMC free article] [PubMed] [Google Scholar]
- Kim M, Bellini M, and Ceman S (2009). Fragile X mental retardation protein FMRP binds mRNAs in the nucleus. Mol. Cell. Biol 29, 214–228. [DOI] [PMC free article] [PubMed] [Google Scholar]
- Kollipara L, Buchkremer S, Coraspe JAG, Hathazi D, Senderek J, Weis J, Zahedi RP, and Roos A (2017). In-depth phenotyping of lymphoblastoid cells suggests selective cellular vulnerability in Marinesco-Sjögren syndrome. Oncotarget 8, 68493–68516. [DOI] [PMC free article] [PubMed] [Google Scholar]
- Końca K, Lankoff A, Banasik A, Lisowska H, Kuszewski T, Góźdź S, Koza Z, and Wojcik A (2003). A cross-platform public domain PC image-analysis program for the comet assay. Mutat. Res 534, 15–20. [DOI] [PubMed] [Google Scholar]
- Kononenko AV, Ebersole T, Vasquez KM, and Mirkin SM (2018). Mechanisms of genetic instability caused by (CGG)n repeats in an experimental mammalian system. Nat. Struct. Mol. Biol 25, 669–676. [DOI] [PMC free article] [PubMed] [Google Scholar]
- Korb E, Herre M, Zucker-Scharff I, Gresack J, Allis CD, and Darnell RB (2017). Excess Translation of Epigenetic Regulators Contributes to Fragile X Syndrome and Is Alleviated by Brd4 Inhibition. Cell 170, 1209–1223.e20. [DOI] [PMC free article] [PubMed] [Google Scholar]
- Krawczun MS, Jenkins EC, and Brown WT (1985). Analysis of the fragile-X chromosome: localization and detection of the fragile site in high resolution preparations. Hum. Genet 69, 209–211. [DOI] [PubMed] [Google Scholar]
- Kuwano A, and Kajii T (1987). Synergistic effect of aphidicolin and ethanol on the induction of common fragile sites. Hum. Genet 75, 75–78. [DOI] [PubMed] [Google Scholar]
- Langmead B, and Salzberg SL (2012). Fast gapped-read alignment with Bowtie 2. Nat. Methods 9, 357–359. [DOI] [PMC free article] [PubMed] [Google Scholar]
- Le Beau MM, Rassool FV, Neilly ME, Espinosa R 3rd, Glover TW, Smith DI, and McKeithan TW (1998). Replication of a common fragile site, FRA3B, occurs late in S phase and is delayed further upon induction: implications for the mechanism of fragile site induction. Hum. Mol. Genet 7, 755–761. [DOI] [PubMed] [Google Scholar]
- Le Tallec B, Millot GA, Blin ME, Brison O, Dutrillaux B, and Debatisse M (2013). Common fragile site profiling in epithelial and erythroid cells reveals that most recurrent cancer deletions lie in fragile sites hosting large genes. Cell Rep. 4, 420–428. [DOI] [PubMed] [Google Scholar]
- Li H, Handsaker B, Wysoker A, Fennell T, Ruan J, Homer N, Marth G, Abecasis G, and Durbin R; 1000 Genome Project Data Processing Subgroup (2009). The sequence alignment/map (SAM) format and SAMtools. Bioinformatics 25, 2078–2079. [DOI] [PMC free article] [PubMed] [Google Scholar]
- Li Y, Stockton ME, Eisinger BE, Zhao Y, Miller JL, Bhuiyan I, Gao Y, Wu Z, Peng J, and Zhao X (2018). Reducing histone acetylation rescues cognitive deficits in a mouse model of Fragile X syndrome. Nat. Commun 9, 2494. [DOI] [PMC free article] [PubMed] [Google Scholar]
- Liu SX, Athar M, Lippai I, Waldren C, and Hei TK (2001). Induction of oxyradicals by arsenic: implication for mechanism of genotoxicity. Proc. Natl. Acad. Sci. USA 98, 1643–1648. [DOI] [PMC free article] [PubMed] [Google Scholar]
- Liu W, Jiang F, Bi X, and Zhang YQ (2012). Drosophila FMRP participates in the DNA damage response by regulating G2/M cell cycle checkpoint and apoptosis. Hum. Mol. Genet 21, 4655–4668. [DOI] [PubMed] [Google Scholar]
- Matos DA, Zhang JM, Ouyang J, Nguyen HD, Genois MM, and Zou L (2020). ATR Protects the Genome against R Loops through a MUS81-Triggered Feedback Loop. Mol. Cell 77, 514–527.e4. [DOI] [PMC free article] [PubMed] [Google Scholar]
- Murano I, Kuwano A, and Kajii T (1989). Fibroblast-specific common fragile sites induced by aphidicolin. Hum. Genet 83, 45–48. [DOI] [PubMed] [Google Scholar]
- Naim V, Wilhelm T, Debatisse M, and Rosselli F (2013). ERCC1 and MUS81-EME1 promote sister chromatid separation by processing late replication intermediates at common fragile sites during mitosis. Nat. Cell Biol 15, 1008–1015. [DOI] [PubMed] [Google Scholar]
- Nakamoto M, Nalavadi V, Epstein MP, Narayanan U, Bassell GJ, and Warren ST (2007). Fragile X mental retardation protein deficiency leads to excessive mGluR5-dependent internalization of AMPA receptors. Proc. Natl. Acad. Sci. USA 104, 15537–15542. [DOI] [PMC free article] [PubMed] [Google Scholar]
- Niere F, Wilkerson JR, and Huber KM (2012). Evidence for a fragile X mental retardation protein-mediated translational switch in metabotropic glutamate receptor-triggered Arc translation and long-term depression. J. Neurosci 32, 5924–5936. [DOI] [PMC free article] [PubMed] [Google Scholar]
- Nishimura Y, Martin CL, Vazquez-Lopez A, Spence SJ, Alvarez-Retuerto AI, Sigman M, Steindler C, Pellegrini S, Schanen NC, Warren ST, and Geschwind DH (2007). Genome-wide expression profiling of lymphoblastoid cell lines distinguishes different forms of autism and reveals shared pathways. Hum. Mol. Genet 16, 1682–1698. [DOI] [PubMed] [Google Scholar]
- Nott A, and Tsai LH (2013). The Top3b way to untangle RNA. Nat. Neurosci 16, 1163–1164. [DOI] [PubMed] [Google Scholar]
- Palakodeti A, Han Y, Jiang Y, and Le Beau MM (2004). The role of late/slow replication of the FRA16D in common fragile site induction. Genes Chromosomes Cancer 39, 71–76. [DOI] [PubMed] [Google Scholar]
- Pansarasa O, Bordoni M, Drufuca L, Diamanti L, Sproviero D, Trotti R, Bernuzzi S, La Salvia S, Gagliardi S, Ceroni M, and Cereda C (2018). Lymphoblastoid cell lines as a model to understand amyotrophic lateral sclerosis disease mechanisms. Dis. Model. Mech 11, dmm031625. [DOI] [PMC free article] [PubMed] [Google Scholar]
- Pérez-Pastén R, Martínez-Galero E, Garduño-Siciliano L, Lara IC, and Cevallos GC (2006). Effects of dimethylsulphoxide on mice arsenite-induced dysmorphogenesis in embryo culture and cytotoxicity in embryo cells. Toxicol. Lett 161, 167–173. [DOI] [PubMed] [Google Scholar]
- Pieretti M, Zhang FP, Fu YH, Warren ST, Oostra BA, Caskey CT, and Nelson DL (1991). Absence of expression of the FMR-1 gene in fragile X syndrome. Cell 66, 817–822. [DOI] [PubMed] [Google Scholar]
- Prado F, and Aguilera A (2005). Impairment of replication fork progression mediates RNA polII transcription-associated recombination. EMBO J. 24, 1267–1276. [DOI] [PMC free article] [PubMed] [Google Scholar]
- Quinlan AR, and Hall IM (2010). BEDTools: a flexible suite of utilities for comparing genomic features. Bioinformatics 26, 841–842. [DOI] [PMC free article] [PubMed] [Google Scholar]
- Ross-Innes CS, Stark R, Teschendorff AE, Holmes KA, Ali HR, Dunning MJ, Brown GD, Gojis O, Ellis IO, Green AR, et al. (2012). Differential oestrogen receptor binding is associated with clinical outcome in breast cancer. Nature 481, 389–393. [DOI] [PMC free article] [PubMed] [Google Scholar]
- Sadowska-Bartosz I, Pączka A, Mołoń M, and Bartosz G (2013). Dimethyl sulfoxide induces oxidative stress in the yeast Saccharomyces cerevisiae. FEMS Yeast Res. 13, 820–830. [DOI] [PubMed] [Google Scholar]
- Santoro MR, Bray SM, and Warren ST (2012). Molecular mechanisms of fragile X syndrome: a twenty-year perspective. Annu. Rev. Pathol 7, 219–245. [DOI] [PubMed] [Google Scholar]
- Sanz LA, Hartono SR, Lim YW, Steyaert S, Rajpurkar A, Ginno PA, Xu X, and Chédin F (2016). Prevalent, Dynamic, and Conserved R-Loop Structures Associate with Specific Epigenomic Signatures in Mammals. Mol. Cell 63, 167–178. [DOI] [PMC free article] [PubMed] [Google Scholar]
- Savelyeva L, and Brueckner LM (2014). Molecular characterization of common fragile sites as a strategy to discover cancer susceptibility genes. Cell. Mol. Life Sci 71, 4561–4575. [DOI] [PMC free article] [PubMed] [Google Scholar]
- Schindelin J, Arganda-Carreras I, Frise E, Kaynig V, Longair M, Pietzsch T, Preibisch S, Rueden C, Saalfeld S, Schmid B, et al. (2012). Fiji: an open-source platform for biological-image analysis. Nat. Methods 9, 676–682. [DOI] [PMC free article] [PubMed] [Google Scholar]
- Sethna F, Moon C, and Wang H (2014). From FMRP function to potential therapies for fragile X syndrome. Neurochem. Res 39, 1016–1031. [DOI] [PMC free article] [PubMed] [Google Scholar]
- Siomi H, Choi M, Siomi MC, Nussbaum RL, and Dreyfuss G (1994). Essential role for KH domains in RNA binding: impaired RNA binding by a mutation in the KH domain of FMR1 that causes fragile X syndrome. Cell 77, 33–39. [DOI] [PubMed] [Google Scholar]
- Verkerk AJ, Pieretti M, Sutcliffe JS, Fu YH, Kuhl DP, Pizzuti A, Reiner O, Richards S, Victoria MF, Zhang FP, et al. (1991). Identification of a gene (FMR-1) containing a CGG repeat coincident with a breakpoint cluster region exhibiting length variation in fragile X syndrome. Cell 65, 905–914. [DOI] [PubMed] [Google Scholar]
- Voineagu I, Surka CF, Shishkin AA, Krasilnikova MM, and Mirkin SM (2009). Replisome stalling and stabilization at CGG repeats, which are responsible for chromosomal fragility. Nat. Struct. Mol. Biol 16, 226–228. [DOI] [PMC free article] [PubMed] [Google Scholar]
- Wang L, Darling J, Zhang JS, Huang H, Liu W, and Smith DI (1999). Allele-specific late replication and fragility of the most active common fragile site, FRA3B. Hum. Mol. Genet 8, 431–437. [DOI] [PubMed] [Google Scholar]
- Wang J, Vasaikar S, Shi Z, Greer M, and Zhang B (2017). WebGestalt 2017: a more comprehensive, powerful, flexible and interactive gene set enrichment analysis toolkit. Nucleic Acids Res. 45 (W1), W130–W137. [DOI] [PMC free article] [PubMed] [Google Scholar]
- Wongsurawat T, Jenjaroenpun P, Kwoh CK, and Kuznetsov V (2012). Quantitative model of R-loop forming structures reveals a novel level of RNA-DNA interactome complexity. Nucleic Acids Res. 40, e16. [DOI] [PMC free article] [PubMed] [Google Scholar]
- Xu H, Rosales-Reynoso MA, Barros-Núñez P, and Peprah E (2013). DNA repair/replication transcripts are down regulated in patients with fragile X syndrome. BMC Res. Notes 6, 90. [DOI] [PMC free article] [PubMed] [Google Scholar]
- Ying S, Minocherhomji S, Chan KL, Palmai-Pallag T, Chu WK, Wass T, Mankouri HW, Liu Y, and Hickson ID (2013). MUS81 promotes common fragile site expression. Nat. Cell Biol 15, 1001–1007. [DOI] [PubMed] [Google Scholar]
- Yu S, and Lemos B (2016). A Portrait of Ribosomal DNA Contacts with Hi-C Reveals 5S and 45S rDNA Anchoring Points in the Folded Human Genome. Genome Biol. Evol 8, 3545–3558. [DOI] [PMC free article] [PubMed] [Google Scholar]
- Zhang Y, Liu T, Meyer CA, Eeckhoute J, Johnson DS, Bernstein BE, Nusbaum C, Myers RM, Brown M, Li W, and Liu XS (2008). Model-based analysis of ChIP-Seq (MACS). Genome Biol. 9, R137. [DOI] [PMC free article] [PubMed] [Google Scholar]
- Zhang W, Cheng Y, Li Y, Chen Z, Jin P, and Chen D (2014). A feed-forward mechanism involving Drosophila fragile X mental retardation protein triggers a replication stress-induced DNA damage response. Hum. Mol. Genet 23, 5188–5196. [DOI] [PMC free article] [PubMed] [Google Scholar]
- Zhu LJ, Gazin C, Lawson ND, Pagès H, Lin SM, Lapointe DS, and Green MR (2010). ChIPpeakAnno: a Bioconductor package to annotate ChIP-seq and ChIP-chip data. BMC Bioinformatics 11, 237. [DOI] [PMC free article] [PubMed] [Google Scholar]
- Zimonjic DB, Druck T, Ohta M, Kastury K, Croce CM, Popescu NC, and Huebner K (1997). Positions of chromosome 3p14.2 fragile sites (FRA3B) within the FHIT gene. Cancer Res. 57, 1166–1170. [PubMed] [Google Scholar]
- Zorio DA, Jackson CM, Liu Y, Rubel EW, and Wang Y (2017). Cellular distribution of the fragile X mental retardation protein in the mouse brain. J. Comp. Neurol 525, 818–849. [DOI] [PMC free article] [PubMed] [Google Scholar]
Associated Data
This section collects any data citations, data availability statements, or supplementary materials included in this article.
Supplementary Materials
Data Availability Statement
All primary sequencing data and processed data described in this manuscript have been deposited in the NCBI Gene Expression Omnibus (GEO; http://www.ncbi.nlm.nih.gov/geo/) under the accession number GEO: GSE124403.