

ABSTRACT
The blood-brain barrier (BBB) plays a pivotal role in the maintenance and regulation of the neural microenvironment. The BBB breakdown is a pathological change in early Alzheimer’s disease (AD). RNA-binding proteins (RBPs) and long non-coding RNAs (lncRNAs) are involved in the regulation of BBB permeability. Our study demonstrates the role of TRA2A/LINC00662/ELK4 axis in regulating BBB permeability in AD microenvironment. In Aβ1-42-incubated microvascular endothelial cells (ECs) of the BBB model in vitro, TRA2A and LINC00662 were enriched. TRA2A increased the stability of LINC00662 by binding with it. The knockdown of either TRA2A or LINC00662 decreased BBB permeability due to increased expression of tight junction-related proteins. ELK4 was less expressed in the BBB model in AD microenvironment in vitro. LINC00662 mediated the degradation of ELK4 mRNA by SMD pathway. Downregulation of ELK4 increased BBB permeability by increasing the tight junction-related protein expression.TRA2A/LINC00662/ELK4 axis plays a crucial role in the regulation of BBB permeability in AD microenvironment, which may provide a novel target for the therapy of AD.
KEYWORDS: Blood-brain barrier, Alzheimer’s disease, TRA2A, LINC00662, ELK4, SMD pathway
1. Introduction
Alzheimer’s disease (AD) is the most common cause of dementia, which severely affects human health and quality of life [1]. At present, the pathogenesis of AD is unknown and treatment option is ineffective [2]. Increasing evidence suggests that AD is associated with extracellular Aβ accumulation in the brain due to losing balance between Aβ production and Aβ clearance [3]. BBB disruption in AD mainly reduces the clearance of Aβ, a key substance that causes AD, and promotes the entry of neurotoxic substances into the brain. It is related to inflammatory and immune responses, which can trigger multiple pathways of neurodegeneration [4]. Therefore, the treatment of BBB dysfunction may provide a new approach for AD treatment [5].
BBB is composed of cerebral microvascular endothelial cells (ECs), pericytes, extracellular matrix and podocytes of perivascular astrocytes [6]. Perivascular astrocytes and pericytes are regulators of brain endothelial characteristics and functions. At present, the establishment of in vitro BBB models is mainly based on the co-culture of the above three kinds of cells [7,8]. Transendothelial electric resistance (TEER) values, which reflects in culture conditions the flux of mainly sodium ions through cell layers, are often used as a quantitative technique to evaluate barrier function [9]. Horseradish peroxidase (HRP) is also generally used as a tracer and quantitated HRP leakage to evaluate the integrity and permeability of BBB [10]. The tight junctions between adjacent ECs play a key role in maintaining BBB integrity [11]. By analysing the expression levels and distribution of ZO-1, occludin, and claudin-5, the possible mechanisms of BBB permeability are introduced. At present, more attention is being given to the abnormal expression and distribution of tight junction proteins (TJPs) that affect the permeability of BBB in AD patients. For example, it has been reported that high granulocyte-macrophage colony-stimulating factor (GM-CSF) in the brain parenchyma and cerebrospinal fluid of AD patients reduces the expression of ZO-1 and claudin-5 and leads to the opening of blood-brain barrier [12].
RNA-binding proteins (RBPs) are a type of proteins that bind to specific RNA. RBPs can affect the transcription process from alternative splicing, polyadenylation, and nuclear export to cytoplasmic localization, stability, and translation. It has been reported that RBPs, such as Embryonic lethal abnormal vision-like protein family (ELVAL), TAR DNA-binding protein 43 (TDP43), and eukaryotic initiation factor 2 (eIF2α), play important roles during neurodegenerative diseases’ including AD development [13–15]. Transformer 2 alpha homolog (TRA2A) located in 7p15.3 significantly affects the splicing regulatory process of pre-mRNA [16]. Upregulation of TRA2A in glioma will lead to malignant biological behaviour of glioma [17]. Highly presenting of TRA2A in neurodegenerative disease indicates that TRA2A may affect other neurodegenerative diseases including AD [18]. Analysing data in the bioinformatics database AlzData, we found that TRA2A is enriched in ECs of AD patients. We speculate that TRA2A may affect AD development by changing the permeability of BBB. Also, RBPs mediated regulation of vascular function is involved with long non-coding RNAs (lncRNAs) [19].
LncRNAs are a group of non-coding RNA transcripts that contain more than 200 nucleotides and lack apparent open reading frames. It is reported that lncRNAs are of significance in biological processes on the transcriptional and post-transcriptional levels and can regulate gene transcription, pre-mRNA processing, mRNA stability, protein translation, etc. lncRNA-n341006 and lncRNA-n336934 may provide a novel approach for early diagnosis and treatments of AD [20]. LINC00662 with an Alu element located in 19q11 is related to tumorigenesis [21,22]. However, the role of RBPs and lncRNAs in regulating ECs function and its mechanisms need further study.
ETS-domain protein 4 (ELK4) (also known as SAP1) is a member of the Ets transcription factor family. As a cofactor of serum inflammatory factors, ELK4 participates in inflammatory response [23], insulin dependence regulation [24], etc. In gliomas, downregulation of ELK4 can reduce the expression of Mcl-1 and induce the sensitivity of tumour cells to apoptosis [25]. ELK4 as a transcriptional regulator is involved in the expression of neuronal plasticity regulated genes under the condition of sleep deprivation [26]. Referencing the bioinformatics database RepeatMasker, that an Alu element in the 3ʹ-UTR of ELK4 was reported. We also predicted the presence of binding sites between LINC00662 and ELK4 3ʹ-UTR with bioinformatics software IntaRNA.
STAU1-mediated mRNA decay (SMD) pathway is an mRNA degradation pathway that regulates various biological processes. SMD pathway is associated with tumorigenesis [19] and cell differentiation [27]. STAU1 has been reported to increase in the neurodegenerative disease models and involved in abnormal RNA metabolism [28]. STAU1 binding sites (SBSs) can be formed by base-pairing between an Alu element in lncRNA and another Alu element in the 3ʹUTR of the target mRNA. SMD pathway regulates target mRNAs expressions by recruiting STAU1 and UPF1 at SBSs harbours [29]. We speculated that the predicted binding sites of LINC00662 and ELK4 3ʹ-UTR may form SBSs.
This study examined endogenous expressions of TRA2A, LINC00662 and ELK4 in ECs after Aβ1-42 incubation. We analysed the interactions of those factors in AD microenvironment, where ECs were incubated with Aβ1-42 for 48 hours, and confirmed the regulatory mechanisms of BBB permeability. This study provides a new target for AD treatment with regard to BBB.
2. Materials and methods
2.1. Cell cultures
The human cerebral microvascular endothelial cell line hCMEC/D3 (ECs) were provided by Dr Couraud (Institute Cochin, Paris, France). Human brain vascular pericytes (HBVP) and normal human astrocytes (NHA) were purchased from the Sciencell Research Laboratories (Carlsbad, CA, USA). NHA and HBVP performed in the research were limited with passage below 12. ECs (passage 28–32), HBVP (passage 10–12) and NHA (passage 10–12) were cultured as described previously [30]. Human embryonic kidney 293 (HEK293 T) cells were purchased from Shanghai Institutes for Biological Sciences Cell Resource Center and the cell culture has been previously detailed [31]. All cells were maintained at 37°C, 5% CO2, in a humidified atmosphere. Aβ1-42 was manufactured by Sigma-Aldrich (St. Louis, MO, USA). Aβ1-42 was first dissolved in dry DMSO (2 mmol/L) and stored at −20°C; 2 mmol/L Aβ1-42 in DMSO was diluted into 200 μmol/L in cold Opti-MEM media and incubated at 4°C for 24 hours. Cells were pre-incubated with Aβ1-42 at a concentration of 5 μmol/L for 48 hours following Liu et al. [30].
2.2. In vitro BBB models establishment
In vitro co-culturing BBB models in AD microenvironment were established as described previously [30]. First, after pericytes were cultured (2 × 10⁵ cells/cm2) on the lower chambers of Transwell inserts (0.4 μm pore size; Corning, NY, USA) overnight, hCMEC/D3 cells were subsequently placed on the upper chambers of Transwell inserts. NHA (2 × 10⁵ cells/cm2) were seeded onto the 6-well culture plate and cultured for 2 days before adding ECs inserts.
2.3. Real-time PCR assays
Nanodrop Spectrophotometer (ND-100, Thermo Scientific, Waltham, MA) was applied to determine the RNA concentration and quality. The expression levels of TRA2A (NM_001282757), LINC00662 (NR_027301), and ELK4 (NM_001973.4) were detected by One-Step SYBR PrimeScript RT-PCR Kit (Perfect Real Time; Takara Bio, Inc., Kusatsu, Japan). Relative expression values were calculated using the relative quantification (2−ΔΔCt) method. Primers are shown in Table A1.
2.4. Cell transfections
Silencing plasmid of LINC00662 was ligated into LV10 (U6/RFP&Puro) vector (GenePharma, Shanghai, China) to construct the shLINC00662 plasmid. The plasmid with LINC00662 full-length sequence was ligated into CMV-MCS-DsRed2-SV40-Neomycin vector (GeneChem, Shanghai, China) to construct the LINC00662 (O/E) plasmid. Short-hairpin RNA directed against human TRA2A, STAU1, UPF1, and ELK4 genes was ligated into the pGPU6/GFP/Neo vector (GenePharma) to construct shTRA2A, shSTAU1, shUPF1, and shELK4 plasmids, respectively. The human TRA2A and ELK4 genes coding sequence was ligated into pIRES2 vector (GenScript, Piscataway, NJ, USA) to construct the TRA2A (O/E) and ELK4 (O/E) plasmids. The respective no-targeting sequences were used as Cons. The ECs were stably transfected via LTX and Plus reagent (Life Technologies, Carlsbad, CA, USA) in AD microenvironment. The stably transfected cells were selected using G418 (0.4 mg/ml) (Sigma-Aldrich, St. Louis, MO, USA) or puromycin (1 μg/ml) (Sigma-Aldrich). Sequences of shTRA2A, shLINC00662, shELK4, shSTAU1, and shUPF1 are shown in Table A2. The transfected efficiency of shTRA2A and TRA2A (O/E) groups (Fig. 1C, D), shLINC00662 and LINC00662 (O/E) groups (Fig. 2D), and shELK4 and ELK4 (O/E) groups (Fig. 4F, G) were measured by qRT-PCR and western blot. For co-transfection of shTRA2A and shLINC00662, shLINC00662 was transiently transfected into Aβ1-42-incubated ECs, which stably transfected shTRA2A with lipofectamine 3000 reagent. After 48 hours, the transiently transfected cells were obtained. Other co-transfected ECs were established in the same way in AD microenvironment.
Figure 1.
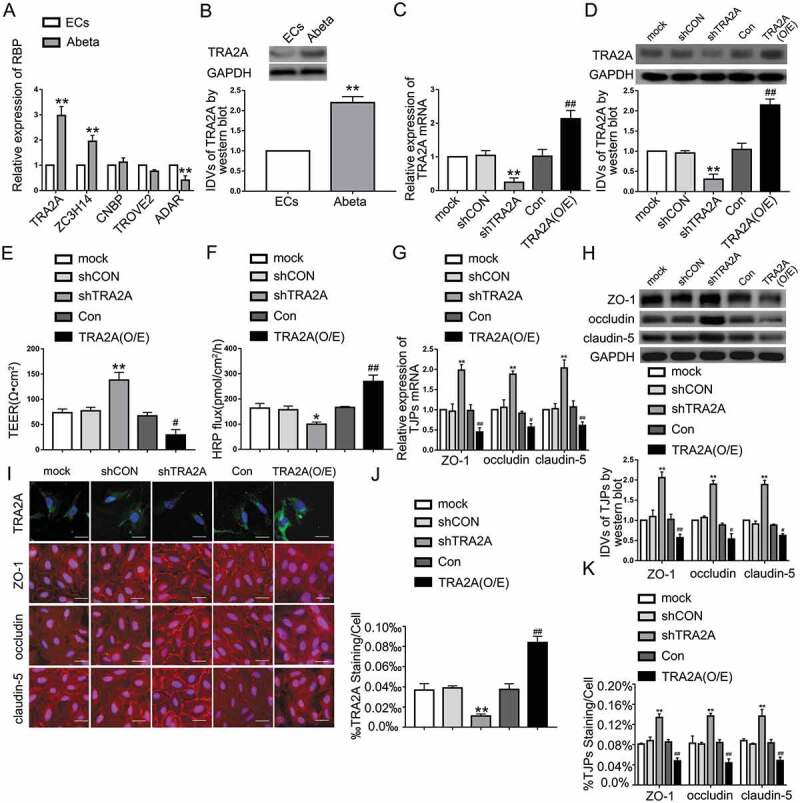
The TRA2A expression in Aβ1-42-incubated ECs and the effects on TRA2A in BBB permeability in AD microenvironment. (A) Relative mRNA expression of TRA2A, ZC3H14, CNBP, TROVE2, ADAR in Aβ1-42-incubated ECs by qRT-PCR. (B) Relative TRA2A protein levels in ECs pre-incubated with Aβ1-42. Data are presented as mean ± SD (n = 3, each). **P < 0.01 versus ECs group. (C) Efficiency of transfection of TRA2A knockdown and overexpression evaluated using qRT-PCR in Aβ1-42-incubated ECs. (D) Efficiency of transfection of TRA2A knockdown and overexpression determined by western blot in Aβ1-42-incubated ECs. (E and F) Effects of TRA2A on TEER values (E) and HRP flux (F) in AD microenvironment. (G) Effects of TRA2A on ZO-1, occludin, and claudin-5 expression levels in Aβ1-42-incubated ECs determined by qRT-PCR. (H) Effects of TRA2A on ZO-1, occludin, and claudin-5 expression levels in ECs pre-incubated with Aβ1-42 determined by western blot. (I) Effects of TRA2A on ZO-1, occludin, and claudin-5 expression levels and distribution in AD microenvironment determined by immunofluorescence staining (n = 3, each). The first row: immunofluorescence assays were used to determine the location and expression of TRA2A in ECs pre-incubated with Aβ1-42 (green, TRA2A; blue, DAPI nuclear staining). The remaining rows: immunofluorescence assays were used to determine ZO-1, occludin, and claudin-5 (red) expression levels and distribution, respectively, and nuclei (blue) were labelled with DAPI. Scale bar represents 30 μm. (J) Quantified TRA2A staining per cell was consistent with qualitative changes depicted in immunofluorescence images. (K) Quantified ZO-1, occludin, and claudin-5 staining per cell were consistent with qualitative changes depicted in immunofluorescence images. Data are presented as mean ± SD (n = 3, each). *P < 0.05 versus shCON group. **P < 0.01 versus shCON group. #P < 0.05 versus Con group.##P < 0.01 versus Con group.
Figure 2.
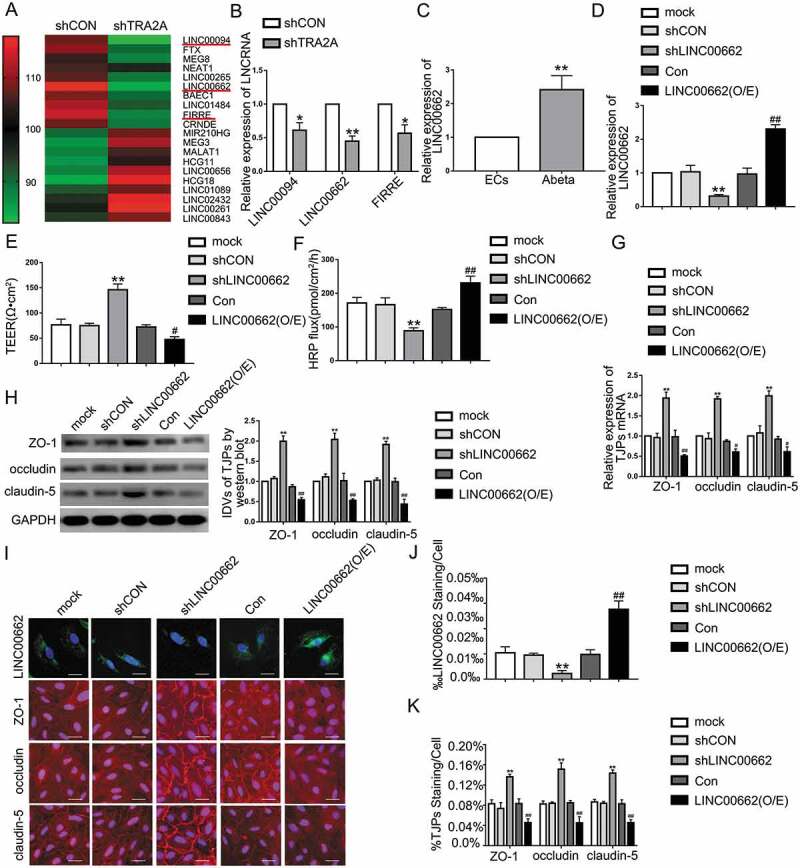
The LINC00662 endogenous expression and its effects on BBB permeability in AD microenvironment. (A) LncRNA microarray analysis was performed in TRA2A knockdown Aβ1-42-incubated ECs. Red indicates high relative expression and green indicates low relative expression. (B) Relative expression levels of LINC00094, LINC00662, and FIRRE in ECs pre-incubated with Aβ1-42 determined by qRT-PCR. Data represent mean ± SD (n = 3, each). *P < 0.05 versus shCON group.**P < 0.01 versus shCON group. (C) Relative expression of LINC00662 in ECs pre-incubated with Aβ1-42 by qRT-PCR. Data are presented as mean ± SD (n = 3, each). **P < 0.01 versus ECs group. (D) Efficiency of transfection of LINC00662 knockdown and overexpression in Aβ1-42-incubated ECs. (E and F) Effects of LINC00662 on TEER values (E) and HRP flux (F) in AD microenvironment. (G) Effects of LINC00662 on ZO-1, occludin, and claudin-5 expression levels in Aβ1-42-incubated ECs determined by qRT-PCR. (H) Effects of LINC00662 on ZO-1, occludin, and claudin-5 expression levels in ECs pre-incubated with Aβ1-42 determined by western blot. (I) Effects of LINC00662 on ZO-1, occludin, and claudin-5 expression levels and distribution in AD microenvironment (n = 3, each). The first row: FISH was used to determine the location and expression of LINC00662 in ECs pre-incubated with Aβ1-42 (green, LINC00662; blue, DAPI nuclear staining). The remaining rows: immunofluorescence assays were used to determine ZO-1, occludin, and claudin-5 (red) expression levels and distribution, respectively, and nuclei (blue) were labelled with DAPI. Scale bar represents 30 μm. (J) Quantified LINC00662 staining per cell was consistent with qualitative changes depicted in FISH images. (K) Quantified ZO-1, occludin, and claudin-5 staining per cell were consistent with qualitative changes depicted in immunofluorescence images. Data are presented as mean ± SD (n = 3, each). **P < 0.01 versus shCON group. #P < 0.05 versus Con group. ##P < 0.01 versus Con group.
Figure 4.
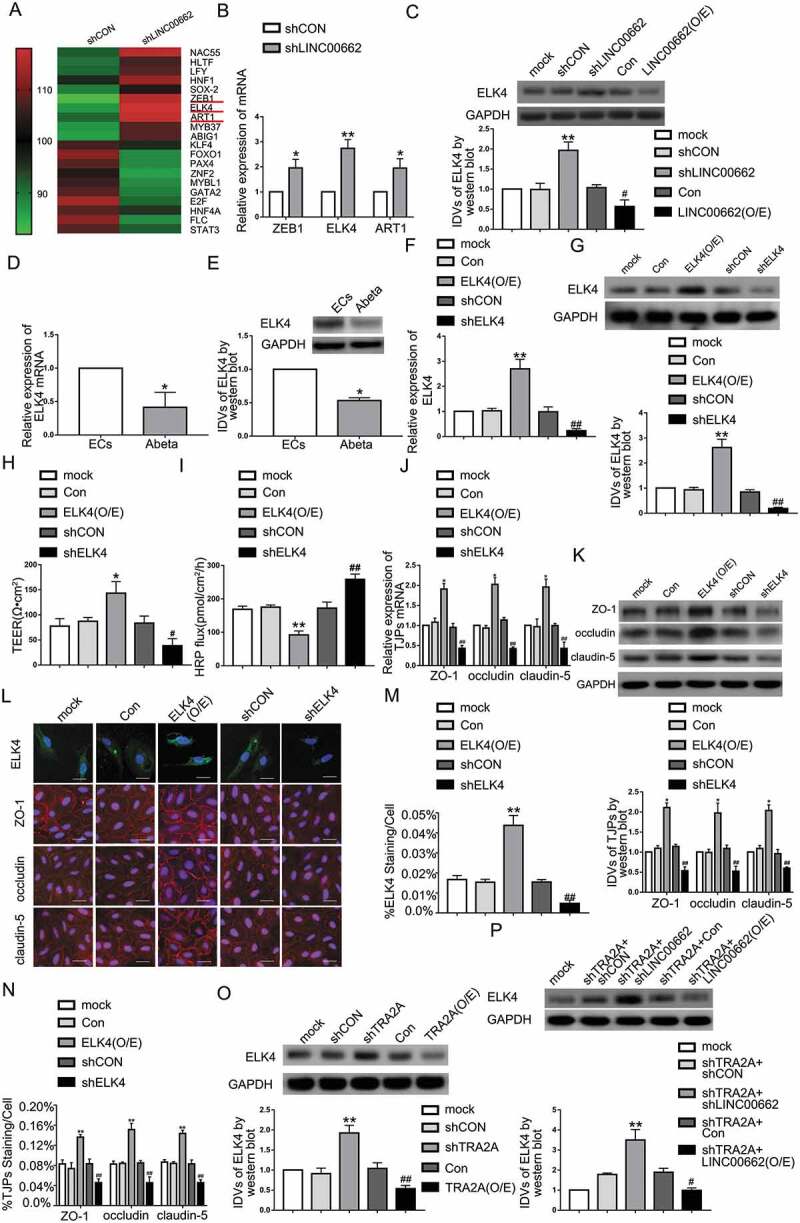
The ELK4 expression in Aβ1-42-incubated ECs and its effects on BBB permeability in AD microenvironment. (A) RNA microarray analysis was performed in Aβ1-42-incubated ECs treated with LINC00662 knockdown. Red indicates high relative expression and green indicates low relative expression. (B) Relative expression levels of ZEB1, ELK4, and ART1 in ECs pre-incubated with Aβ1-42 determined by qRT-PCR. Data represent mean ± SD (n = 3, each). *P < 0.05 versus shCON group. **P < 0.01 versus shCON group. (C) Effects of LINC00662 on ELK4 expression level in Aβ1-42-incubated ECs by western blot.**P < 0.01 versus shCON group. #P < 0.05 versus Con group. (D) Relative mRNA expression of ELK4 in ECs pre-incubated with Aβ1-42 by qRT-PCR. (E) Relative ELK4 protein levels in ECs pre-incubated with Aβ1-42 by western blot. Data are presented as mean ± SD (n = 4, each). *P < 0.05 versus ECs group. (F) Efficiency of transfection of ELK4 knockdown and overexpression evaluated using qRT-PCR in Aβ1-42-incubated ECs. (G) Efficiency of transfection of ELK4 knockdown and over-expression determined by western blot in Aβ1-42-incubated ECs. (H and I) Effects of ELK4 on TEER values (H) and HRP flux (I) in AD microenvironment. (J) Effects of ELK4 on ZO-1, occludin, and claudin-5 expression levels in Aβ1-42-incubated ECs determined by qRT-PCR. (K) Effects of ELK4 on ZO-1, occludin, and claudin-5 expression levels in ECs pre-incubated with Aβ1-42 determined by western blot. (L) Effects of ELK4 on ZO-1, occludin, and claudin-5 expression levels and distribution in Aβ1-42-incubated ECs determined by immunofluorescence staining (n = 3, each). The first row: immunofluorescence assays were used to determine the location and expression of ELK4 in ECs pre-incubated with Aβ1-42 (green, ELK4; blue, DAPI nuclear staining). The remaining rows: immunofluorescence assays were used to determine ZO-1, occludin, and claudin-5 (red) expression levels and distribution, respectively, and nuclei (blue) were labelled with DAPI. Scale bar represents 30 μm. (M) Quantified ELK4 staining per cell was consistent with qualitative changes depicted in immunofluorescence images. (N) Quantified ZO-1, occludin, and claudin-5 staining per cell were consistent with qualitative changes depicted in immunofluorescence images. Data are presented as mean ± SD (n = 3, each). *P < 0.05 versus Con group. **P < 0.01 versus Con group. #P < 0.05 versus shCON group. ##P < 0.01 versus shCON group. (O) Protein levels of ELK4 regulated by TRA2A in AD microenvironment; data are presented as mean ± SD (n = 3, each). **P < 0.01 versus shCON group. ##P < 0.01 versus Con group. (P) Protein levels of ELK4 regulated by TRA2A and LINC00662 in AD microenvironment; data are presented as mean ± SD (n = 3, each). ShCON and Con groups represent Aβ1-42-incubated ECs transfected with LINC00662 knockdown and overexpression empty vector, respectively. **P < 0.01 versus shTRA2A + shCON group. #P < 0.05 versus shTRA2A +Con group.
2.5. Transendothelial electric resistance (TEER) assays
Amillicell-ERS apparatus (Millipore, Billerica, MA, USA) was applied to perform TEER assays after in vitro BBB models constructed. Each measurement was placed in room temperature for 30 minutes, and TEER values were recorded. TEER values were measured after exchanging the medium. Background electric resistances were subtracted before the final resistances were calculated. TEER value (Ω·cm2) is electric resistance multiplied by the effective surface area of the transwell insert.
2.6. Horseradish peroxidase (HRP) flux assays
In vitro BBB models were constructed and 1 ml of serum-free EBM-2 medium containing 10 μg/mLHRP (0.5 mmol/L, Sigma-Aldrich) culture medium was added into the upper chamber of the transwell system. One hour later, 5 μL of culture medium in the lower chamber was collected and the HRP content of the samples was detected by tetramethylbenzidinecolorimetry approach. The final HRP value was expressed as pmol/cm2/h.
2.7. Western blot assays
The cell lysates were extracted from ECs. Total proteins were extracted with RIPA buffer (Beyotime Institute of Biotechnology, Jiangsu, China) supplemented with protease inhibitors (10 mg/mL aprotinin, 10 mg/mL phenyl-methylsulfonyl fluoride [PMSF], and 50 mM sodium orthovanadate) and centrifuged at 17,000 × g for 30 minutes at 4°C. Equal amounts of proteins were further separated using SDS-PAGE and then transferred to polyvinylidene fluoride (PVDF) membranes (Millipore, Shanghai, China). Membranes were blocked to avoid non-specific bindings in Tris-buffered saline-Tween (TBST) containing 5% fat-free milk for 2 hours and subsequently incubated with primary antibodies (shown in Table A4) at 4°C overnight. After three washes with TBST, membranes were incubated with the corresponding secondary antibody at a 1:10,000 dilution at room temperature for 2 hours. Immunoblots were visualized by enhanced chemiluminescence (ECL kit, Santa Cruz Biotechnology) after washes. All the protein bands were scanned by Chem Imager 5500 V2.03 software and the integrated density values (IDVs) were calculated utilizing FluorChem 2.0 software.
2.8. Immunofluorescence assays
After fixed by 4% paraformaldehyde for 20 minutes, the Aβ1-42-incubatedECs permeated in phosphate-buffered saline (PBS) containing 0.2% Triton X-100 for 10 min. Next, cells were blocked by 5% bovine serum album (BSA) in PBS for 2 hours at room temperature and incubated with primary antibodies (anti-ZO-1, 1:50, Life Technologies; anti-occludin, 1:50, Life Technologies; anti-claudin-5, 1:50, Life Technologies; anti-TRA2A, 1:50, abcam; anti-ELK4, 1:50, Thermo fisher Scientific) respectively at 4°C overnight. After three washes with PBS, cells were incubated with fluorophore-conjugated secondary antibodies for2 hours. DAPI was applied to observe cell nuclei. The staining was observed by immunofluorescence microscope (Olympus, Tokyo, Japan) and analysed using MetaMorph software (Molecular Devices, Sunnyvale, CA, USA). ZO-1 staining was quantified by applying an identical threshold for ZO-1 immunofluorescence to five randomly selected images of each endothelial culture according to Hue, et al. [32]. ZO-1 staining was quantified as the area percentage of an image with fluorescence above a predetermined threshold, normalized to the total number of cells in each image. An identical quantitative analysis method was applied to occludin, claudin-5, TRA2A and ELK4 in all samples.
2.9. Fluorescence in situ hybridization (FISH)
For identification of STAU1 location in Aβ1-42-incubated ECs, FISH was conducted with STAU1 probe (green-labelled, Boster, China) according to Liu, et al. [33]. Aβ1-42-incubated ECs were fixed on slides in 4% formaldehyde (Sigma) for 15 min and then washed with PBS (containing 1% diethyl pyrocarbonate [DEPC], Dingguo, China) three times. After blocking with prehybridization buffer (3% BSA in 4 × saline-sodium citrate, SSC), slides were digested with PCR-grade proteinase K (Roche Diagnostics, Mannheim, Germany). The hybridization mix was prepared with STAU1 probe in the hybridization solution. Then, the slides were washed with washing buffer and the sections were stained with anti-digoxin rhodamine conjugate (1:100, Exon Biotech Inc, Guangzhou, China) at 37°C for 1 h in the dark. Subsequently, the sections were stained with DAPI for nuclear staining. We also used the same method to determine LINC00662 location and expression level in Aβ1-42-incubated ECs with LINC00662 probe (green-labelled, Boster, China). All images were observed with immunofluorescence microscope (Olympus, Tokyo, Japan). The amount of LINC00662 in Aβ1-42-incubated ECs was analysed using MetaMorph software.
2.10. Chromatin immunoprecipitation assays
Chromatin immunoprecipitation (ChIP) assays were conducted to confirm the interaction between the ELK4 and TJPs promoter region. ChIP kit (Cell Signaling Technology, Danvers, MA, USA) was used for ChIP assays following the manufacture’s description. Briefly, Aβ1-42-incubatedECs were crosslinked with 1% formaldehyde and collected in lysis buffer. Chromatin was then digested with Micrococcal Nuclease. Immunoprecipitates were incubated with 3 μg anti-ELK4 antibody (Santa Cruz, USA) or normal rabbit IgG and incubated with Protein G agarose beads at 4°C overnight with gentle shaking while 2% lysates were used as input reference. DNA crosslink was reversed with 5 M NaCl and proteinase K and purified. Immunoprecipitation DNA was amplified by PCR using their specific primers. In each PCR reaction, the corresponding inputs were taken in parallel for PCR validation. Primers used for ChIP PCR are shown in Table A3.
2.11. Human lncRNA and RNA microarrays
LncRNA and RNA analysis, sample preparation, and microarray hybridization were completed by Kangchen Bio-tech (Shanghai, China).
2.12. Reporter vector construction and dual-luciferase reporter assays
The putative LINC00662 binding regions in the ELK4 gene were amplified by PCR and cloned into downstream of pmirGLO dual-luciferase vector (Promega, Madison, WI, USA) to form the wide-type plasmid (ELK4-3ʹUTR-Wt) (GenePharma). Similarly, the binding sequences were mutated as indicated to form the mutant-type plasmid (ELK4-3ʹUTR-Mut). The pmirGLO vector constructed with either 3ʹ-UTR fragments or mutation of 3ʹ-UTR fragments and LINC00662 (O/E) or LINC00662 (O/E) empty vector were cotransfected into HEK293 T cells in 24-well plates using Lipofectamine 3000. ECs were obtained for analysis by luciferase assay using the Dual-Luciferase Reporter Assay System (Promega) 48 hours after transfection. The relative luciferase activity was expressed as the ratio of firefly luciferase activity to renilla luciferase activity.
Human genomic DNA was used to amplify different promoter fragments, subcloned into pGL3-Basic-Luciferase vector (Promega) containing a firefly luciferase reporter gene and verified by DNA sequencing. Human full-length ELK4 was constructed in pEX3 (pGCMV/MCS/Neo) plasmid vector (GenePharma). HEK293 T cells were co-transfected with the pGL3 vector of ZO-1, occludin, and claudin-5 with either full-length promoter regions (or deleted promoter regions) and pEX3-ELK4 (or pEX3 empty vector) using Lipofectamine 3000. Relative luciferase activity was analysed as described previously.
2.13. RNA immunoprecipitation (RIP) assays
EZ-Magna RNA-binding protein immunoprecipitation kit (Millipore, USA) was performed according to the manufacture’s protocol. Whole cell lysate was incubated with human 5 μg human anti-Ago2 antibody, or NC normal mouse IgG. Furthermore, purified RNA was extracted and applied to qRT-PCR to demonstrate the presence of the binding targets.
2.14. RNA pull-down assays
Biotin-labelled, full-length LINC00662 or antisense RNA was prepared with the Biotin RNA Labeling Mix (GenePharma, Shanghai, China) and transfected into ECs. Biotinylated RNAs were treated with RNase-free DNase I and purified. RNA-protein complexes were isolated by streptavidin agarose beads (Invitrogen, Shanghai, China) and washed three times. The retrieved proteins were detected using a standard western blotting technique with GAPDH as the control.
2.15. Nascent RNA capture
Nascent RNAs were detected using Click-iT® Nascent RNA Capture Kit (Thermo Fisher Scientific, USA) according to the manufacture’s protocol. Briefly, nascent RNAs were marked with 0.2 mM 5-ethynyl uridine (EU) and the EU-nascent RNA was captured on magnetic beads for subsequent qRT-PCR.
2.16. mRNA stability assays
In order to inhibit the nascent RNA synthesis, 5 ug/ml actinomycin D (ActD, NobleRyder, China) was added into ECs culture medium. Total RNA was extracted at 0, 2, 4, 6, 8, 10 h and its concentrations were measured by qRT-PCR. The half-life of RNA was determined by its level at a certain point of time compared with time zero.
2.17. Statistical analysis
Statistical analysis was performed with GraphPad Prism v7.00 (GraphPad Software, La Jolla, CA, USA) software. Data were described as mean±standard deviation (SD). All differences were analysed by SPSS18.0 statistical software with the Student’s t-test (two-tailed) or one-way ANOVA. P-values below 0.05 were considered significant.
3. Results
3.1. TRA2A was highly expressed in Aβ1-42-incubated ECs and knockdown of TRA2A decreased BBB permeability in AD microenvironment
In this study, Aβ1-42-incubated human brain microvascular endothelial cells (hCMEC/D3) were used to simulate the model of BBB in AD microenvironment. TEER values and HRP flux were detected to analyse the integrity and permeability of BBB, respectively. In AD microenvironment, TEER was decreased (Figure S1-A) and HRP flux was increased significantly (Figure S1-B), indicating the BBB impairment in AD. To determine the mechanisms of the effect of Aβ1-42 on BBB permeability, we monitored the TJPs expression levels at different time points after Aβ1-42-incubation. As shown in Figure S1-C, the expression of TJPs decreased with time in the first 48 hours of Aβ1-42-incubation. Then, the decrease of TJPs expression is slowed down. There is no significant decrease at 72 h of Aβ1-42-incubation compared to at 48 h. Considering that RBPs play a pivotal role in AD and the occurrence of AD is accompanied by BBB breakdown, we inferred that RBP may regulate BBB permeability in AD microenvironment. By searching the bioinformatics database AlzData (http://www.alzdata.org/), the most abundant RBPs found in the ECs of AD patients are TRA2A, ZC3H14, CNBP, TROVE2 and ADAR. As shown in Figs. 1A, B, and S1-D, E, TRA2A mRNA and protein levels were upregulated in Aβ1-42-incubated ECs the most. In the first 48 hours, TRA2A increased gradually with increasing incubation time. TRA2A expression increased significantly after 12 hours of Aβ1-42-incubation. At 72 h of Aβ1-42-incubation, the increase of TRA2A expression level is not as significant as at 48 h (Figure S1-F). To verify the role of TRA2A in BBB function in AD microenvironment, the in vitro BBB model was constructed using Aβ1-42-incubated ECs transfected with shTRA2A or TRA2A (O/E) plasmid. TEER was increased (Fig. 1E), and HRP flux was decreased (Fig. 1F) in shTRA2A group, indicating that TRA2A knockdown decreased BBB permeability in AD microenvironment. Expression levels and distribution of ZO-1, occludin, and claudin-5 were detected to clarify the possible mechanisms of BBB permeability. As shown in Fig. 1G, H, TRA2A knockdown significantly induced ZO-1, occludin, and claudin-5 mRNA and protein expression in Aβ1-42-incubated ECs. In Fig. 1I, J, immunofluorescence assays were conducted to further evaluated TRA2A transfection efficiency. Moreover, consistent with the western blot results, immunofluorescence staining showed that TRA2A knockdown increased the expression of ZO-1, occludin, and claudin-5, with discontinuous distribution to relatively continuous distribution on the boundaries of Aβ1-42-incubated ECs (Fig. 1I). The quantification of ZO-1, occludin, and claudin-5 immunofluorescence staining showed that the area percentage of the above mentioned TJPs staining per cell significantly increased in shTRA2A group (Fig. 1K), whereas TRA2A overexpression decreased TEER values, increased HRP flux, and reduced ZO-1, occludin and claudin-5 mRNA and protein expression (Fig. 1E-K). The above data indicated that TRA2A was increased in ECs pre-incubated with Aβ1-42 and may enhance the BBB permeability by regulating ZO-1, occludin, and claudin-5 expression in AD microenvironment.
3.2. LINC00662 was upregulated in Aβ1-42-incubated ECs and knockdown of LINC00662 decreased BBB permeability in AD microenvironment
To investigate lncRNAs involved in TRA2A-mediated regulation in BBB permeability, we used lncRNA microarray. We found that LINC00094, LINC00662, and FIRRE were significantly downregulated in Aβ1-42-incubated ECs transfected with shTRA2A plasmid (Fig. 2A). Further, lncRNAs levels in Aβ1-42-incubated ECs treated with shTRA2A plasmid were investigated by qRT-PCR. As Fig. 2B shows, LINC00662 expression was downregulated most significantly in Aβ1-42-incubated ECs treated with shTRA2A. Moreover, LINC00662 expression was upregulated in Aβ1-42-incubated ECs (Fig. 2C). In the first 48 hours, LINC00662 increased gradually with increasing incubation time. LINC00662 expression increased significantly after 12 hours of Aβ1-42-incubation. At 72 h of Aβ1-42-incubation, the increase of LINC00662 expression level is not as significant as at 48 h (Figure S1-G). TEER value in shLINC00662 group was increased significantly (Fig. 2-E) and HRP flux was attenuated significantly (Fig. 2F) compared to shCON group. The mechanistic studies show that mRNA and protein levels of ZO-1, occludin, and claudin-5 in Aβ1-42-incubated ECs were promoted after LINC00662 knockdown (Fig. 2G, H). FISH analysis and the quantification of the staining showed the transfection efficiency of shLINC00662 (Fig. 2I, J). Immunofluorescence and the quantification of the immunostaining confirmed that downregulation of LINC00662 increased expression levels of ZO-1, occludin, and claudin-5, with more continuous distribution on the boundaries of ECspre-incubated with Aβ1-42 (Fig. 2I, K). LINC00662 overexpression decreased TEER values, increased HRP flux and attenuated ZO-1, occludin and claudin-5 mRNA and protein expression (Fig. 2E-K). The above results revealed that LINC00662 may enhance BBB permeability by regulating ZO-1, occludin, and claudin-5 expression in AD microenvironment.
3.3. LINC00662 was involved in TRA2A-mediated regulation of BBB permeability in AD microenvironment
As shown in Fig. 3A, the expression levels of LINC00662 were significantly decreased in shTRA2A group and increased in TRA2A (O/E) group in AD microenvironment. To explore the correlation between TRA2A and LINC00662, RIP assays and RNA pull-down assays were used to confirm that TRA2A binds to LINC00662 directly in AD microenvironment. As shown in Fig. 3B, the enrichment of LINC00662 in Anti-TRA2A group was higher than in Anti-IgG group. Levels of TRA2A captured by Anti-LINC00662 group were significantly higher than those in the anti-antisense group (Fig. 3C). There was no significant statistical difference of nascent LINC00662 expression levels between shTRA2A group and shCON group, as well as TRA2A (O/E) group and Con group (Fig. 3D). As shown in Fig. 3E, LINC00662 half-life was significantly decreased in the shTRA2A group and increased in TRA2A (O/E) group. The results of nascent LINC00662 and LINC00662 half-lives indicate that TRA2A upregulated LINC00662 by increasing the stability of LINC00662 instead of affecting nascent LINC00662. Moreover, cotransfection of stable shTRA2A ECs with shLINC00662 further increased TEER values (Fig. 3F) and the impairment in HRP flux (Fig. 3G) in AD microenvironment. LINC00662 knockdown magnified the increase in ZO-1, occludin, and claudin-5 expression caused by TRA2A knockdown in AD microenvironment (Fig. 3H). These results indicated that TRA2A may increase BBB permeability by stabilizing LINC00662.
Figure 3.
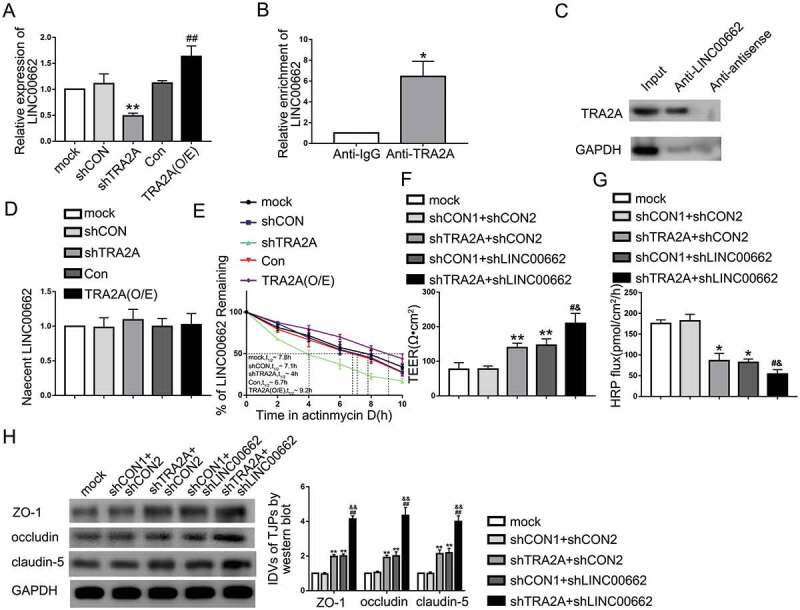
TRA2A regulated BBB permeability by stabilizing LINC00662 in AD microenvironment. (A) Effects of TRA2A on LINC00662 expression in ECs pre-incubated with Aβ1-42 determined by qRT-PCR. Data are presented as mean ± SD (n = 4, each). **P < 0.01 versus shCON group. ##P < 0.01 versus Con group. (B) RNA-IP confirmed the binding interaction between TRA2A and LINC00662 in AD microenvironment. Relative enrichment was measured by qRT-PCR; Data are presented as mean ± SD (n = 3, each). *P < 0.05 versus Anti-IgG group. (C) RNA pull-down indicated that TRA2A bind to LINC00662 directly in AD microenvironment. (D) The graph shows nascent LINC00662 levels in Aβ1-42-incubated ECs; data are presented as mean ± SD (n = 3, each). (E) The graph shows LINC00662 levels in ECs pre-incubated with Aβ1-42 at different times treated by ActD in the mock, shCON, shTRA2A, Con and TRA2A (O/E) groups. (F and G) Effects of TRA2A and LINC00662 knockdown on TEER values (F) and HRP flux (G) in AD microenvironment. (H) Effects of TRA2A and LINC00662 knockdown on ZO-1, occludin, and claudin-5 expression levels in Aβ1-42-incubated ECs determined by western blot. ShCON1 group represents Aβ1-42- incubated ECs transfected with shTRA2A empty vector and shCON2 group represents Aβ1-42-incubated ECs transfected with shLINC00662 empty vector. Data are presented as mean ± SD (n = 3, each). *P < 0.05 versus shCON1 + shCON2 group, **P < 0.01 versus shCON1 + shCON2 group, #P < 0.05 versus shTRA2A + shCON2, ##P < 0.01 versus shTRA2A + shCON2, &P < 0.05 versus shCON1 + shLINC00662 group, &&P < 0.01 versus shCON1 + shLINC00662 group.
3.4. ELK4 was downregulated in Aβ1-42-incubated ECs and decreased BBB permeability by regulating ZO-1, occludin, and claudin-5 expression in AD microenvironment
Microarray analysis of LINC00662 knockdown in Aβ1-42-incubated ECs showed that ZEB1, ELK4, and ART1 are most abundant (Fig. 4A). Increased ELK4 expression investigated by qRT-PCR was the most significant (Fig. 4B). ELK4 protein was highly expressed in shLINC00662 group and downregulated in LINC00662 (O/E) group (Fig. 4C). As shown in Fig. 4D,E, mRNA and protein expression levels of ELK4 in Aβ1-42-incubated ECs were lower than those in the ECs group. As shown in Figure S1-H, the expression of ELK4 decreased with time in the first 48 hours of Aβ1-42-incubation. Then, the decrease of ELK4 expression is slowed down. There is no significant decrease at 72 h of Aβ1-42-incubation compared to at 48 h. To verify the role of ELK4 in BBB permeability in AD microenvironment, we knocked down and overexpressed ELK4 to elucidate its function. As shown in Fig. 4H, I, when compared to the Con group, TEER in ELK4 (O/E) group increased significantly whereas HRP flux decreased. Concomitantly when compared to the shCON group, TEER in the shELK4 group decreased significantly and HRP flux increased. Moreover, ZO-1, occludin, and claudin-5 mRNA and protein exhibited higher expression levels in the ELK4 (O/E) group and ELK4 knockdown inhibited ZO-1, occludin, and claudin-5 expression (Fig. 4J, K). Transfection efficiency of ELK4 (O/E) and shELK4 was also confirmed by immunofluorescence assays (Fig. 4L, M). Subsequent immunofluorescence showed that ZO-1, occludin and claudin-5 were upregulated in the ELK4 (O/E) group, which exhibited relative continuous distribution on the boundaries of Aβ1-42-incubated ECs. ELK4 knockdown led to the opposite results (Fig. 4L). As shown in Fig. 4N, the area percentage of ZO-1, occludin, and claudin-5 immunostaining per cell was significantly increased in the ELK4 (O/E) group and decreased in the shELK4 group. We further explored the role of TRA2A and LINC00662 on the expression of ELK4. The protein level of ELK4 is increased in the shTRA2A group and decreased in the TRA2A (O/E) group significantly in AD microenvironment (Fig. 4O). To determine whether the effect of TRA2A on ELK4 expression was mediated by LINC00662, the stable shTRA2A ECs were transfected with shLINC00662 or LINC00662 (O/E) plasmid in AD microenvironment. LINC00662 knockdown further increased ELK4 levels caused by TRA2A knockdown, whereas LINC00662 overexpression rescued promotional effect on ELK4 caused by TRA2A knockdown (Fig. 4P). The above results demonstrated that ELK4 was downregulated in Aβ1-42-incubated ECs and ELK4 knockdown may increase the BBB permeability by regulating ZO-1, occludin, and claudin-5 expression in AD microenvironment.
3.5. LINC00662 downregulated the expression of ELK4 through SMD pathway, downregulated the expression of ZO-1, occludin, and claudin-5 and increased the permeability of BBB in AD microenvironment
By querying the bioinformatics database, RepeatMasker and IntaRNA, we found that LINC00662 has the putative binding site with the ELK4 3ʹUTR (Figure. S2-C-E). Therefore, we hypothesized that LINC00662 exhibits a negative regulatory effect on ELK4 via SMD pathway in AD microenvironment. To verify the interaction between LINC00662 and ELK4, we used dual-luciferase reporter assays to confirm the predicted binding site. The relative luciferase activity assays in ELK4-3ʹUTR-Wt+LINC00662 (O/E) group were remarkably lower than ELK4-3ʹUTR-Wt+Con group, while there was no significant difference between ELK4-3ʹUTR-Mut+LINC00662 (O/E) and ELK4-3ʹUTR-Mut+Con group in AD microenvironment (Fig. 5A). RNA pull-down assays also confirmed that LINC00662 binds directly to ELK4 in AD microenvironment (Fig. 5B). Next, we used RIP assays and RNA pull-down assays to elucidate the interaction between LINC00662 and STAU1 in AD microenvironment. The RIP assays showed that LINC00662 was enriched in anti-STAU1 group compared with anti-IgG group. Overexpression of TRA2A increased the LINC00662 enrichment in anti-STAU1 group (Fig. 5C). RNA pull-down assays also confirmed that LINC00662 binds directly to STAU1 in AD microenvironment (Fig. 5D). Similarly, as shown in Fig. 5E, RIP assays confirmed that ELK4 mRNA binds to STAU1 directly in AD microenvironment. As shown in Figure S1-I and J, compared with normal ECs, the level and subcellular localization of STAU1 did not change in AD microenvironment. The FISH showed that STAU1 was localized in the cytoplasm. In order to confirm that STAU1 participates in the interaction between LINC00662 and ELK4, Aβ1-42-incubated ECs was co-transfected with shSTAU1 and shLINC00662 plasmids. qRT-PCR demonstrated that nascent ELK4 levels in mock, shCON1+ shCON2, shSTAU1+ shCON2, shCON1+ shLINC00662, and shSTAU1+ shLINC00662 groups are not statistically significant in AD microenvironment (Fig. 5F). ELK4 mRNA half-life was significantly increased in the shLINC00662+ shSTAU1 group (Fig. 5G). Both shSTAU1+ shCON2 and shCON1+ shLINC00662 groups exhibited higher ELK4 expression than shCON1+ shCON2 group. The promotive effect was magnified in shSTAU1+ shLINC00662 group in AD microenvironment (Fig. 5H). We further knocked down UPF1 in Aβ1-42-incubated ECs to measure the expression levels of ELK4 in AD microenvironment. There were no statistical differences in nascent ELK4 mRNA levels between mock, shCON, and shUPF1 groups in AD microenvironment. The half-life of ELK4 mRNA was significantly prolonged in shUPF1 group (Figure S1-K). ELK4 protein expression level was increased significantly in shUPF1 group (Fig.S1-L). As shown in Fig. 5I, J, compared to shCON1+ Con2 group, TEER in shLINC00662+ ELK4 (O/E) group was increased and HRP flux was decreased significantly in AD microenvironment. Co-knockdown of ELK4 and LINC00662 largely reversed the LINC00662 knockdown induced the increase in TEER and the impairment in HRP flux in AD microenvironment. As shown in Fig. 5K, compared to shCON1+ Con2 group, ZO-1, occludin, and claudin-5 protein expression increased in shLINC00662+ ELK4 (O/E) group in AD microenvironment. Moreover, co-knockdown of LINC00662 and ELK4 largely reversed the promotive effect of ZO-1, occludin, and claudin-5 expression in Aβ1-42 incubated ECs caused by LINC00662 knockdown. These results suggested that LINC00662 may regulate BBB permeability by downregulating ELK4 through SMD pathway in AD microenvironment.
Figure 5.
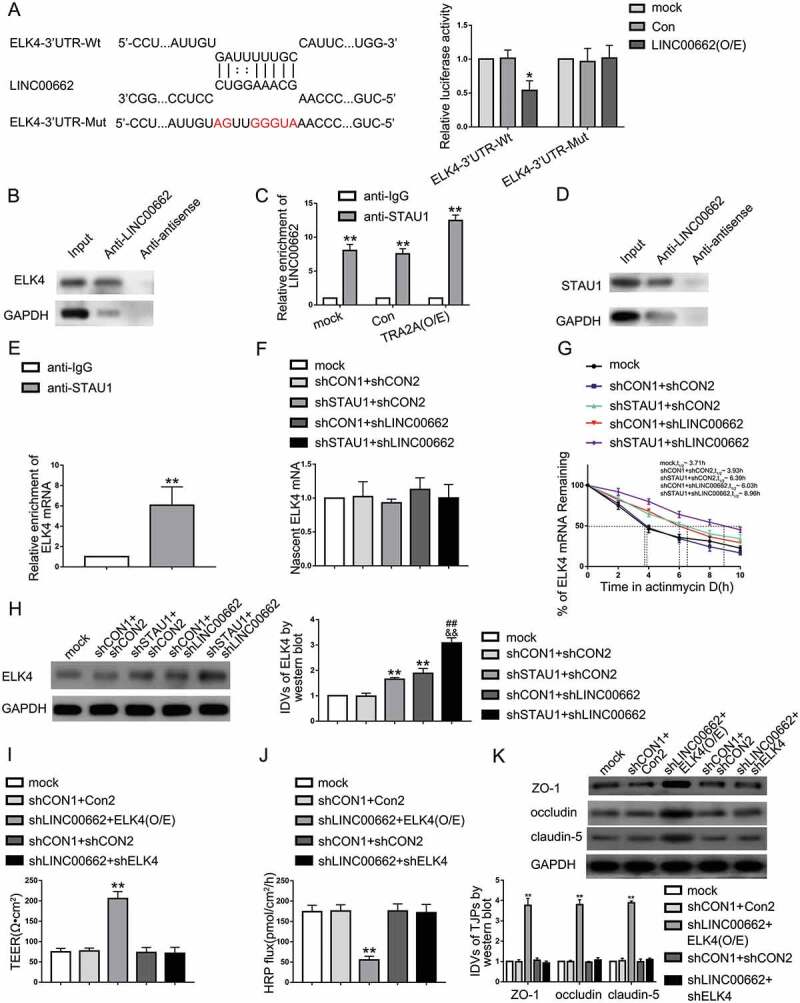
LINC00662 regulated BBB permeability by degrading ELK4 mRNA through SMD pathway in AD microenvironment. (A) The predicted LINC00662 binding site in ELK4 mRNA 3ʹUTR and results of dual-luciferase reporter assays in AD microenvironment. Data are presented as mean ± SD (n = 3, each group). *P < 0.05 versus ELK4-3ʹUTR-Wt+Con group. (B) RNA-pull down confirmed the binding interaction between LINC00662 and ELK4 in Aβ1-42-incubated ECs. (C) RNA-IP confirmed the binding interaction between LINC00662 and STAU1 in Aβ1-42-incubated ECs. Relative enrichment was measured by qRT-PCR; data are presented as mean ± SD (n = 3, each). **P < 0.01 versus anti-IgG group. (D) RNA pull-down indicated that LINC00662 bind to STAU1 directly in AD microenvironment. (E) RNA-IP confirmed the binding interaction between ELK4 and STAU1 in ECs pre-incubated with Aβ1-42. Relative enrichment was measured by qRT-PCR; data are presented as mean ± SD (n = 3, each). **P < 0.01 versus anti-IgG group. (F) The graph shows nascent ELK4 levels in Aβ1-42-incubated ECs treated with LINC00662 knockdown and STAU1 knockdown; data are presented as mean ± SD (n = 3, each). (G) Stability of ELK4 mRNA regulated by knockdown of LINC00662 and STAU1 in AD microenvironment. (H) ELK4 expression regulated by STAU1 and LINC00662 knockdown in Aβ1-42-incubated ECs; data are presented as mean ± SD (n = 3, each). ShCON1 group represents Aβ1-42- incubated ECs transfected with shSTAU1 empty vector and shCON2 group represents Aβ1-42-incubated ECs transfected with shLINC00662 empty vector. **P < 0.01 versus shCON1 + shCON2 group, ##P < 0.01 versus shSTAU1 + shCON2, &&P < 0.01 versus shCON1 + shLINC00662 group. (I and J) TEER values (I) and HRP flux (J) to evaluate the effects of LINC00662 and ELK4 on BBB integrity in AD microenvironment. (K) Effects of LINC00662 and ELK4 on ZO-1, occludin, and claudin-5 protein levels in AD microenvironment. Data are presented as mean ± SD (n = 3, each). ShCON1 group represents Aβ1-42-incubated ECs transfected with shLINC00662 empty vector. ShCON2 group represents Aβ1-42-incubated ECs transfected with ELK4 knockdown vector, and Con2 group represents Aβ1-42-incubated ECs transfected with ELK4 overexpression vector. **P < 0.01 versus shCON1 + Con2 group.
3.6. ELK4 bound to the promoters of ZO-1, occludin, and claudin-5 and promoted transcription in AD microenvironment
To further verify the mechanisms of ELK4 affecting the permeability of BBB, we used bioinformatics software (JASPAR) to query the relationship between ELK4 and TJPs. We found that the ZO-1, occludin, and claudin-5 promoters might harbour putative binding sites for ELK4. Subsequent dual-luciferase reporter assays and ChIP assays were conducted to confirm any association between ELK4 and the mentioned promoters in AD microenvironment. As shown in Fig. 6A-C, ZO-1, occludin, and claudin-5 promoter activities were remarkably increased after co-transfection with pEX3-ELK4. Subsequently, putative ELK4 binding sites within the ZO-1, occludin, and claudin-5 promoters were deleted successively. As shown in Fig. 6A, deletion of the −880 site and the −570 site caused a reduction of the ZO-1 promoter activity, indicating that the −880 site and the −570 site of ZO-1 promoter contain high promoter activity, whereas after the deletion of the −381 site, the promoter activity did not change significantly. As shown in Fig. 6B, following the deletion of the −531 site, occludin promoter activity diminished. As shown in Fig. 6C, deletion of −153 site reversed the increase in promoter activity, and so did the deletion of −81 site. Thus, ELK4 could bind to the ZO-1, occludin, and claudin-5 promoter regions and activate above mentioned TJPs’ transcription in AD microenvironment. Consistent with the dual-luciferase reporter assays, ChIP assays show that ELK4 binds with the ZO-1, occludin, and claudin-5 promoters in AD microenvironment. As shown in Fig. 6D-F, putative ELK4 binding sites, i.e., −880, −570, and −381 site regions of the ZO-1 promoter; −531 site region of the occludin promoter; and −327, −153, and −81 site regions of the claudin-5 promoter were used. As a negative control, PCR was used to amplify the 2,000 bp upstream region of the putative ELK4 binding sites that was not expected to associate with ELK4. As shown in Fig. 6D, PCR products were observed in the ELK4 immunoprecipitation in the PCR2 and the PCR3 groups, which indicated that ELK4 bound to ZO-1 promoter at −880 and −570 bp regions. Similarly, Fig. 6E, F shows that ELK4 binds occludin and claudin-5 promoters directly. In general, the results showed that ELK4 transcriptionally promoted ZO-1, occludin, and claudin-5 expression by binding with the gene promoters in AD microenvironment.
Figure 6.
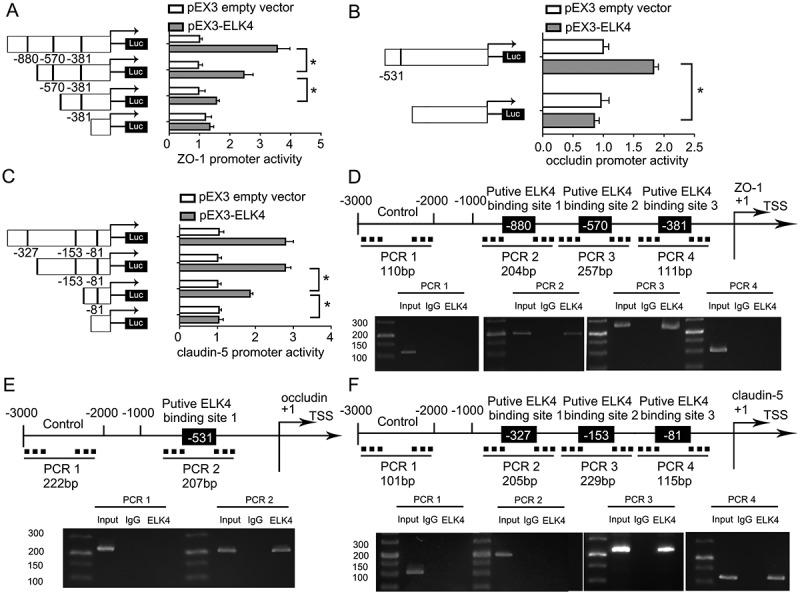
ELK4 increased the Promoter Activity of ZO-1, occludin, and claudin-5 in ECs pre-incubated with Aβ1-42. (A-C) Schematic depiction of the different reporter plasmids and relative luciferase activity in AD microenvironment: ZO-1 (A), occludin (B), and claudin-5 (C) are shown. The Y-bar shows the deletion positions on the promoter fragments. The X-bar shows the reporter vector activity after normalization with the cotransfected reference vector (pRL-TK), and relative to the activity of the pEX3 empty vector, and the activity was set to 1. Data represent mean ± SD (n = 5, each). *P < 0.05. (D-F) ELK4 bound to the promoters of ZO-1 (D), occludin (E), claudin-5 (F) in Aβ1-42-incubated ECs. Transcription start site (TSS) was designated as +1. Putative ELK4 binding sites are illustrated. Immunoprecipitated DNA was amplified by PCR. Normal rabbit IgG was used as a negative control.
4. Discussion
This study demonstrated for the first time that RBP-TRA2A and lncRNA-LINC00662 are highly expressed in Aβ1-42 incubated ECs, and knockdown of TRA2A or LINC00662 can significantly reduce BBB permeability in AD microenvironment. TRA2A knocking down reduces the stability of LINC00662 and downregulates its expression; downregulating LINC00662 decreased ELK4 mRNA degradation through SMD pathway, thereby increasing ELK4 expression. Moreover, the increased ELK4 decreases BBB permeability through transcriptional promotion of the expression of ZO-1, occludin, and claudin-5. The schematic of TRA2A/LINC00662/ELK4 axis is shown in Fig. 7.
Figure 7.
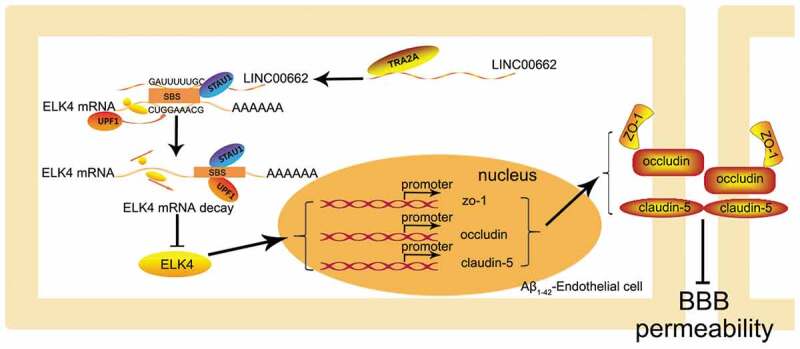
The schematic illusion of interactions between TRA2A, LINC00662 and ELK4 in Aβ1-42-incubated ECs.
Over the past decades, the dysregulation of RBPs and their toxic effects in AD have been extensively studied [34]. For example, ELAV-like RBPs interfere with the mRNA stabilization process. ELAV-like RBPs and the changes in expression of ELAV-like RBPs may be related to AD development [14]. RBPs also play a key role in regulating vascular endothelial function. High RBP-QKI expression in ECs and binding with β-catenin and VE-cadherin mRNA promote the translation of β-catenin and VE-cadherin, which helps to maintain the endothelial barrier function [35]. RBP-MOV10 regulates vascular endothelial function by binding to the circ-DICER1 and increasing circ-DICER1’s expression [36]. RBP-TRA2A belongs to the Transformer2 (TRA2) proteins family and regulates pre-mRNA splicing. It is related to neurodegenerative diseases, tumorigenesis and drug resistance [37–39]. For the first time, we found that TRA2A was elevated in Aβ1-42-incubated ECs. In AD microenvironment, TRA2A knockdown may reduce BBB permeability by increasing expression of ZO-1, occludin, and claudin-5.
LncRNAs play a key role in brain development and neurodegenerative diseases, including epigenetic regulation, transcriptional regulation, post-transcriptional regulation, and translational regulation [19,40]. For instance, lncRNA 17A is increased in the brain tissues of AD patients. It reduces human G-protein-coupled receptor 51 gene (GPR51, GABA B2 receptor) intracellular signalling in SHSY5Y neuroblastoma cells, and promotes Aβ secretion [41]. High expression of lncRNA NDM29 increases Aβ by promoting the molecular processing and secretion of Aβ in AD [42]. It has been proven that lncRNAs regulate vascular endothelial function. In ECs, increases of CCL2 mRNA by lncRNA-CCL2 may promote inflammatory response in endothelial cells [43]. LncRNA-SENCR promotes EC adherents junction integrity through physical association with CKAP4, thereby stabilizing cell membranes [44]. In our study, LINC00662 was found highly expressed in Aβ1-42-incubated ECs. Knocking down of LINC00662 will increase the expression of TJPs, and reduce BBB permeability in AD microenvironment. A similar study shows that LINC00094 increases BBB permeability in AD microenvironment by downregulating the expression of TJPs [11].
In recent years, numerous studies have shown that the interaction of RBPs and non-coding RNAs regulates vascular endothelial function. One of the mechanisms is that RBPs alter the stability of non-coding RNAs and regulate vascular endothelial function. Li and his team have reported that binding of RBP-ZRANB2 and lncRNA-SNHG20 increases SNHG20’s stability, thereby affecting the functions of vascular ECs [19]. There are similar reports about AD. For example, RBP-HuD promotes Aβ by stabilizing the lncRNA-BACE1AS, thereby leading to AD development [45]. Interestingly, we found TRA2A directly bound to LINC00662. In addition, TRA2A increased the expression of LINC00662 by extending its half-life instead of influencing the nascent LINC00662. Similar to our study, Wu et al. [46] have reported that binding of RBP-KHDRBS3 and circRNA-DENND4 C increases the stability of DENND4 C and upregulates the expression of TJPs, thereby reducing the permeability of blood tumour barrier.
ELK4 is a member of Ets transcription factor family and a key regulator of many neurodevelopmental events [47]. For example, ELK4, signalling pathways (DICER1, PKA) and growth factors (CSF3 and BDNF) form the gene networks, and changes in these gene networks affect the expression of sleep and neuronal plasticity genes after sleep deprivation [26]. ELK4, as a cofactor of serum response factor (SRF), may affect cell-dependent SRF binding sites, and SRF controls the maintenance of neurons through the binding site [48]. It was found that ELK4 was less expressed in Aβ1-42-incubated ECs, and ELK4 reduced BBB permeability by upregulating the expression of ZO-1, occludin, and claudin-5 in AD microenvironment. Interestingly, dual-luciferase gene reporter assays and ChIP assays indicated that ELK4 bound to ZO-1, occludin, and claudin-5 promoter directly, thereby inducing its mRNA and protein expression. A conclusion can be drawn that ELK4 transcriptionally promoted TJPs and reduced BBB permeability in AD microenvironment. A similar study shows ELK4 upregulates Mcl-1 and increases its promoter activity by binding to Mcl-1 promoter, thereby reducing the sensitivity of glioma cells to apoptosis [25]. ELK4 is increased in promoter bindings of genes upregulated in peripheral blood mononuclear cells (PBMC) before tumour resection in patients with non-small cell lung cancer (NSCLC). This indicates ELK4 may transcriptionally promote genes that regulate immune system [49].
The mammalian STAU1 mediate degradation of mRNA containing complex secondary structures in their 3ʹ-UTR through a pathway known as SMD pathway. STAU1 recognizes SBSs located sufficiently downstream of a translation termination codon and recruits UPF1 to trigger mRNA decay [50]. Recent researches reveal that SMD pathway is of great significance in neurodevelopment and neurological diseases. For example, KLF4 increases STAU1 recruitment to the 3ʹUTR of neurogenesis-associated mRNAs (Dlx1, Dlx2, Tuj1, Gad67, and NeuN) and promotes the mRNAs degradation through SMD pathway in neurogenesis [51]. In addition, PNRC2 interacts with STAU1 and UPF1, reduces the stability of KLF2 mRNA, and accelerates adipogenesis through SMD pathway [27]. In the SGC7901 and BGC823 cell lines, lncRNA-TINCR reduces the stability of KLF2 mRNA through SMD pathway, affecting the proliferation and apoptosis of gastric cancer cells [52]. Our results show that LINC00662 binds directly to ELK4 3ʹUTR, then recruits STAU1 and to bind with both of them in AD microenvironment. Knockdown of LINC00662, STAU1 and UPF1 can prolong the half-life of ELK4 and improve the stability of ELK4 mRNA in AD microenvironment. The effect of LINC00662 on ELK4 expression is mediated by STAU1. Our study shows for the first time, that LINC00662 may promote the degradation of ELK4 through SMD pathway in Aβ1-42-incubated ECs, thereby increasing the permeability of BBB in AD microenvironment.
5. Conclusions
We studied the endogenous expression levels of TRA2A, LINC00662, and ELK4 in Aβ1-42-incubated ECs. TRA2A bound to LINC00662, and LIN00662 downregulated ELK4 through SMD pathway in AD microenvironment. The knockdown of TRA2A reduces the stability of LINC00662 and subsequently reduces the degradation of ELK4 mRNA through SMD pathway. ELK4 promotes transcription by binding to the ZO-1, occludin, and claudin-5 promoters, further reducing the permeability of BBB in AD microenvironment. More importantly, TRA2A, LINC00662 and ELK4 may play a key role in the treatment of AD. Our study reveals a new mechanism of pathogenesis of AD and introduces a new target for its treatment.
Supplementary Material
Table A1.
Primers used for RT-qPCR.
| Primer or Probe | Gene | Sequence (5ʹ->3ʹ) or Assay ID |
|---|---|---|
| Primer | TRA2A | F: ATACTGGCAGCAGGGCAAAT |
| R: CGCCCAGTTCGCTGATCATA | ||
| LINC00662 | F: GTCCTGCAGGCGTACAACTA | |
| R: CTTCTCGCTAGCAGGTGAGG | ||
| ELK4 | F: GGGTTAGAACTGGCACCCAC | |
| R: GCTGGACTTAGGGGAGCAAC | ||
| GAPDH | F: CGGATTTGGTCGTATTGGG | |
| R: CTGGAAGATGGTGATGGGATT |
Table A2.
shRNA target sequences.
| Gene | Sequence (5ʹ->3ʹ) | |
|---|---|---|
| TRA2A | Sense | CACCGGCCTCAGTTTGTACACAACATTCAAGAGATGTTGTGTACAAACTGAGGCCTTTTTTG |
| Antisense | GATCCAAAAAAGGCCTCAGTTTGTACACAACATCTCTTGAATGTTGTGTACAAACTGAGGCC | |
| LINC00662 | Sense | TGCTAGCGAGAAGATAGCTTGGTTCAAGAGACCAAGCTATCTTCTCGCTAGCTTTTTTC |
| Antisense | TCGAGAAAAAAGCTAGCGAGAAGATAGCTTGGTCTCTTGAACCAAGCTATCTTCTCGCTAGCA | |
| ELK4 | Sense | CACCGGTGACTGTGAAAGTTTAAACTTCAAGAGAGTTTAAACTTTCACAGTCACCTTTTTTG |
| Antisense | GATCCAAAAAAGGTGACTGTGAAAGTTTAAACTCTCTTGAAGTTTAAACTTTCACAGTCACC | |
| UPFI | Sense | CACCGCGAGAAGGACTTCATCATCCTTCAAGAGACGATAACTCCTGAAATCCAGCTTTTTTG |
| Antisense | GATCCAAAAAAGCTGGATTTCAGGAGTTATCGTCTCTTGAAGGATGATGAAGTCCTTCTCGC | |
| STAU1 | Sense | CACCGCCGCAGGGAGTTTGTGATGCTTCAAGAGAGCATCACAAACTCCCTGCGGCTTTTTTG |
| Antisense | GATCCAAAAAAGCCGCAGGGAGTTTGTGATGCTCTCTTGAAGCATCACAAACTCCCTGCGGC |
Table A3.
Primers used for ChIP experiments.
| Gene | Binding site or Control |
Sequence (5ʹ->3ʹ) | Product size (bp) | Annealing temperature (°C) |
|---|---|---|---|---|
| ZO-1 | PCR1 | F: CCAGTGTACTCCCTTTTATGGA | 110 | 51 |
| R: CCTGGAAGCTGAGGGACCTA | ||||
| PCR2 | F: GACTTGCTCTGTCACCCAGG | 204 | 54 | |
|
PCR3 PCR4 |
R: GAGTTCGAGACCAGCCCTG F:TGCCCGGACTGCTTTGAAT R:AACAAAAACGAGACGCTGCC F: GGCAGCGTCTCGTTTTTGTT R: CAGGAGCTCCTTCTCAACCG |
257 111 |
54 52 |
|
| occludin | PCR1 | F: TCCCAGCTACTCAAGAGGCT | 222 | 53 |
|
Claudin-5 |
PCR2 PCR1 PCR2 |
R: GCATGATCACTTGGGCTCCT F: ACACAGTGTTAAGTGCAGACT R: TGGCCTGAGAAAAAGCACCT F: AGGATCCCTTGAGACCAGGA R: TATGCACCACCACCCACCTA F: TACTAGAAAGGGGCTGGTGC R: ACTTGGAGTTTCCTGGCCAG |
207 101 205 |
54 51 57 |
| PCR3 PCR4 |
F: CACACTAGGTGAGCCAGACG R: TCAGTTCCATTGGACAGGGC F:CTGGCCAGGAAACTCCAAGT |
229 115 |
56 53 |
|
| R:GAGACAAAGGGACACGGAGG |
Table A4.
Antibodies for Western blot.
| Primary antibodies: |
| TRA2A (1:500, Abcam, Cambridge, UK), |
| ELK4 (1:200, Santa Cruz Biotechnology, USA), |
| GAPDH (1:10000, Proteintech, USA), |
| ZO-1 (1:500, Life Technologies Corporation, MD, USA), |
| occludin1(1:600, Abcam, Cambridge, UK) |
| claudin-5 (1:300, Life Technologies Corporation, MD, USA). |
| Secondary antibodies: |
| HRP-linked anti-mouse IgG and HRP-linked anti-rabbit IgG antibodies |
Funding Statement
This work is supported by grants from the Natural Science Foundation of China (NO. 81872503, 81872073, 81573010, and 81602725); China Postdoctoral Science Foundation (NO. 2019M661172); Liaoning Science and Technology Plan Project (NO. 2017225020 and 2015225007); Project of Key Laboratory of Neuro-oncology in Liaoning Province (NO. 112-2400017005); and a special developmental project guided by the central government of Liaoning Province (NO. 2017011553-301).
Authors’ Contributions
YXX contributed to the experiment design and implementation, manuscript draft, and data analysis. QSL contributed to the experiment implementation and data analysis. YHL conceived or designed the experiments. QSL, LZ, XBL, and JZ performed the experiments. LZ, XLR, SC, HC and ZL analyzed the data. QSL conceived or designed the experiments, performed the experiments, and wrote the manuscript. All authors read and approved the final manuscript.
Availability of data and materials
Data supporting our findings are found within the manuscript and in the additional files.
Disclosure statement
The authors have declared that no competing interest exists.
Supplementary material
Supplemental data of this article can be accessed here.
References
- [1].Anand R, Gill KD, Mahdi AA.. Therapeutics of Alzheimer’s disease: past, present and future. Neuropharmacology. 2014;76(Pt A):27–50. [DOI] [PubMed] [Google Scholar]
- [2].Gao LB, Yu XF, Chen Q, et al. Alzheimer’s Disease therapeutics: current and future therapies. Minerva Med. 2016;107:108–113. [PubMed] [Google Scholar]
- [3].Yan L, Xie Y, Satyanarayanan SK, et al. Omega-3 polyunsaturated fatty acids promote brain-to-blood clearance of β-Amyloid in a mouse model with Alzheimer’s disease. Brain Behav Immun. 2020;85:35–45. [DOI] [PubMed] [Google Scholar]
- [4].Sweeney MD, Sagare AP, Zlokovic BV. Blood-brain barrier breakdown in Alzheimer disease and other neurodegenerative disorders. Nat Rev Neurol. 2018;14:133–150. [DOI] [PMC free article] [PubMed] [Google Scholar]
- [5].Nation DA, Sweeney MD, Montagne A, et al. Blood-brain barrier breakdown is an early biomarker of human cognitive dysfunction. Nat Med. 2019;25:270–276. [DOI] [PMC free article] [PubMed] [Google Scholar]
- [6].Cardoso FL, Brites D, Brito MA. Looking at the blood-brain barrier: molecular anatomy and possible investigation approaches. Brain Res Rev. 2010;64:328–363. [DOI] [PubMed] [Google Scholar]
- [7].Nakagawa S, Deli MA, Nakao S, et al. Pericytes from brain microvessels strengthen the barrier integrity in primary cultures of rat brain endothelial cells. Cell Mol Neurobiol. 2007;27(6):687–694. [DOI] [PMC free article] [PubMed] [Google Scholar]
- [8].Cai H, Liu W, Xue Y, et al. Roundabout 4 regulates blood-tumor barrier permeability through the modulation of ZO-1, Occludin, and Claudin-5 expression. J Neuropathol Exp Neurol. 2015;74:25–37. [DOI] [PubMed] [Google Scholar]
- [9].Khire TS, Nehilla BJ, Getpreecharsawas J, et al. Finite element modeling to analyze TEER values across silicon nanomembranes. Biomed Microdevices. 2018;20(1):11. [DOI] [PMC free article] [PubMed] [Google Scholar]
- [10].Nag S, Manias JL, Kapadia A, et al. Molecular changes associated with the protective effects of angiopoietin-1 during blood-brain barrier breakdown post-injury. Mol Neurobiol. 2017;54:4232–4242. [DOI] [PubMed] [Google Scholar]
- [11].Zhu L, Lin M, Ma J, et al. The role of LINC00094/miR-224-5p (miR-497-5p)/endophilin-1 axis in memantine mediated protective effects on blood-brain barrier in AD microenvironment. J Cell Mol Med. 2019;23:3280–3292. [DOI] [PMC free article] [PubMed] [Google Scholar]
- [12].Shang S, Yang YM, Zhang H, et al. Intracerebral GM-CSF contributes to transendothelial monocyte migration in APP/PS1 Alzheimer’s disease mice. J Cereb Blood Flow and Metab. 2016;36:1978–1991. [DOI] [PMC free article] [PubMed] [Google Scholar]
- [13].Maziuk B, Ballance HI, Wolozin B. Dysregulation of RNA binding protein aggregation in neurodegenerative disorders. Front Mol Neurosci. 2017;10:89. [DOI] [PMC free article] [PubMed] [Google Scholar]
- [14].Pascale A, Govoni S. The complex world of post-transcriptional mechanisms: is their deregulation a common link for diseases? Focus on ELAV-like RNA-binding proteins. Cell Mol Life Sci. 2012;69:501–517. [DOI] [PMC free article] [PubMed] [Google Scholar]
- [15].Taniuchi S, Miyake M, Tsugawa K, et al. Integrated stress response of vertebrates is regulated by four eIF2α kinases. Sci Rep. 2016;6:32886. [DOI] [PMC free article] [PubMed] [Google Scholar]
- [16].Fontrodona N, Aubé F, Claude JB, et al. Interplay between coding and exonic splicing regulatory sequences. Genome Res. 2019;29:711–722. [DOI] [PMC free article] [PubMed] [Google Scholar]
- [17].Tan Y, Hu X, Deng Y, et al. TRA2A promotes proliferation, migration, invasion and epithelial mesenchymal transition of glioma cells. Brain Res Bull. 2018;143:138–144. [DOI] [PubMed] [Google Scholar]
- [18].Cid-Samper F, Gelabert-Baldrich M, Lang B, et al. An Integrative study of protein-RNA condensates identifies scaffolding RNAs and reveals players in fragile X-associated tremor/ataxia syndrome. Cell Rep. 2018;25:3422–3434.e3427. [DOI] [PMC free article] [PubMed] [Google Scholar]
- [19].Li X, Xue Y, Liu X, et al. ZRANB2/SNHG20/FOXK1 axis regulates vasculogenic mimicry formation in glioma. J Exp Clin Cancer Res. 2019;38:68. [DOI] [PMC free article] [PubMed] [Google Scholar]
- [20].Zhou X, Xu J. Identification of Alzheimer’s disease-associated long noncoding RNAs. Neurobiol Aging. 2015;36:2925–2931. [DOI] [PubMed] [Google Scholar]
- [21].Gong W, Su Y, Liu Y, et al. Long non-coding RNA Linc00662 promotes cell invasion and contributes to cancer stem cell-like phenotypes in lung cancer cells. J Biochem. 2018;164:461–469. [DOI] [PubMed] [Google Scholar]
- [22].Liu Z, Yao Y, Huang S, et al. LINC00662 promotes gastric cancer cell growth by modulating the Hippo-YAP1 pathway. Biochem Biophys Res Commun. 2018;505:843–849. [DOI] [PubMed] [Google Scholar]
- [23].Xie L. MKL1/2 and ELK4 co-regulate distinct serum response factor (SRF) transcription programs in macrophages. BMC Genomics. 2014;15:301. [DOI] [PMC free article] [PubMed] [Google Scholar]
- [24].Fernández-Alvarez A, Soledad Alvarez M, Cucarella C, et al. Characterization of the human insulin-induced gene 2 (INSIG2) promoter: the role of Ets-binding motifs. J Biol Chem. 2010;285:11765–11774. [DOI] [PMC free article] [PubMed] [Google Scholar]
- [25].Day BW, Stringer BW, Spanevello MD, et al. ELK4 neutralization sensitizes glioblastoma to apoptosis through downregulation of the anti-apoptotic protein Mcl-1. Neuro Oncol. 2011;13:1202–1212. [DOI] [PMC free article] [PubMed] [Google Scholar]
- [26].Tinarelli F, Garcia-Garcia C, Nicassio F, et al. Parent-of-origin genetic background affects the transcriptional levels of circadian and neuronal plasticity genes following sleep loss. Philos Trans R Soc Lond B Biol Sci. 2014;369:20120471. [DOI] [PMC free article] [PubMed] [Google Scholar]
- [27].Cho H, Kim KM, Han S, et al. Staufen1-mediated mRNA decay functions in adipogenesis. Mol Cell. 2012;46:495–506. [DOI] [PubMed] [Google Scholar]
- [28].Paul S, Dansithong W, Figueroa KP, et al. Staufen1 links RNA stress granules and autophagy in a model of neurodegeneration. Nat Commun. 2018;9:3648. [DOI] [PMC free article] [PubMed] [Google Scholar]
- [29].Park E, Maquat LE. Staufen-mediated mRNA decay, Wiley interdisciplinary reviews. RNA. 2013;4:423–435. [DOI] [PMC free article] [PubMed] [Google Scholar]
- [30].Liu W, Wang P, Shang C, et al. Endophilin-1 regulates blood-brain barrier permeability by controlling ZO-1 and occludin expression via the EGFR-ERK1/2 pathway. Brain Res. 2014;1573:17–26. [DOI] [PubMed] [Google Scholar]
- [31].Su R, Cao S, Ma J, et al. Knockdown of SOX2OT inhibits the malignant biological behaviors of glioblastoma stem cells via up-regulating the expression of miR-194-5p and miR-122. Mol Cancer. 2017;16:171. [DOI] [PMC free article] [PubMed] [Google Scholar]
- [32].Hue CD, Cho FS, Cao S, et al. Dexamethasone potentiates in vitro blood-brain barrier recovery after primary blast injury by glucocorticoid receptor-mediated upregulation of ZO-1 tight junction protein. J Cereb Blood Flow Metab. 2015;35:1191–1198. [DOI] [PMC free article] [PubMed] [Google Scholar]
- [33].Liu X, Zheng J, Xue Y, et al. PIWIL3/OIP5-AS1/miR-367-3p/CEBPA feedback loop regulates the biological behavior of glioma cells. Theranostics. 2018;8:1084–1105. [DOI] [PMC free article] [PubMed] [Google Scholar]
- [34].Ricciarelli R, Fedele E. The amyloid cascade hypothesis in alzheimer’s disease: it’s time to change our mind. Curr Neuropharmacol. 2017;15:926–935. [DOI] [PMC free article] [PubMed] [Google Scholar]
- [35].de Bruin RG, van der Veer EP, Prins J, et al. The RNA-binding protein quaking maintains endothelial barrier function and affects VE-cadherin and β-catenin protein expression. Sci Rep. 2016;6:21643. [DOI] [PMC free article] [PubMed] [Google Scholar]
- [36].He Q, Zhao L, Liu X, et al. MOV10 binding circ-DICER1 regulates the angiogenesis of glioma via miR-103a-3p/miR-382-5p mediated ZIC4 expression change. J Exp Clin Cancer Res. 2019;38:9. [DOI] [PMC free article] [PubMed] [Google Scholar]
- [37].Liu Y, Nie H, Liu C, et al. Angulin proteins ILDR1 and ILDR2 regulate alternative pre-mRNA splicing through binding to splicing factors TRA2A, TRA2B, or SRSF1. Sci Rep. 2017;7:7466. [DOI] [PMC free article] [PubMed] [Google Scholar]
- [38].Liu T, Sun H, Zhu D, et al. TRA2A promoted paclitaxel resistance and tumor progression in triple-negative breast cancers via regulating alternative splicing. Mol Cancer Ther. 2017;16:1377–1388. [DOI] [PubMed] [Google Scholar]
- [39].Cid-Samper F, Gelabert-Baldrich M, Lang B, et al. An integrative study of protein-RNA condensates identifies scaffolding RNAs and reveals players in fragile X-associated tremor/ataxia syndrome. Cell Rep. 2018;25. DOI: 10.1016/j.celrep.2018.11.076 [DOI] [PMC free article] [PubMed] [Google Scholar]
- [40].Wu P, Zuo X, Deng H, et al. Roles of long noncoding RNAs in brain development, functional diversification and neurodegenerative diseases. Brain Res Bull. 2013;97:69–80. [DOI] [PubMed] [Google Scholar]
- [41].Massone S, Vassallo I, Fiorino G, et al. 17A, a novel non-coding RNA, regulates GABA B alternative splicing and signaling in response to inflammatory stimuli and in Alzheimer disease. Neurobiol Dis. 2011;41:308–317. [DOI] [PubMed] [Google Scholar]
- [42].Massone S, Ciarlo E, Vella S, et al. NDM29, a RNA polymerase III-dependent non coding RNA, promotes amyloidogenic processing of APP and amyloid beta secretion. Biochim Biophys Acta. 2012;1823:1170–1177. [DOI] [PubMed] [Google Scholar]
- [43].Khyzha N, Khor M, DiStefano PV, et al., Regulation of expression in human vascular endothelial cells by a neighboring divergently transcribed long noncoding RNA. Proc Natl Acad Sci U S A, 2019;116:16410–16419. [DOI] [PMC free article] [PubMed] [Google Scholar]
- [44].Lyu Q, Xu S, Lyu Y, et al. stabilizes vascular endothelial cell adherens junctions through interaction with CKAP4. Proc Natl Acad Sci U S A. 2019;116:546–555. [DOI] [PMC free article] [PubMed] [Google Scholar]
- [45].Kang MJ, Abdelmohsen K, Hutchison ER, et al. HuD regulates coding and noncoding RNA to induce APP→Aβ processing. Cell Rep. 2014;7:1401–1409. [DOI] [PMC free article] [PubMed] [Google Scholar]
- [46].Wu P, Gao Y, Shen S, et al. KHDRBS3 regulates the permeability of blood-tumor barrier via cDENND4C/miR-577 axis. Cell Death Dis. 2019;10:536. [DOI] [PMC free article] [PubMed] [Google Scholar]
- [47].Bestman JE, Huang LC, Lee-Osbourne J, et al. An in vivo screen to identify candidate neurogenic genes in the developing Xenopus visual system. Dev Biol. 2015;408:269–291. [DOI] [PMC free article] [PubMed] [Google Scholar]
- [48].Cooper SJ, Trinklein ND, Nguyen L, et al. Serum response factor binding sites differ in three human cell types. Genome Res. 2007;17:136–144. [DOI] [PMC free article] [PubMed] [Google Scholar]
- [49].Kossenkov AV, Vachani A, Chang C, et al. Resection of non-small cell lung cancers reverses tumor-induced gene expression changes in the peripheral immune system. Clin Cancer Res off J Am Assoc Cancer Res. 2011;17:5867–5877. [DOI] [PMC free article] [PubMed] [Google Scholar]
- [50].Kim YK, Furic L, Desgroseillers L, et al. Mammalian Staufen1 recruits Upf1 to specific mRNA 3ʹUTRs so as to elicit mRNA decay. Cell. 2005;120:195–208. [DOI] [PubMed] [Google Scholar]
- [51].Moon BS, Bai J, Cai M, et al. Kruppel-like factor 4-dependent Staufen1-mediated mRNA decay regulates cortical neurogenesis. Nat Commun. 2018;9:401. [DOI] [PMC free article] [PubMed] [Google Scholar]
- [52].Xu TP, Liu XX, Xia R, et al. SP1-induced upregulation of the long noncoding RNA TINCR regulates cell proliferation and apoptosis by affecting KLF2 mRNA stability in gastric cancer. Oncogene. 2015;34:5648–5661. [DOI] [PubMed] [Google Scholar]
Associated Data
This section collects any data citations, data availability statements, or supplementary materials included in this article.
Supplementary Materials
Data Availability Statement
Data supporting our findings are found within the manuscript and in the additional files.