Abstract
Monoclonal antibodies (mAbs) against B cell antigens have been extensively used in the treatment of rheumatoid arthritis (RA). The B cell depletion therapy prevents RA symptoms and/or alleviates existing inflammation. We have applied the previously established two-step drug-free macromolecular therapeutics (DFMT) in the treatment of collagen-induced rheumatoid arthritis in a collagen-induced rheumatoid arthritis mouse model. DFMT is a B cell depletion strategy utilizing Fab’ fragment of anti-CD20 mAb for biorecognition and receptor crosslinking to induce B cell apoptosis. DFMT is composed from two nanoconjugates: 1) bispecific engager, Fab’-MORF1 (anti-CD20 Fab’ fragment conjugated with morpholino oligonucleotide MORF1), and 2) a crosslinking (effector) component P-(MORF2)X (N-(2-hydroxypropyl)methacrylamide (HPMA) copolymer grafted with multiple copies of complementary morpholino oligonucleotide MORF2). The absence of Fc fragment has the potential to avoid development of resistance and infusion-related reactions. DFMT produced B cell depletion, kept the RA score low for more than 100 days, and showed minimal cartilage and bone erosion and inflammatory cell infiltration. Further improvements will be explored to optimize DFMT strategy in autoimmune disease treatment.
Keywords: drug-free macromolecular therapeutics, rheumatoid arthritis, collagen-induced arthritis, B cell depletion, CD20
Graphical Aabstract
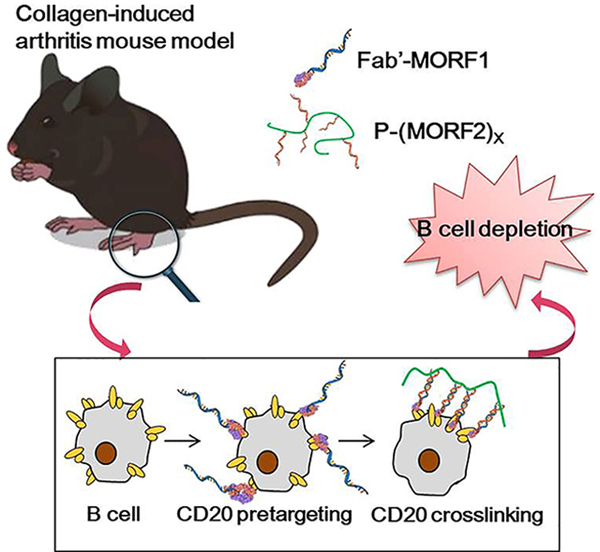
The drug-free macromolecular therapeutics (DFMT) has been applied in collagen-induced rheumatoid arthritis mouse model as a B cell depletion strategy. The antibody derived Fab’-MORF1 pre-targets CD20 receptor on B cell surface. Polymer-based P-(MORF2)X induces crosslink of CD20 receptor via MORF1/MORF2 hybridization to activate apoptosis pathway, leading to B cell death. DFMT achieves significant efficacy in inhibiting rheumatoid arthritis progression.
1. Introduction
Rheumatoid arthritis (RA) is one of the most common systemic autoimmune diseases. It affects about 1% of the population. More women are involved compared to men.[1] Symptoms like fever and malaise are usually companied with synovial inflammation caused by cartilage destruction, bone erosion and joint deformities. [1] Traditional therapeutic approaches for RA treatment involve non-steroidal anti-inflammatory drugs (NSAID)s, such as non-selective inhibitors of cyclooxygenase-1 (COX-1) and cyclooxygenase-2 (COX-2)[2], disease-modifying anti-rheumatic drugs (DMARD)s, such as methotrexate and TNF-α inhibitors, and drugs targeting receptors overexpressed on macrophage.[3–5] In experimental animal models the enhanced efficacy of macromolecular prodrugs, such as glucocorticoid-containing water-soluble polymers, polymer micelles, and liposomes has been demonstrated.[6–8]
There is solid scientific evidence indicating the important role of B lymphocytes in the pathogenesis of RA.[9,10] B cells impact RA through autoantibody dependent as well as independent functions.[11] B cells perform as antigen presenting cells, discharge pro-inflammatory cytokines (including TNF-α), produce rheumatoid factor (RF) and other autoantibodies, and activate T cells.[12] In 2001 Edwards and Cambridge postulated the hypothesis that B lymphocyte depletion might lead to long-term remission in RA patients. First treatment of five patients with rituximab (RTX) indicated the importance of B-lymphocytes in RA and suggested that B cell depletion could be a safe and efficient therapy.[13] At present B cell depletion therapy is one of the important RA treatments. It has proven efficacy for advanced disease, particularly in those patients that do not respond to DMARDs or TNF-α inhibitors.[14] In addition to RTX (anti-CD20),[12,15] anti-CD19 and anti-CD22 therapies are efficient in the treatment of autoimmune diseases.[11,16]
RTX, a chimeric (mouse/human) IgG1κ monoclonal antibody against CD20 on B cell surface, was approved by FDA in 2006 to treat RA in combination with methotrexate patients who don’t respond to anti-TNF-α therapy.[17] CD20 is also expressed on normal B-cells; however, it is not expressed on stem cells or progenitor cells and mature or activated plasma cells.[18] Therefore, the “B-cell depletion” therapeutic approach is considered safe; normal numbers of B-cells can be restored after treatment.[19]
The therapeutic efficacy of anti-CD20 mAbs is ascribed to three cellular events: antibody-dependent cellular cytotoxicity (ADCC), complement-dependent cytotoxicity (CDC), and CD20-mediated apoptosis.[20] All of these mechanisms require immune effector cells to function.[21] Notably, RF binding to Fc fragment blocks CDC-mediated B cell death and potentially blocks ADCC as well, thus compromising the effectiveness of RTX in B cell depletion.[22] This implication could be potentially extended beyond RTX to any antibody-based therapeutic in RA as RF binds to the Fc portion of IgG.[23] Furthermore, association between Fc fragment and Fc gamma receptor (FcγR) triggers effector functions leading to infusion related reactions,[24] rare progressive multifocal leukoencephalopathy (PML),[25] and RTX-associated lung injury (RALI).[26] In addition, resistance to RTX in RA patients has been observed.[15] Internalization of RTX contributes to the intrinsic resistance. It can be inhibited by blocking FcγRIIb, indicating absence of Fc fragment can help reduce resistance to therapeutic antibody.[27] Due to the murine-derived sequences in RTX, 11% of patients treated with RTX were reported to develop human anti-chimeric antibodies (HACAs).[28]
We have developed drug-free macromolecular therapeutics (DFMT), which is a new paradigm for B cell depletion strategy.[29,30] Apoptosis is initiated by the biorecognition of complementary oligonucleotide motifs at the cell surface resulting in crosslinking of CD20 receptors. DFMT is composed from two nanoconjugates: 1) bispecific engager, Fab’-MORF1 (anti-CD20 Fab’ fragment conjugated with morpholino oligonucleotide), and 2) a crosslinking (effector) component P-(MORF2)X (N-(2-hydroxypropyl)methacrylamide (HPMA) copolymer or human serum albumin grafted with multiple copies of complementary morpholino oligonucleotide). Hybridization MORF1/MORF2 results in CD20 crosslinking, translocation of the CD20 complexes to lipid rafts, calcium influx, mitochondrial depolarization and apoptosis induction, leading to B cell death. This strategy has been evaluated in Raji B cells in vitro, in non-Hodgkin lymphoma animal models in vivo, and in patient cells with a variety of B cell malignancies.[31–34] The absence of the Fc fragment prevents Fc-FcγR association and decreases the early internalization of the CD20-Ab complex avoiding one form of RTX resistance.[35,36] In addition, side effects observed with RTX administration can be avoided with DFMT.
To evaluate the efficacy of DFMT a suitable animal model and mouse anti-CD20 antibodies are needed (RTX does not cross react with mouse CD20). It is important to choose an animal model, which has higher morphological similarities to human disease as well as the ability to predict efficacy in humans. Collagen-induced arthritis (CIA) is major histocompatibility complex (MHC) dependent and mediated by both T and B cells.[37] Compared to rat CIA model, mouse CIA has a slower onset as well as a more prolonged duration.[38] In addition, there are more genetic and immunological tools to manipulate the disease in mouse.[39] Thus mouse CIA was selected as animal model in our study. Chick type II collagen was used to induce RA and DBA/1J mice were used as CIA models.[40]
In this study, the therapeutic efficacy of DFMT as an innovative B cell depletion strategy in CIA mouse model was evaluated. To target mouse B cells, anti-CD20 Fab’-MORF1 conjugate (derived from 18B12 mAb, Biogen) was used, followed by receptor crosslinking mediated by HPMA-based P-(MORF2)X . The outcome was evaluated by RA score, B cell depletion analysis in blood and selected tissues, micro-CT analysis of bone structure, and histology evaluation. Administration of the whole Ab served as control.
2. Experimental Section
2.1. Materials and Mice
Mouse CD20-specific mAb 18B12 (IgG2a) was obtained from Biogen. Its therapeutic efficacy has been proved in spontaneous autoimmune thyroiditis[41] and proteoglycan-induced arthritis[42]. Chick type II collagen (2 mg ml−1, catalog# 20012), complete Freud’s adjuvant (CFA) containing 2 mg ml−1heat-killed Mycobacterium tuberculosis (H37Ra) and incomplete Freud’s adjuvant (IFA) were obtained from Condrex (Redmond, NE). The two complementary morpholino oligomers MORF1 (5’-GAGTAAGCCAAGGAGAATCAATATA-3’, MW = 8630.5 Da) and MORF2 (5’-TATATTGATTCTCCTTGGCTTACTC-3’, MW = 8438.5 Da) were from Gene Tools, LLC (Philomath, OR). Cy5.5-N-hydroxysuccinimide ester (Cy5.5-NHS) was from Lumiprobe. N-(3-Aminopropyl)methacrylamide (APMA) was from Polysciences, N-(2-hydroxypropyl)methacrylamide (HPMA) was synthesized as previously described.[43] 4,4’-azobiscyanovaleric acid (V501; Waco Chemicals) was used as the initiator and 4-cyanopentanoic acid dithiobenzoate (CPDB) as the chain transfer agent. Male DBA/1J (DBA) mice (8–12 week old) were purchased from The Jackson Laboratory.
2.2. Synthesis and Characterizations
2.2.1. Synthesis and Characterization of Fab’-MORF1
The 18B12 mAb was used to produce Fab’ for synthesis of Fab’-MORF1. Preparation of Fab’ from mAb followed an established procedure[32] with adjustment (Scheme 1A). Briefly, 18B12 mAb was digested into F(ab’)2 with 10% (w/w) pepsin (Sigma) in citric buffer (pH 4.0). This reaction was performed at 37 °C water bath for 60 min. Immediately before conjugation, F(ab’)2 was reduced to Fab’-SH by 20 mM tris(2-carboxyethyl)phosphine (TCEP, ThermoFisher Scientific) at 37 °C for 180 min. To prepare the Fab’-MORF1 conjugate, the MORF1 oligo with a 3’-primary amine was reacted with succinimidyl-[(N-maleimidopropionamido)-diethyleneglycol] ester (SM(PEG)2), ThermoFisher Scientific) to introduce a terminal maleimide group (MORF1-mal). The latter was conjugated to Fab’-SH via a thioether bond to achieve Fab’-MORF1. The condition for this reaction was 3 h at room temperature in pH 6.5 PBS (phosphate buffered saline).
Scheme 1.
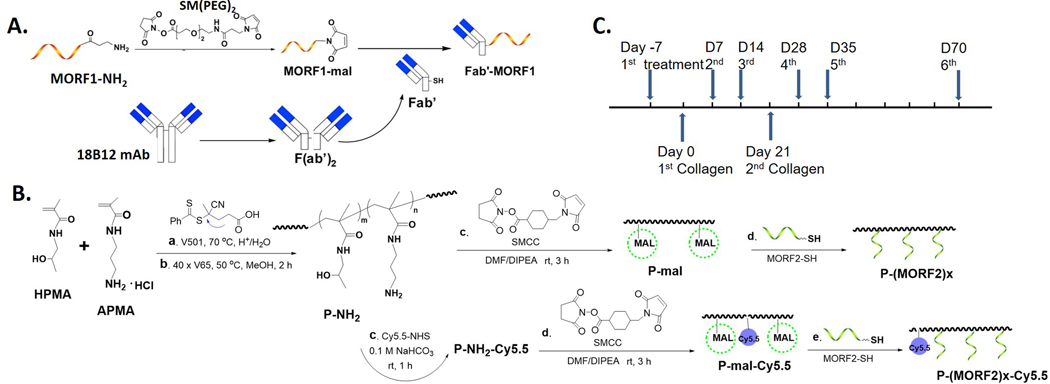
Design of bioconjugates and treatment regimen. A. Synthesis scheme of Fab’-MORF1; B. Synthesis scheme of P-(MORF2)X and P-Cy5.5-(MORF2)X; C. Collagen immunization and treatment schedule.
2.2.2. Synthesis and Characterization of P-(MORF2)X and P-Cy5.5-(MORF2)X
The multivalent P-(MORF2)X conjugate was synthesized as previously described.[36] The polymer precursor P-NH2 was synthesized by reversible addition-fragmentation chain transfer (RAFT) copolymerization of HPMA with APMA. Content of primary amine was determined by ninhydrin test. A labeling dye Cy5.5 was optionally added for imaging studies by the reaction of Cy5.5-NHS (N-hydroxysuccinimide ester) with primary amines on polymer precursor. Then the maleimide groups were introduced by the reaction with succinimidyl 4-(N-maleimidomethyl)cyclohexane-1-carboxylate (SMCC) for the conjugation with thiol-derived MORF2 (Scheme 1B). Modified Ellman’s assay was used to quantify maleimide content. Valence of MORF2 was determined by UV-vis spectrophotometry. More details of synthesis and characterization are included in the Supporting Information (SI).
2.3. Induction of Rheumatoid Arthritis and Treatment
Collagen-induced arthritis was initiated in 8–12 weeks old male DBA/1J mice, which show a high incidence of disease after collagen immunization.[44] Chick type II collagen (2 mg ml−1) was emulsified with an equal volume of CFA containing 2 mg ml−1 heat-killed Mycobacterium tuberculosis (H37Ra). Each mouse was injected with 100 μl emulsion (containing 100 μg collagen) subcutaneously (s.c.) into the base of the tail. Mice were boosted s.c. with collagen (100 μg) emulsified in IFA on day 21. For 18B12 mAb treated group, 250 μg (1.7 nmol) mAb in 200 μl saline was injected to mouse tail vein. To maintain consistent Fab’ administration amount, 3.4 nmol MORF equivalent of Fab’-MORF1 and P-(MORF2)9.4 were i.v. injected to mouse tail vein with 5 h interval (Fab’-MORF1 first, 5 h later P-(MORF2)9.4). Scheme 1C shows the timeline for 2 doses of collagen immunization and 6 doses of treatments.
2.4. Monitoring of Arthritis
Mice were closely monitored twice a week for arthritis severity and bodyweight. The arthritis score was recorded for each paw: 0, normal; 1, swelling in one joint; 2, swelling in more than one joint; 3, swelling of the entire paw; 4, deformity and/or ankyloses.[45] Then the score for one mouse is the sum of the scores for each paw.
2.5. Live Imaging to Track Polymer Distribution
Mice were injected with 4 nmol Cy5.5 equivalent concentration of different treatments (free dye Cy5.5, P-Cy5.5-(MORF2)8.9 and DFMT). At selected time points (0.5 h, 2 h, 4 h, 6 h, 8 h and 24 h), mice were imaged with In Vivo Imaging System (IVIS) Spectrum (Caliper LifeSciences) with exposure time of 1 min.
2.6. Flow Cytometry Analysis for B Cell Depletion Rate
Once mice were euthanized, blood and organs were excised (spleen, bone marrow and lymph nodes). Blood was collected from mouse eyeball and placed in anti-coagulant coated tubes. After red blood cell removal, the white fluffy layer above blood cells was collected. Totally six lymph nodes were collected for each mouse including axillary, brachial and inguinal ones on both sides of mouse. For spleen/lymph nodes, organs were minced and filtered using cell strainer; for bone marrow, PBS was used to flush cells out of the femurs followed by filtration by cell strainer. Collected cells were treated twice with red blood cell lysing buffer (0.5 ml for 10 min at room temperature) and centrifuged to remove red blood cells in cell mixture. Then cells were fixed with 4% paraformaldehyde at room temperature for 20 min. After washes with PBS, cells were stored at 4 °C. When all the mice were sacrificed, a part of the fixed cells were stained with anti-B220-FITC (0.5 μg/test) and anti-IgM-PE Cy7 (0.125 μg/test) at 4 °C for 60 min. After three-time wash with PBS, cells were analyzed with flow cytometry with channels of BluFL1 and BluFL4. The data were collected with DxP Athena™ Flow Cytometry System (Cytek Biosciences, Fremont, CA).
2.7. Micro-CT Analysis of Bone Structure
Fore limbs and hind limbs were dissected from sacrificed mice and micro-CT imaging was performed. Micro-CT images were acquired on the Quantum GX2 microCT Imaging System (PerkinElmer, Waltham, MA). CT image sets acquisitions lasted 4 min and utilized beam parameters of 88 μA and 90 kV with X-ray filter of Cu 0.06 + Al 0.5.
2.8. Joint Tissue Histological Evaluation
Both fore limbs (including wrist joints) and hind limbs (including ankle and knee joints) were fixed for 48 h in 10% neutral buffered formalin. Then the tissues were washed with PBS three times and stored in 70% ethanol at 4 °C. The specimens were processed for paraffin embedding. Tissue sections (5 μm) were stained with hematoxylin and eosin (H&E) for microscopic evaluation.
2.9. Statistical Analysis
All experiments were conducted in duplicate or triplicate, depending on the number of cells available. Data are presented as mean ± standard deviation (SD). Differences were considered significant for P values < 0.05 using the Student’s t test or One-way ANOVA with Tukey’s post-hoc test.
3. Results
3.1. Synthesis and Characterization of Nanoconstructs
To prepare the Fab’-MORF1 conjugate, a mouse anti-CD20 IgG2a mAb 18B12 was digested to F(ab)2 followed by reduction to Fab’ fragment. The Fab’ fragment was tied to 3’ end of MORF1 via a thioether bond. Each step was confirmed by size exclusion chromatography (SEC) (Figure 1A). Bicinchoninic acid (BCA) assay and UV-vis spectrophotometry were used to quantify Fab’ and MORF1 content, respectively. In the final product, the ratio of MORF1 to Fab’ was 1.1 to 1. Polymer precursor P-NH2 was prepared via RAFT copolymerization of HPMA with APMA. The content of primary amine groups was 366 nmol/mg, determined by ninhydrin test. After optional Cy5.5 labeling and maleimide group modification, P-mal was conjugated to MORF2 via maleimide-thiol reaction. Modified Ellman’s assay was used to determine maleimide content in polymer, which is 276 nmol/mg. Backbone molecular weight and polydispersity index were determined by SEC (Figure 1B). Valence of MORF2 was determined by UV-visible spectroscopy. The number average molecular weight (Mn) of polymer precursor was 87.2 kDa with polydispersity (PDI) of 1.14. Valence of P-(MORF2)X was 9.4, valence of P-Cy5.5-(MORF2)X was 8.9.
Figure 1.

Characterizations of Fab’-MORF1 and P-(MORF2)X with size exclusion chromatography AKTA FPLC. Superdex 200 10/300 GL column (GE Healthcare) eluted with phosphate buffered saline (PBS, pH 7.2) at flow rate of 0.4 ml min−1 was used for Fab’-MORF1 characterization. Superose 6 HR10/30 column with sodium acetate buffer containing 30% acetonitrile (pH6.5) at flow rate of 0.4 ml min−1 was used for P-(MORF2)X characterization. A. Full antibody was digested to F(ab’)2 (green) followed by reduction to obtain Fab’(red). Target peak shifted back after Fab’ conjugated with MORF1 (blue); B. Polymer peak shifted significantly after MORF2 conjugation (green).
3.2. Record of RA Score
Predominantly, RA starts as a tenacious state of cell activation, leading to autoimmunity and immune complexes in joints and other involved organs. The synovial membrane is regarded as the initial site of RA where immune cells infiltration allowed by swelling and congestion.[2] Once initiated, the disease becomes permanent and chronic. The synovial tissues throughout the body achieve a higher level of T cells, B cells, macrophages, and synovial cells interacting in a complexed way. The resultant proliferation of the synovial tissues (synovitis) leads to the excessive production of synovial fluid and the infiltration of pannus into adjacent bone and cartilage. Synovitis causes cartilage destruction, bone erosion, joint capsule as well as tendons and ligaments raptures.[46]
Male DBA/1J mice of 8–12 week old were used to evaluate the effects of DFMT treatment on the B cell depletion efficacy in vivo. Mice received 6 doses of treatment on days −7, 7, 14, 28, 35 and 70. Collagen immunizations were performed on days 0 and 21. The treatment started seven days prior to collagen immunization as literature indicated that RA progress would not be inhibited effectively when treatement started with collagen immunization at day 0.[40] Mice bodyweight and RA score were recorded twice a week. The increasing bodyweight tendency (Figure 2A) of DFMT and 18B12 mAb treatment groups indicated no observed toxic effects were induced by the treatments. Mice were monitored for arthritis development and evaluated with the described RA score system (Figure 2B). Mice treated with saline developed arthritis fast after the second collagen immunization. Joint inflammation was first observed in saline treated mice group at day 24, while in the mice groups treated with DFMT and 18B12 mAb, joint inflammation was observed on day 35. Besides the delayed arthritis onset, the growth rates of RA scores in DFMT and 18B12 mAb treated group were nearly flat, indicating suppresive effect on RA progression.
Figure 2.
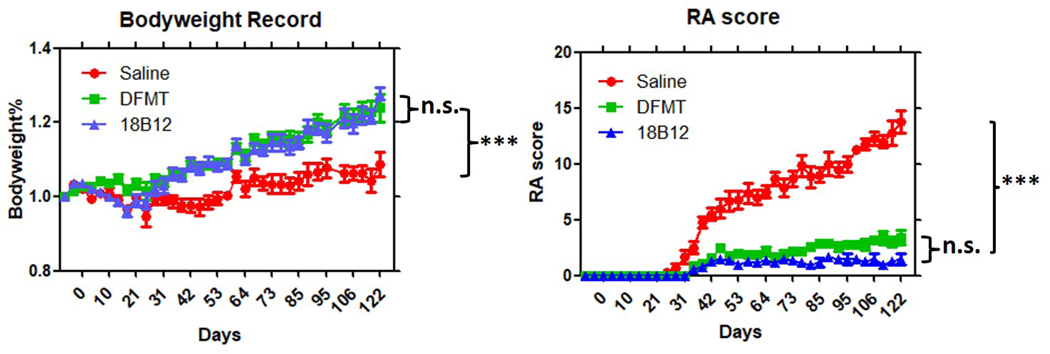
Observational records for bodyweight and RA score. A. Mice bodyweight in booth of DFMT and 18B12 groups showed increase along with RA progress. B. DFMT showed significant effect in inhibiting RA progress, similar to 18B12 treatment. Stastistics: one-way ANOVA plus Tukey’s post-hoc test (P < 0.001 = ***, not significant = n.s.)
3.3. B Cell Depletion Analysis
Mature B cell depletion in spleen, lymph nodes, bone marrow and blood was evaluated by flow cytometry. The measurements were performed at days −4, 0, 30, 60, 90 and 120. At each time point, 2 mice from each treatment group were sacrificed to harvest tissues/organs. After filtration and red blood cell removal, collected cells were stained with IgM-PeCy7 and B220-FITC simultaneously. IgM+B220high represented the mature B cell population.[47] Taking B cell depletion at day 60 as an example (Figure 3), five doses have been given at this time point. DFMT achieved statistically similar B cell depletion rate compared to 18B12 mAb. In bone marrow cell samples, IgM-B220low population represented pro-B cells, which have low CD20 expression. In blood samples, DFMT showed a higher remaining mature B cell rate than 18B12 mAb treatment. However, the mature B cell percentage was significantly reduced compared to control group. Detailed flow cytometry results for B cell depletion efficacy at other time points are included in SI (Figures S1-S5).
Figure 3. Mature B cell percentage in tissues collected on day 60.

Spleen, lymph nodes, bone marrow and blood were collected for cell staining followed by flow cytometry to determine mature B cell percentage. At this time point DFMT showed comparable depletion rate with full antibody in spleen, lymph nodes and bone marrow.
All flow data collected for different tissues/organs at different time points were analyzed regarding mature B cell percentage using saline treated group as standard. The normalized data (Figure 4) show B cell depletion tendency in spleen, lymph nodes, bone marrow and blood during the evaluation period (120 days). In the spleen, the highest B cell depletion levels were obtained at day 30 in both treatment groups. DFMT treated mice showed steadily increasing mature B cells in spleen since day 30. Eventually 40% of mature B cells were depleted in DFMT treated group while 80% of mature B cells were removed with 18B12 mAb treatment at day 120 in the spleen (Figure 4A). DFMT treatment achieved peak B cell depletion (70%) at day 60 in lymph nodes and experienced B cell recovery while 18B12 mAb treatment maintained a low B cell level with 90% depletion (Figure 4B). While DFMT treatment showed a lower B cell depletion than 18B12 mAb in spleen and lymph nodes, similar therapeutic efficacy was achieved with those two treatments in bone marrow and blood. The flow cytometry results show comparable fluctuation in B cell depletion curves for DFMT and 18B12 mAb treatments with cells collected from bone marrow and blood, respectively (Figure 4C and 4D). DFMT treatment depleted 25% mature B cells while 18B12 mAb diminished 45% mature B cells at day 120 in bone marrow. In blood cell samples (Figure 4D), mature B cell depletion could be observed in DFMT treatment group at day −4 (3 days after first treatment injection) with a depletion of 20%. At day 0 (7 days after first treatment injection), depletion of mature B cells in both of DFMT treated and 18B12 mAb treated groups reached 45%. Four treatments have been administered on day 30 when mice were sacrificed for B cell quantification. In the 18B12 mAb treated group 73% mature B cells were depleted at day 30 while the depletion level in DFMT treated group was 50%. Since day 30, mature B cell level recovered slowly both in DFMT and 18B12 mAb treated groups regardless of two more doses at days 35 and 70. At day 120, mature B cells depletion levels in blood in DFMT and 18B12 mAb treated groups reached similar values of about 50%.
Figure 4.
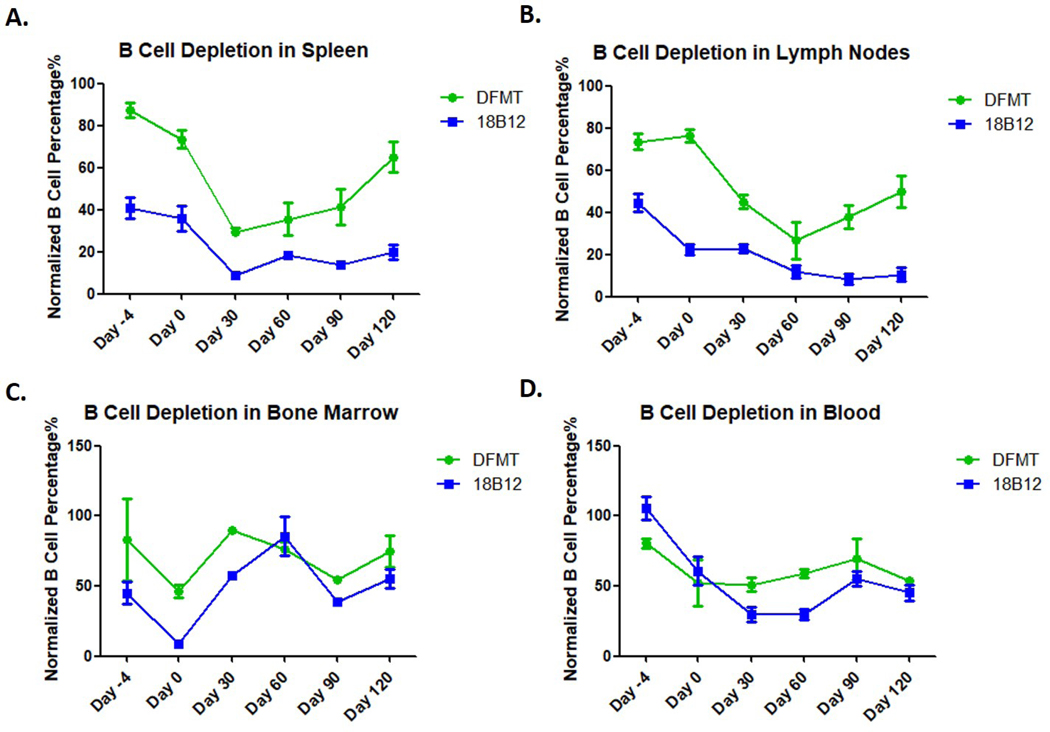
Normalized B cell percentage in spleen, lymph nodes, bone marrow and blood. B cell percentages in saline groups were used as 100% to evaluate the B cell level by DFMT and 18B12 mAb treatments.
Multiple doses of DFMT treatments have demonstrated to have the ability to deplete mature B cells in spleen, lymph nodes and blood in this four-month experiment. In cell samples from spleen and lymph nodes, it appears that mice group treated with DFMT showed a faster B cell recovery compared to 18B12 mAb treatment. In bone marrow cell samples, DFMT treatment showed a slight B cell depletion effect at the end of this study (~25% mature B cell depletion). Compared to DFMT, 18B12 mAb treatment showed a better B cell depletion rate until Day 30, but later experienced a considerable B cell recovery and produced a comparable B cell depletion level as DFMT at day 120. Both, DFMT and 18B12 mAb treatments showed a similar trend in depleting B cells in blood across the experiment term. Taken together, the results from Figures 3 and 4 demonstrate the potential of DFMT to be utilized as a B cell depletion strategy. However, optimization of administration regimen and nanostructure need to be explored to enhance therapeutic efficacy.
3.4. Pre-Targeting Enhances Polymer Accumulation
P-Cy5.5-(MORF2)8.9 was administered to DBA/1J mice by i.v. injection 5 h after Fab’-MORF1 administration. Free dye Cy5.5 and P-Cy5.5-(MORF2)8.9 alone were injected as control groups. At selected time points (0.5, 2, 4, 6, 8, and 24 h), DFMT treated group, with Fab’-MORF1 B cells pre-targeting, showed enhanced fluorescence intensity in joint area compared to P-Cy5.5-(MORF2)8.9 administrated alone (Figure 5A). Hind limbs of mice were selected as region of interest (ROI) and the IVIS Lumina LivingImage software was employed to analyze the fluorescence intensities quantitatively. Mice in DFMT treated group demonstrated highest accumulation (Figure 5B). According to our previous study, the terminal plasma half-time of Fab’-MORF1 is around 5 h at which point the concentration of Fab’-MORF1 reached a plateau.[31] Thus we chose a 5 h interval between Fab’-MORF1 and P-Cy5.5-(MORF2)8.9 administrations, to benefit from the pre-targeting effect as, at that time most of unbound Fab’-MORF1 was either eliminated from blood or internalized and degraded in the lysosomes if bound off target.
Figure 5.
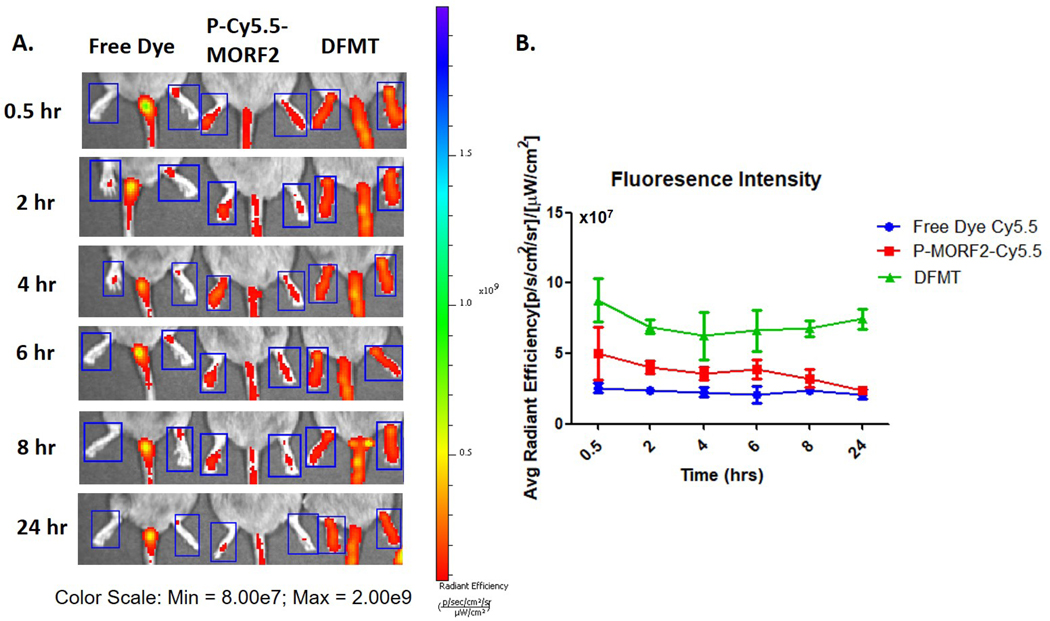
Accumulation of bioconjugates in ankle joints. A. Fluorescence imaging of Cy5.5. DFMT treatment: P-Cy5.5-(MORF2)8.9 was injected 5 h after Fab’-MORF1 injection. B. Average fluorescence intensity calculated by IVIS software for different treatment groups.
3.5. Micro-CT Analysis of Bone Structure
Inflammatory reactions in RA lead to structural damages such as soft tissue inflammation, joint space narrowing, cartilage degradation and bone erosion.[48] Micro-computed tomography (CT) is a suitable technique to detect bone erosion in small animal RA models because of high sensitivity and accuracy.[49,50] In the saline treated group mouse wrist and digit joints exhibited bone and cartilage erosion as well as irregular bone surface architecture. Additionally, gross bone loss and deformity in knee joints and erosion in ankle joints was observed (Figure 6). In contrast, joints in DFMT and 18B12 mAb treated groups exhibited smooth bone surface and relatively intact joints structure. No significant difference was observed between DFMT treated and 18B12 mAb treated groups (Figure 6).
Figure 6.
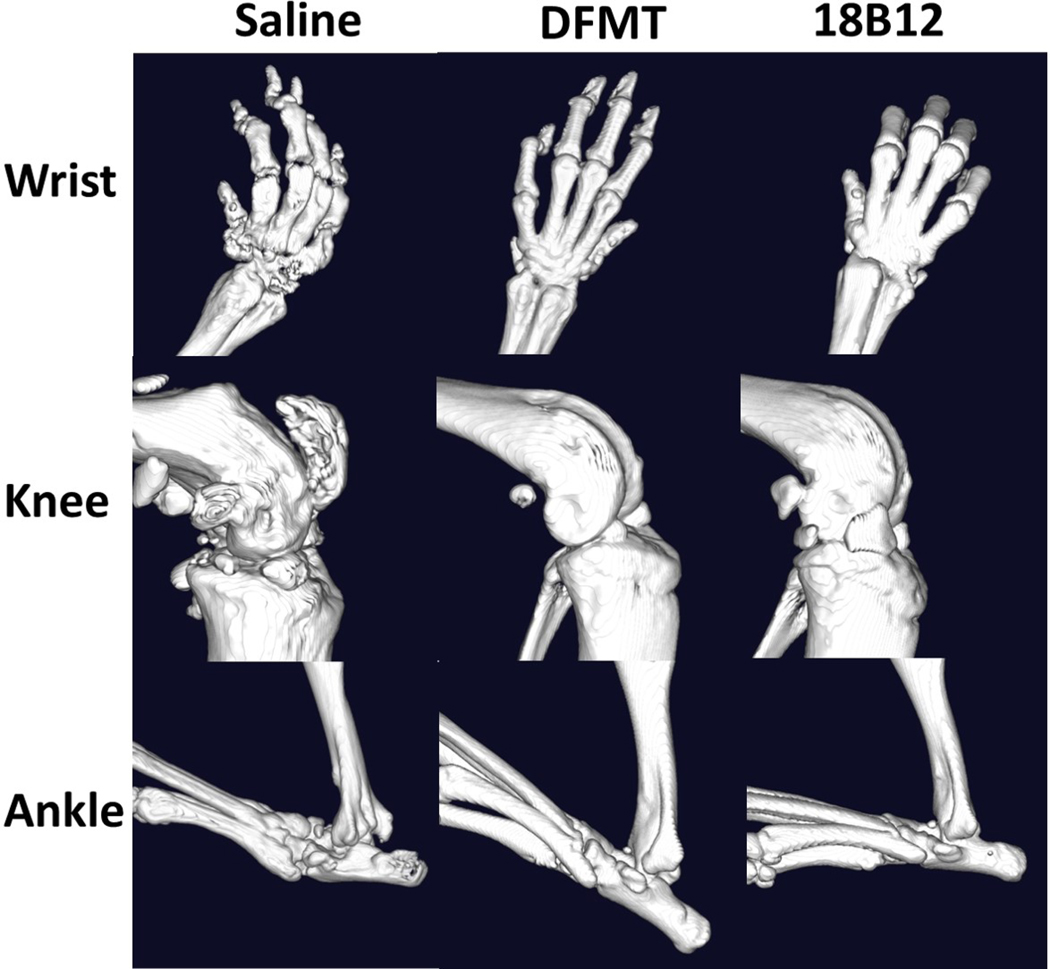
Micro-CT imaging of mice joints. Joints from mice with average RA score of each treatment group were dissected and fixed for imaging to evaluate bone erosion and loss.
3.6. Histology Analysis of Joint Structures
CIA mouse model possesses similar histological changes as human patients with RA, including joint damage, cartilage and bone erosion, pannus formation, synovium proliferation and cell infiltrations.[45,46] Representative sections for evaluation include subtalar joint, calcaneus and articulation genus joints of experimental mice. Joints were fixed, dissected and then stained with hematoxylin and eosin (H&E) as shown in Figure 7. Analysis revealed that pannus formation (Figure 7a), synovial hyperplasia (Figure 7b) and neutrophil infiltration (Figure 7c) were observed in saline treated CIA mice. RA progress resulted in irregular bone trabecula as well as cartilage and subchondral bone erosion (Figure 7d), accompanied by impairment of moving capability. By contrast, in DFMT and 18B12 treated CIA mice, symptoms described above were reduced. The cartilage surfaces of joint were smooth and had uniform thickness.
Figure 7.
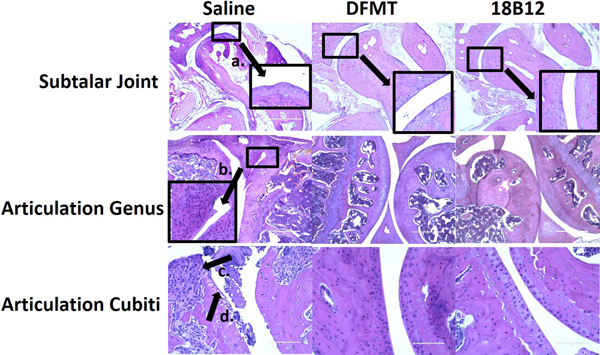
Histological staining of mice joints. Joints from mice with average RA score of each treatment group were dissected, fixed and stained for imaging to evaluate bone erosion and loss. The scale bar in images of subtalar joint and articulation genus is 400 μm while in the images of articulation cubiti is 100 μm.
4. Discussion
We applied the established DFMT B cell depletion strategy to treat an autoimmune disease, rheumatoid arthritis, and compared it with full antibody treatment. B cell depletion eliminated mature B cells before differentiation thus reducing plasma cells which secret IgM and IgG autoantibodies.[40] Additionally, B cell depletion prevents chronic activation of autoreactive T cells as B cells play a vital role as APCs to elicit T cell-mediated immune responses.[42,51] The administration regimen was designed to give the first treatment before collagen immunization as literature reported that full antibody treatment after RA onset could not inhibit RA development efficiently.[40]
Our data indicate that mice treated with DFMT and 18B12 mAb showed significantly suppressed RA development compared to untreated group (Figure 2B). Although DFMT demonstrated less potential in depleting mature B cells in spleen and lymph nodes than the 18B12 group, the B cell depletion levels in bone marrow and blood at day 120 were comparable for groups treated with DFMT or 18B12 mAb, respectively (Figures 3 and 4). From clinical observation, RTX treatment significantly alleviates ongoing joint inflammation but symptoms recurred along with recovery of B cells as autoantibodies were reproduced.[52,53] We also observed B cell depletion recovery in the DFMT treated group (Figure 4), thus it is vital to keep a constant low B cell level to maintain therapeutic effects.
In vivo imaging demonstrated DFMT-mediated enhanced joint accumulation of bioconjugates due to a two-step process (Figure 5). First, the bispecific engager, Fab’-MORF1, pre-targets B cells by biorecognition between Fab’ and CD20. The CD20 is a very slowly internalizing receptor; consequently, the cells stay decorated with MORF1 during the 5 h lag period. The absence of Fc minimizes premature endocytosis of the CD20/Fab’-MORF1 complex. Subsequent administration of the multivalent polymer effector, P-Cy5.5-(MORF2)8.9, targets the effector to B cells decorated by MORF1. Furthermore, structure imaging (micro-CT imaging and histological analysis) indicated that DFMT treatment significantly reduced bone loss, cartilage and bone erosion, pannus formation and inflammatory cell infiltration (Figures 6 and 7).
DFMT strategy allowed CIA mice to maintain nearly intact bone structure as well as organized soft tissue around joints. Compared to full antibody therapy, DFMT B cell depletion strategy provides a safer choice without Fc-initiated side effects, immunity issues with anti-chimeric antibody and resistance in long-term treatment. RTX is commonly administered in combination with methotrexate to achieve long-lasting effective clinical responses. To further maximize crosslinking-induced B cell apoptosis, optimization of DFMT needs to be explored in future study.
Terminal plasma half-life of Fab’-MORF1 is about 5 h,[31] which is longer than half-lives of other IgG Fab’ fragments. The extended half-life may be due to the MORF1 attachment as the PK of antibody fragments is molecular weight-dependent.[54] Compared to Fab’ fragment, full IgG antibody has a much longer half-life around 21 days due to FcRn recycling.[55] The significant difference in half-lives of Fab’-MORF1 and mAb should be taken into consideration when designing frequency of administration for future studies. Doses of DFMT should be given more frequently to achieve optimal therapeutic results due to relatively short half-life of Fab’-MORF1.
Another possible approach is to use DFMT based on type II antibody. Anti-CD20 antibodies are divided into Type I such as RTX and Type II such as obinutuzumab (OBN); the efficacy of OBN in B cell depletion in RA patient cells was twice higher compared to RTX.[56] Type I and type II antibodies have different patterns of binding to CD20 receptor. RTX binds between CD20 tetramers resulting in accumulation in lipid rafts, calcium influx and caspase activation. OBN binds within one tetramer with the conformation compatible with homotypic adhesion regions, leading to actin cytoskeleton remodeling and lysosome disruption. It is possible to enhance the activity of Type II antibody by triggering the apoptosis activation pathways of both types of antibodies. This new system is composed of two nanoconjugates: a) bispecific engager, OBN-MORF1 (OBN conjugated to one morpholino oligonucleotide MORF1); and b) a crosslinking (effector) component HSA-(MORF2)X (human serum albumin (HSA) grafted with multiple copies of complementary morpholino oligonucleotide 2). Modification of OBN with one MORF1 does not impact the binding of OBN-MORF1 to CD20 and following binding to CD20 Type II effects occur. Further exposure to multivalent effector HSA-(MORF2)X results in clustering the OBN-MORF1-CD20 complexes into lipid rafts and Type I effects occur. This new approach, called “clustered OBN (cOBN)” combines effects of both antibody types resulting in very high apoptotic levels.[57] Similarly, this cOBN strategy could be adapted to mouse model using B1 antibody, which is a murine type II antibody.[58]
Although RA progression in CIA mouse model is quick, not alike the indolent and relapsing development in human, CIA mouse model still has its value in evaluating therapeutic efficacy of B cell depletion strategy. We started the treatment prior to initiation of RA onset as literature stated B cell depletion alone could not inhibit RA progress efficiently. Nonetheless, it needs to be considered that clinical patients with RA are usually treated with CD20 mAb combination with immunosuppressive drugs like methotrexate, which may promote synergistic therapeutic effect. In conclusion, our work suggests that the application of DFMT B cell depletion strategy has a great potential in inhibiting and delaying RA progress in CIA mouse model. Further optimization of administration doses and/or schedule or enhancement of delivery strategy will be explored. In addition, DFMT could be utilized not only in RA, but also in other autoimmune diseases, such as systemic lupus erythematosus (SLE) and multiple sclerosis (MS).
Supplementary Material
Acknowledgements
The work was supported in part by NIH grants RO1 GM95606 (to JK) from the National Institute of General Medical Sciences, RO1 CA246716 (to JK) from the National Cancer Institute, and the University of Utah Research Foundation. We acknowledge support of Biogen, Inc. for providing 18B12 mAb for this research. We also acknowledge Dr. Hong-Hua Mu for his help in interpretation of histological results. The content is solely the responsibility of authors and does not necessarily represent the official views of the National Institutes of Health.
Footnotes
Supporting Information
Supporting Information is available from the Wiley Online Library.
Conflict of Interest
J.Y. and J.K. are co-inventors on US 10,251,906 B2 and PCT/US2017/37736 assigned to the University of Utah (UU) related to this work. UU licensed US 10,251,906 B2 to Bastion Biologics. J.K. is Chief Scientific Advisor and J.Y. Scientific Advisor for Bastion Biologics. J.K. and J.Y. are stockholders in Bastion Biologics.
Contributor Information
Jiawei Wang, Department of Pharmaceutics and Pharmaceutical Chemistry/Center for Controlled Chemical Delivery, University of Utah, Salt Lake City, Utah 84112, USA.
Dr. Yachao Li, Department of Pharmaceutics and Pharmaceutical Chemistry/Center for Controlled Chemical Delivery, University of Utah, Salt Lake City, Utah 84112, USA
Dr. Lian Li, Department of Pharmaceutics and Pharmaceutical Chemistry/Center for Controlled Chemical Delivery, University of Utah, Salt Lake City, Utah 84112, USA
Jiyuan Yang, Department of Pharmaceutics and Pharmaceutical Chemistry/Center for Controlled Chemical Delivery, University of Utah, Salt Lake City, Utah 84112, USA.
Jindřich Kopeček, Department of Biomedical Engineering, University of Utah, Salt Lake City, Utah 84112, USA.
References
- [1].Fishman P, Bar-Yehuda S, In A3 Adenosine Receptors from Cell Biology to Pharmacology and Therapeutics, Borea PA, Ed. 2010. [Google Scholar]
- [2].Elshabrawy HA, Chen Z, Volin MV, Ravella S, Virupannavar S, Shahrara S, Angiogenesis 2015, 18, 433. [DOI] [PMC free article] [PubMed] [Google Scholar]
- [3].Paulos CM, Turk MJ, Breur GJ, Low PS, Adv. Drug Deliv. Rev. 2004, 56, 1205. [DOI] [PubMed] [Google Scholar]
- [4].Shan Q-Q, Jiang X-J, Wang F-Y, Shu Z-X, Gui S-Y, Drug Deliv. 2019, 26, 9. [DOI] [PMC free article] [PubMed] [Google Scholar]
- [5].Juarranz Y, Abad C, Martinez C, Arranz A, Gutierrez-Canas I, Rosignoli F, Gomariz RP, Leceta J, Arthritis Res. Ther. 2005, 7, R1034. [DOI] [PMC free article] [PubMed] [Google Scholar]
- [6].Yuan F, Quan L-D, Cui L, Goldring SR, Wang D, Adv. Drug Deliv. Rev. 2012, 64, 1205. [DOI] [PMC free article] [PubMed] [Google Scholar]
- [7].Quan L, Zhang Y, Crielaard BJ, Dusad A, Lele SM, Rijcken CJF, Metselaar JM, Kostkova H, Etrych T, Ulbrich K, Kiessling F, Mikuls TR, Hennink WE, Storm G, Lammers T, Wang D, ACS Nano 2014, 8, 458. [DOI] [PMC free article] [PubMed] [Google Scholar]
- [8].Quan L, Zhang Y, Dusad A, Ren K, Purdue PE, Goldring SR, Wang D, Pharm. Res. 2016, 33, 186. [DOI] [PMC free article] [PubMed] [Google Scholar]
- [9].Kotzin BL, J. Rheumatol. 2005, 73, 14. [PubMed] [Google Scholar]
- [10].Alivernini S, Tolusso B, Fedele AL, Di Mario C, Ferraccioli G, Gremese E, Pharmacol. Res. 2019, 149, 104465. [DOI] [PubMed] [Google Scholar]
- [11].Barnas JL, Looney RJ, Anolik JH, Curr. Opin. Allergy Clin. Immunol. 2019, 61, 92. [DOI] [PMC free article] [PubMed] [Google Scholar]
- [12].Sibilia J, E Gottenberg J, Mariette X, Joint Bone Spine 2008, 75, 526. [DOI] [PubMed] [Google Scholar]
- [13].Edwards JCW, Cambridge G, Rheumatology 2001, 40, 205. [DOI] [PubMed] [Google Scholar]
- [14].Scher JU, Bull. NYU Hosp. Jt. Dis 2012, 70, 200. [PubMed] [Google Scholar]
- [15].Leandro MJ, Edwards JCW, Cambridge G, Ann. Rheum. Dis. 2002, 61, 883. [DOI] [PMC free article] [PubMed] [Google Scholar]
- [16].Engel P, Gomez-Puerta JA, Ramos-Casals M, Lozano F, Bosch X, Pharmacol. Rev. 2011, 63, 127. [DOI] [PubMed] [Google Scholar]
- [17].Emery P, Fleischmann R, Filipowicz-Sosnowska A, Schechtman J, Szczepanski L, Kavanaugh A, Racewicz AJ, van Vollenhoven RF, Li NF, Agarwal S, Hessey EW, Shaw TM, Arthritis Rheum. 2006, 54, 1390. [DOI] [PubMed] [Google Scholar]
- [18].Stashenko P, Nadler LM, Hardy R, Schlossman SF, J. Immunol. Res. 1980, 125, 1678. [PubMed] [Google Scholar]
- [19].Chen DR, Cohen PL, Int. J. Clin. Rheumtol. 2012, 7, 159. [DOI] [PMC free article] [PubMed] [Google Scholar]
- [20].Seyfizadeh N, Seyfizadeh N, Hasenkamp J, Huerta-Yepez S, Crit. Rev. Oncol. Hematol. 2016, 97, 275. [DOI] [PubMed] [Google Scholar]
- [21].Okroj M, Osterborg A, Blom AM, Cancer Treat. Rev. 2013, 39, 632. [DOI] [PubMed] [Google Scholar]
- [22].Jones JD, Shyu I, Newkirk MM, Rigby WFC, Arthritis Res. Ther. 2013, 15, R20. [DOI] [PMC free article] [PubMed] [Google Scholar]
- [23].Franklin EC, Holman FR, Muller-Eberhard HJ, Kunkel HG, Int. J. Clin. Exp. Med 1957, 105, 425. [Google Scholar]
- [24].Weber R, Breustedt D, Schlicht S, Meyer CA, Niewoehner J, Ebeling M, Freskgard P–O, Bruenker P, Singer T, Reth M, Iglesias A, Pharm. Res. 2018, 35, 169. [DOI] [PMC free article] [PubMed] [Google Scholar]
- [25].Allison M, Nat. Biotechnol. 2010, 28, 105. [DOI] [PubMed] [Google Scholar]
- [26].Lands LC, Pediatr. Nephrol. 2010, 25, 1001. [DOI] [PubMed] [Google Scholar]
- [27].Reddy V, Cambridge G, Isenberg DA, Glennie MJ, Cragg MS, Leandro M, Arthritis Rheum. 2015, 67, 2046. [DOI] [PMC free article] [PubMed] [Google Scholar]
- [28].Keystone E, Fleischmann R, Emery P, Furst DE, van Vollenhoven R, Bathon J, Dougados M, Baldassare A, Ferraccioli G, Chubick A, Udell J, Cravets MW, Agarwal S, Cooper S, Magrini F, Arthritis Rheum. 2007, 56, 3896. [DOI] [PubMed] [Google Scholar]
- [29].Chu T–W, Kopeček J, Biomater. Sci. 2015, 3, 908. [DOI] [PMC free article] [PubMed] [Google Scholar]
- [30].Yang J, Li L, Kopeček J, Biomaterials 2019, 190–191, 11. [DOI] [PubMed] [Google Scholar]
- [31].Chu T-W, Zhang R, Yang J, Chao MP, Shami PJ, Kopeček J, Theranostics 2015, 5, 834. [DOI] [PMC free article] [PubMed] [Google Scholar]
- [32].Chu T-W, Yang J, Zhang R, Sima M, Kopeček J, ACS Nano 2014, 8, 719. [DOI] [PMC free article] [PubMed] [Google Scholar]
- [33].Li L, Yang J, Wang J, Kopeček J, ACS Nano 2018, 12, 3658. [DOI] [PMC free article] [PubMed] [Google Scholar]
- [34].Wang J, Li L, Yang J, Clair PM, Glenn MJ, Stephens DM, Radford DC, Kosak KM, Deininger MW, Shami PJ, Kopeček J, Nanomedicine: NBM 2019, 16, 217. [DOI] [PMC free article] [PubMed] [Google Scholar]
- [35].Li L, Yang J, Soodvilai S, Wang J, Opanasopit P, Kopeček J, Control J. Release 2019, 293, 84. [DOI] [PMC free article] [PubMed] [Google Scholar]
- [36].Li L, Yang J, Wang J, Kopeček J, Macromol. Biosci. 2018, 18, 170. [DOI] [PMC free article] [PubMed] [Google Scholar]
- [37].Nandakumar KS, Holmdahl R, Arthritis Res. Ther. 2006, 8, 223. [DOI] [PMC free article] [PubMed] [Google Scholar]
- [38].Hegen M, Keith JC, Collins M, Nickerson-Nutter CL, Ann. Rheum. Dis. 2008, 67, 1505. [DOI] [PubMed] [Google Scholar]
- [39].Phadke K, Fouts RL, Parrish JE, Butler LD, Immunopharmacology 1985, 10, 51. [DOI] [PubMed] [Google Scholar]
- [40].Yanaba K, Hamaguchi Y, Venturi GM, Steeber DA, St. Clair EW, Tedder TF, J. Immunol. 2007, 179, 1369. [DOI] [PubMed] [Google Scholar]
- [41].Yu S, Dunn R, Kehry MR, Braley-Mullen H, J. Immunol. 2008, 180, 7706. [DOI] [PubMed] [Google Scholar]
- [42].Hamel K, Doodes P, Cao Y, Wang Y, Martinson J, Dunn R, Kehry MR, Farkas B, Finnegan A, J. Immunol. 2008, 180, 4994. [DOI] [PubMed] [Google Scholar]
- [43].Kopeček J, Bažilová H, Eur. Polym. J. 1973, 9, 7. [Google Scholar]
- [44].Brand DD, Latham KA, Rosloniec EF, Nat. Protoc. 2007, 2, 1269. [DOI] [PubMed] [Google Scholar]
- [45].Bruhl H, Cihak J, Talke Y, Gomez MR, Hermann F, Goebel N, Renner K, Plachy J, Stangassinger M, Aschermann S, Nimmerjahn F, Mack M, Eur. J. Immunol. 2015, 45, 705. [DOI] [PubMed] [Google Scholar]
- [46].Turan A, Celtikci P, Tufan A, Ozturk MA, Eur. J. Rheumatol. 2017, 4, 166. [DOI] [PMC free article] [PubMed] [Google Scholar]
- [47].Otero DC, Rickert RC, J. Immunol. 2003, 171, 5921. [DOI] [PubMed] [Google Scholar]
- [48].van der Heijde D, Ann. Rheum. Dis. 2011, 70, i116. [DOI] [PubMed] [Google Scholar]
- [49].Yang S, Hollister AM, Orchard EA, Chaudhery SI, Ostanin DV, Lokitz SJ, Mathis JM, Biol. Proced. Online 2013, 15, 8. [DOI] [PMC free article] [PubMed] [Google Scholar]
- [50].Antill AC, Ballard DH, Hollister AM, Rogers EJ, Yang S, Lokitz SJ, Diagn. Interv. Imaging 2016, 97, 651. [DOI] [PubMed] [Google Scholar]
- [51].Lanzavecchia A, Immunol. Rev. 1987, 99, 39. [DOI] [PubMed] [Google Scholar]
- [52].Leandro MJ, Cambridge G, Ehrenstein MR, Edwards JCW, Arthritis Rheumatol. 2006, 54, 613. [DOI] [PubMed] [Google Scholar]
- [53].Cambridge G, Leandro MJ, Edwards JCW, Ehrenstein MR, Salden M, Bodman-Smith M, Webster ADB, Arthritis Rheumatol. 2003, 48, 2146. [DOI] [PubMed] [Google Scholar]
- [54].Bazin-Redureau MI, Renard CB, Scherrmann J-MG, J. Pharm. Pharmacol. 1997, 49, 277. [DOI] [PubMed] [Google Scholar]
- [55].Kim J, Hayton WL, Robinson JM, Anderson CL, J. Allergy Clin. Immunol. 2007, 122, 146. [DOI] [PMC free article] [PubMed] [Google Scholar]
- [56].Reddy V, Klein C, Isenberg DA, Glennie MJ, Cambridge G, Cragg MS, Leandro MJ, M. J Rheumatology 2017, 56, 1227. [DOI] [PMC free article] [PubMed] [Google Scholar]
- [57].Li L, Wang J, Li Y, Radford DC, Yang J, Kopeček J, ACS Nano 2019, 13, 11422. [DOI] [PMC free article] [PubMed] [Google Scholar]
- [58].Beers SA, Chan CHT, James S, French RR, Attfield KE, Brennan CM, Ahuja A, Shlomchik MJ, Cragg MS, Glennie MJ, Blood 2008, 112, 4170. [DOI] [PMC free article] [PubMed] [Google Scholar]
Associated Data
This section collects any data citations, data availability statements, or supplementary materials included in this article.


