Abstract
Fluorescence flow cytometry is increasingly being used to quantify single-cell expression distributions in bacteria in high-throughput. However, there has been no systematic investigation into the best practices for quantitative analysis of such data, what systematic biases exist, and what accuracy and sensitivity can be obtained. We investigate these issues by measuring the same E. coli strains carrying fluorescent reporters using both flow cytometry and microscopic setups and systematically comparing the resulting single-cell expression distributions. Using these results, we develop methods for rigorous quantitative inference of single-cell expression distributions from fluorescence flow cytometry data. First, we present a Bayesian mixture model to separate debris from viable cells using all scattering signals. Second, we show that cytometry measurements of fluorescence are substantially affected by autofluorescence and shot noise, which can be mistaken for intrinsic noise in gene expression, and present methods to correct for these using calibration measurements. Finally, we show that because forward- and side-scatter signals scale non-linearly with cell size, and are also affected by a substantial shot noise component that cannot be easily calibrated unless independent measurements of cell size are available, it is not possible to accurately estimate the variability in the sizes of individual cells using flow cytometry measurements alone. To aid other researchers with quantitative analysis of flow cytometry expression data in bacteria, we distribute E-Flow, an open-source R package that implements our methods for filtering debris and for estimating true biological expression means and variances from the fluorescence signal. The package is available at https://github.com/vanNimwegenLab/E-Flow.
Introduction
It is has become well recognized that, due to the intrinsic stochasticity of the gene expression process, even isogenic populations of microbial cells growing in homogeneous environments exhibit significant heterogeneity in their gene expression, e.g. [1–4]. Therefore, the traditional studies at the population level, by smoothing out this heterogeneity, tend to hide crucial information [5, 6] that is required to correctly understand and interpret the observed behavior of microbes [7].
Although most studies of single-cell gene expression in bacteria use fluorescent reporters in combination with microscopy to quantify gene expression in single cells, fluorescence flow cytometry (FCM) is also an attractive alternative methodology for single-cell gene expression studies in bacteria. In particular, given that flow cytometers can quantify the fluorescence of thousands of cells per second, flow cytometry allows for high-throughput characterization of the single-cell expression distributions of a large number of fluorescent reporters [8, 9]. Indeed, in recent years there has been a large number of studies in which standard commercially available flow cytometers were used in combination with fluorescent reporters to measure gene expression at the single-cell level in bacteria [10–31], as well as in single-celled eukaryotes [32, 33].
However, so far there has been little systematic investigation into the accuracy of flow cytometry in quantifying gene expression in single cells, or a systematic comparison with the results from microscopy measurements. Here we aim at filling this gap by systematically comparing flow cytometry measurements with measurements from a microscopy setup. In particular, there are several technical challenges in analyzing fluorescence flow cytometry data of individual bacterial cells:
-
Differentiating cells from debris. Bacterial cells are typically one thousandth the volume of mammalian cells, which places them near the edge of instrument detection. At this size it can be challenging to differentiate viable cells from debris of similar size [9, 34–37]. In the literature different approaches are used to separate debris from viable cells. Most of these approaches use ad hoc combinations of the scatter measurements to retain a fraction of the measurements.
We here perform a careful analysis of all the scatter signals reported by the flow cytometer and propose a principled way of identifying debris from viable cells using a Bayesian mixture model that considers all the information available in the scatter signals.
-
Distinguishing measurement noise from biological variability. In order to quantify the amount of biological gene expression variation in a population of isogenic cells, it is important to quantify to what extent variation in measured fluorescence intensity derives from biological variation, and to what extent it derives from measurement noise.
We show that flow cytometry measurements contain a substantial amount of shot-noise which can be easily mistaken for true biological variability, and develop a method to correct for this shot-noise using measurements of reference beads that are commonly used to calibrate flow cytometers. Using a mixture modeling approach, we develop a rigorous method for estimating the true mean and variance in expression levels of a population of cells.
-
Accounting for autofluorescence. Because most genes are expressed at low levels in bacteria (roughly one per cell cycle or less for half of the genome [38]), the relative fluorescence produced by fluorescent proteins compared to autofluorescent compounds is very low for many reporters [39]. Therefore, gene expression estimates require careful correction for autofluorescence.
We here provide methods for correcting both the estimated mean and variance in fluorescence levels for autofluorescence using measurements of cells that do not express GFP.
-
Estimating the distribution of GFP concentrations. While we provide methods for accurately estimating the distribution of total GFP levels in a population of cells from the flow cytometry measurements, microscopy measurements show that total GFP levels correlate strongly with cell size and that GFP concentrations vary significantly less across cells than total GFP.
Estimating the distribution of GFP concentrations directly using flow cytometry requires to not only estimate the total GFP but also the volume of individual cells. Although forward- and side-scatter signals can be used to distinguish the average size of populations of cells of sufficiently different shapes and sizes [40–43], it is substantially more challenging to accurately quantify the relatively small cell-to-cell variations in cell volume for populations of isogenic bacteria growing in a homogeneous environment. In line with previous works [35, 44–46] we find that, because forward- and side-scattering measurements depend on cell volume in a complex non-linear manner and contain a substantial amount of shot noise that cannot be easily calibrated, it is impossible to accurately quantify the sizes of individual cells. Consequently, it is not possible to directly estimate the distribution of GFP concentrations from flow cytometry measurements. However, we show that because GFP concentrations and cell sizes fluctuate approximately independently, it is still possible to obtain reasonably accurate quantifications of the relative amounts of GFP concentration fluctuations for different genes.
Although the precise flow cytometer used will of course affect the precise values of the measurements and calibrations, the methods for separating true cells from debris, estimating and correcting for autofluorescence, and correcting for measurement shot noise, are general and should be applicable to data from most flow cytometers. Our methods have been implemented as an R package called E-Flow, which we make publically available and can be easily integrated in any flow cytometry data analysis pipeline.
Materials and methods
Strains and growth conditions
We measured the fluorescence distributions for a number of different Escherichia coli MG1655 strains carrying fluorescent transcriptional reporters (a GFP gene downstream of a given promoter, either on a low-copy number plasmid, or integrated into the chromosome) both using flow cytometry of batch cultures and time lapse microscopy in a microfluidic device (Mother Machine). We considered a number of different promoters, that have different means and variances of expression levels.
In particular, we considered E. coli strains with a lacZ-GFP fusion integrated in the chromosome [47], and a set of E. coli strains that carry a transcriptional reporter expressed from a low copy number plasmid [48]. These reporters included known target promoters of the LexA transcription factor (dinB, ftsK, lexA, polB, recA, ruvA, or uvrD) [49] and two synthetic promoters that were obtained by experimental evolution and express at levels corresponding to the median and the 97th percentile of all native E. coli promoters [23]. Throughout the paper, we refer to these two synthetic promoters as high and medium expressers.
To estimate autofluorescence in both the FCM and microfluidic experiments, we used two strains that carry plasmids where the GFP sequence is downstream of a random sequence (pUA66 and pUA139) [48] and hence do not express GFP [23].
In the microfluidic experiments, cells carrying a lacZ-GFP fusion were tracked using time-lapse microscopy while growing in a microfluidic device in M9 minimal media supplemented with 0.2% lactose (which leads to full induction of the lac operon), taking measurements every 3 minutes [47]. Detailed experimental procedures are available in the corresponding publication [47]. Microfluidic experiments with strains carrying a transcriptional reporter expressed from a plasmid were performed following the same procedure, using M9 + 0.4% glucose (supplemented with 50μg / mL of kanamycin during the overnight preculture only) and acquiring data over 4 hours.
To obtain comparable measurements with flow cytometry (FCM), the same strains were grown in the same conditions as for the microfluidic measurements. Practically, strains expressing from a plasmid were inoculated from frozen glycerol stocks and grown overnight in 200μL of M9 + 0.4% glucose supplemented with 50μg/mL of kanamycin. After 100× dilution in fresh medium without kanamycin, strains were grown to saturation again, and re-diluted 100× to fresh medium without kanamycin. For the lacZ-GFP strain, we used 200μL of M9 + 0.2% lactose with only one overnight culture. For all strains, expression was measured in mid-exponential phase (typically after 4h), adjusting the cell concentration with PBS if necessary. All cultures used for FCM measurements were incubated in 96-well plates at 37°C with shaking at 600-650 rpm.
To study the accuracy of the scatter signal for estimating cell size, we used the data acquired for a previous project in the lab [31] where both flow cytometry measurements and microscopy measurements of cell size distributions have been obtained in four different media characterized by different size distributions: M9 supplemented with either 0.2% glucose (w/v), 0.2% glycerol (v/v) or 0.2% lactose (w/v); a MOPS based synthetic rich media (Teknova, M2105) supplemented with 0.2% glucose. We refer to the original study for more information about the cell cultures and growth conditions [31].
Flow cytometry
The flow cytometry measurements were obtained with a BD FACSCanto II cytometer and were managed using the Diva 8 software. The excitation beam for the GFP was set at 488 nm and the emission signal was captured with a 530/30 nm bandpass filter. The gain voltage were set by default to 625V, 420V, and 600V for FSC, SSC, and GFP acquisition respectively, and events were created for measurements where FSC > 200 & SSC > 200. For each sample, 5 × 10⁴ events were recorded at a typical flow rate ranging from 1 × 10⁴ to 2 × 10⁴ per second.
Calibration beads
CS&T (Cytometer Setup and Tracking Beads) are artificial fluorescent beads that are used to calibrate fluorescence measurement values [50]. To calibrate the measurement shot noise we used beads of lot 41720 that contains beads of two different sizes, which have high, medium (3μm in size) and low fluorescence (2μm in size) levels.
Microscopy size estimation
To estimate cell sizes, strains containing a plasmid without promoter were selected from 4 different media with different size distributions (M9 + glucose, lactose or glycerol; MOPS + glucose. See Strains and growth conditions). Cells were then placed on a 1% agarose pad and phase contrast images were obtained with a Nikon Ti-E microscope using a 100 × Ph3 objective (NA 1.45) and an Hamamatsu Orca-Flash 4.0 v2 camera. Cell outlines were identified using a custom MATLAB pipeline [31].
R package E-Flow
The analysis pipeline presented in this paper has been implemented in the R package E-Flow available on GitHub https://github.com/vanNimwegenLab/E-Flow. Here the methods were tested with flow cytometers manufactured by BD and operated through the DIVA software. Nonetheless we kept the methods as general as possible, such that they should be applicable to flow cytometers of other manufacturers.
For a detailed explanation of the package, we refer to the GitHub page, including the vignette and the documentation of the individual functions. Here we list the main components of the software:
Filtering: The cells are filtered based on their scattering profile and an estimate of the mean and variance of the population is obtained. This is the most resource-intensive step and therefore can be parallelized.
Mean and variance: The mean and variance of the population of cells is computed. Measurements that are outliers in the fluorescence are accounted for using a mixture model.
Autofluorescence removal: Using the fluorescence distribution of non-expressing cells, an estimate of the autofluorescence is obtained and subtracted from the mean and variance of the population.
Shot noise removal: The shot noise introduced by the machine is removed and a corrected variance is calculated. This can be regarded as a proxy for the biological gene expression noise.
Results
Signals reported by the cytometer
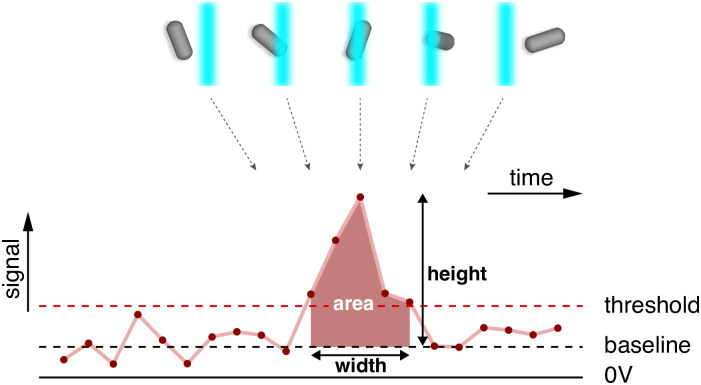
In flow cytometry, a beam of light is used to illuminate cells that flow one by one through a channel; a series of detectors is able to record the light scattered by the single cells at right angles or in the forward direction and the cell fluorescence stimulated by the incident light beam. Most flow cytometers, including the BD Canto II used here, report for each measured ‘event’ (typically corresponding to a single measured cell) a forward-scatter signal, a side-scatter signal, and a fluorescence signal. Each of these signals is in turn represented by 3 statistics of the electrical impulse, namely height, area, and width of the impulse (Fig 1). The height corresponds to the maximal value of the impulse, the area to the area under the curve and the width is its time duration [51] (see Section 1.1 in S1 File).
Fig 1. The signals reported by the cytometer.
As a particle enters the laser beam, an electric signal (pulse) is generated which reaches its maximum when the particle is in the middle of the beam and trails off as the particle leaves the beam. Each pulse with height over a certain threshold is recorded and three quantities are reported: height, area, and width of the pulse.
We noticed that these statistics are not all independent. In particular, for all three signals, the area is always directly proportional to the product of height and width (S1 Fig and Section 1.2 in S1 File). Moreover, while height and width vary approximately independently across events, the area correlates significantly with both (S2 Fig in S1 File). Therefore, we only use height and width for the subsequent analysis of the forward- and side-scatter signals.
For the fluorescence signal we were unable to find any systematic dependence between the width of the fluorescence signal and any biological signal, such as cell size or total fluorescence. In addition, for the calibration beads there is clearly no information in the width of the fluorescence signal (S3 Fig and Section 1.3 in S1 File). Therefore, for the fluorescence signal we will only use the height statistic as a proxy for the total fluorescence of the cells. While we believe that all these considerations apply generally to flow cytometers, we also observed anomalous behavior of the signal at very low fluorescence levels that may be specific to the BD machine used here (see Section 1.4 in S1 File). Due to this anomalous behavior, quantitative analysis is restricted to constructs for which the GFP fluorescence is at least as high as the autofluorescence of the cells (see S4 Fig in S1 File).
Filtering events based on their forward- and side-scatter
In comparison to eukaryotic cells, bacterial cell produce only relatively weak scattering signals, and we used permissive settings of the device to call events. This increases the likelihood of having spurious observations that correspond to non-viable cells and other debris. Consequently, we needed a strategy for using the measured forward- and side-scatter of the events to separate viable cell measurements from debris. As explained above, the scatter of each event is characterized by 4 statistics, namely the height and width of both the forward- and side-scatter. Thus, the measured scatter of each event can be represented by a point in a 4-dimensional space, and a given dataset corresponds to a distribution of points in this 4-dimensional space. To separate viable cells from debris we fit this distribution with a mixture of a multivariate Gaussian distribution and a uniform distribution, as detailed in the Section 2 in S1 File. The rationale behind this mixture modeling is that most of the data represents good cells and should cluster in this 4-dimensional space, whereas the outliers are relatively rare and more widely distributed. In this model, the Gaussian part of the mixture captures the cluster of good cells, while the uniform component takes care of outliers, i.e. fragments of dead cells and other debris.
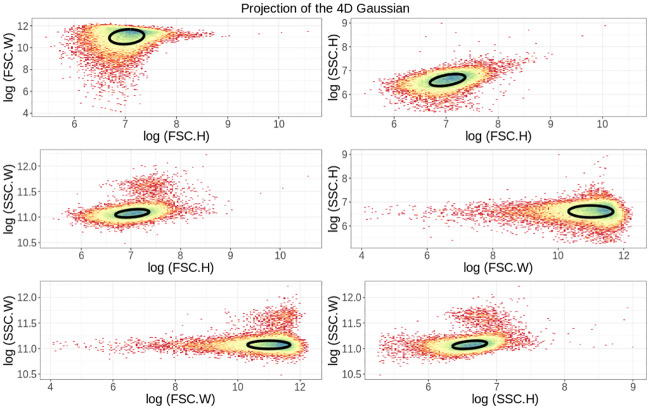
Fig 2 shows 2D projections of the 4D scatter of forward- and side-scatter for events taken from E. coli cells that carry a lacZ-GFP fusion (see [47] for a description of the strain used) while growing in M9 minimal media supplemented with lactose. Besides the scatter of measurements, Fig 2 also shows the multivariate Gaussian fitted to the data, showing that this Gaussian indeed captures the bulk of the measured events.
Fig 2. Mixture model fitting of the scatter signals.
The panels show different two-dimensional projections of the full 4D distribution of heights (H) and widths (W) of forward- (FSC) and side-scatter (SSC) measurements for 5 × 10⁴ events obtained from E. coli cells growing in M9 minimal media with lactose. The ellipses show the contour of the fitted multivariate Gaussian distribution, one standard deviation away in each principal direction. Note that the color indicates the local density of points.
Once the mixture model has been fitted to a dataset, a posterior probability pi is calculated for each measured event i to correspond to a viable cell, i.e. the probability that the observation derives from the multivariate Gaussian component of the mixture as opposed to deriving from the uniform distribution. By default the E-flow software retains all events with posterior probability pi ≥ 0.5 and discards as outliers events with pi < 0.5, but the user can change this threshold probability if desired. S5 Fig in S1 File shows the same scatter of measured events as shown in Fig 2, but now with selected events in red and events that were filtered out in black when using the default threshold of p = 0.5.
As the forward- and side-scatter should reflect the size, shape and composition of the objects measured in each event, one may wonder to what extent filtering out events based on their forward- and side-scatter may bias measurements towards cells of a certain size. Indeed, in previous work, e.g. [19], researchers have attempted to select subsets of cells with similar shapes and size by very strictly gating on forward- and side-scatter, retaining only those cells that lie near the center of the Gaussian distribution. To check the viability of such an approach, we compared the distribution of measured fluorescence levels with two extreme filtering strategies: one very lenient in which all events with p > e−10 are retained and one very strict in which only cells with p > 1 − e−10 are retained. As shown in S6 Fig in S1 File, there is virtually no difference in the observed distribution of fluorescence levels between the very lenient and very strict filtering. Given that we expect total fluorescence to scale with cell size, this observation suggests that strict filtering on forward- and side-scatter is not effective for selecting out a subset of cells with similar size.
Flow cytometer measurements are affected by substantial measurement noise
When using the flow cytometer to estimate single-cell gene expression, we aim to quantify the variation in gene expression across a population of isogenic cells growing in a homogeneous environment. In such conditions, bacteria at different stages of their cell cycle vary by roughly two-fold in size, and their total fluorescence is typically proportional to cell size.
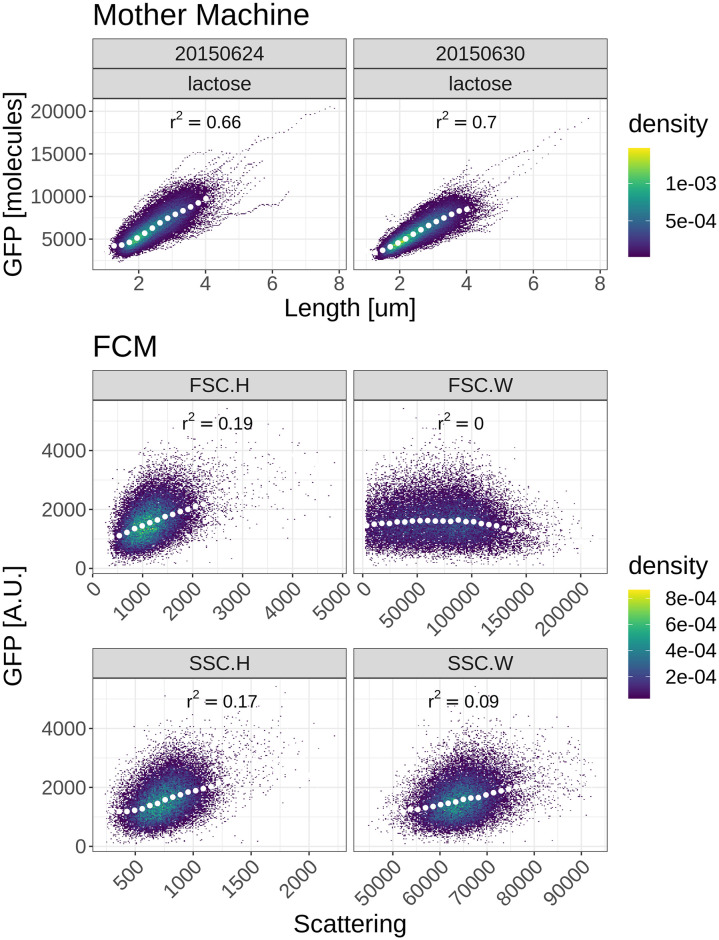
In a previous work we have established that time-lapse microscopy measurements of cells growing in microfluidic devices can measure cell size with an accuracy of around 3% error and GFP copy-number G with an error of about [47]. Using such microscopy measurements on E. coli cells carrying a lacZ-GFP fusion gene in its native locus while growing in M9 minimal media with lactose, we find a high correlation between lacZ-GFP levels and cell size (Fig 3, top panels). That is, because lacZ-GFP concentrations fluctuate only moderately from cell to cell, and both size and GFP level measurements have high accuracy, the measured cell length explains around 70% of the variance in total fluorescence.
Fig 3. Correlation between cell size and fluorescence measurements for microscopy and cytometer measurements.
Each panel shows measured GFP fluorescence (vertical axis) and cell size estimates (horizontal axis) of cells growing in M9 minimal media with lactose. The top 2 panels show microscopy measurements from a microfluidic device [47]. The lower 4 panels show fluorescence measurements as a function of size estimates based on forward- (middle 2 panels) or side-scatter (bottom 2 panels) measurements in the flow cytometer (FCM). The squared Pearson correlations between fluorescence and size measurements are indicated in each panel. Note that the color indicates the density of points. The white dots show median values of equally spaced bins along the horizontal axis.
We calculated the analogous correlation between size and total fluorescence in the flow cytometer for the same strain growing in the same environment, using the scatter signals as representing the cell size. We see that, in contrast to the microscopy measurements, there is only a very weak correlation between total fluorescence and scattering measurements (Fig 3, bottom 4 panels).
The lack of correlation between size and fluorescence measurements in the cytometer strongly suggests that either the fluorescence measurements, the size measurements, or both are much more heavily affected by measurement noise than in the microfluidic experiments. In the following we will look at different sources of noise and how to deal with them.
Estimating the mean and variance of the fluorescence distribution
As has been observed by others [38], we observed that for virtually all E. coli promoters, the distribution of fluorescence levels is fitted very well by a log-normal distribution [23], i.e. the log-fluorescence follows a Gaussian distribution. Our E-Flow package fits a Gaussian distribution to the measured log-fluorescence levels of single cells, estimating a mean μ and variance v for a given population of cells. However, we noticed that, even after filtering events on forward- and side-scatter as explained above, there are still clear outlying events, i.e. with fluorescence levels that lie far outside the range observed for almost all other events. To separate these outliers from valid measurements we modeled the distribution of log-fluorescence levels as a mixture of a Gaussian and a uniform distribution, fitting its parameters using expectation maximization (see Section 3 of S1 File for details). The E-Flow package calculates an estimated mean μ and variance v of the log-fluorescence levels of a set of measurements, together with error bars σμ and σv on these estimates. In addition, transforming from log-fluorescence back to fluorescence in linear scale, the package also calculates mean and variance of the distribution of fluorescence levels, together with error bars (Section 3 in S1 File).
Autofluorescence estimation
It is well known that the laser used to excite the GFP can also excite other cellular components of the cell, resulting in an “autofluorescence” signal that also occurs in cells without GFP molecules. In addition, the fluorescence signal may also contain a background fluorescence component coming from sources other than the cell’s autofluorescence. In order to estimate GFP levels, we need to correct for these other sources of fluorescence and the E-Flow package allows for such correction by using measurements of cells that do not express GFP. Let’s call IM the measured fluorescence intensity, IT the true intensity (deriving from GFP molecules) and A the component from other sources of fluorescence, which for simplicity we will refer to as autofluorescence. We have the relation
| (1) |
Assuming that the component A fluctuates independently from the true fluorescence IT, we obtain
| (2a) |
| (2b) |
Thus, in order to correct for autofluorescence, it suffices to estimate both its mean 〈A〉 and variance var(A). These can be easily estimated by performing fluorescence measurements on cells that either lack GFP, or where the GFP gene is known not to be expressed, and applying the same Bayesian mixture model described above. Once 〈A〉 and var(A) have been estimated in this way, the true mean and variance of GFP expression in cells carrying an active reporter can be calculated using Eq (2).
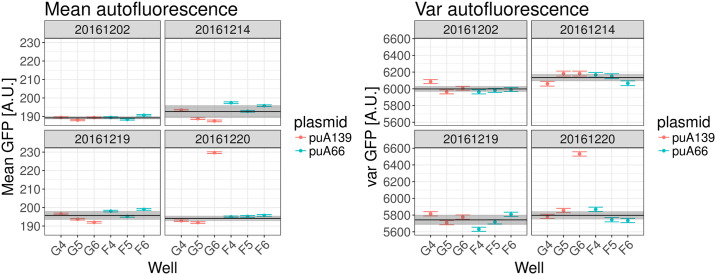
We measured autofluorescence levels A using strains carrying two different plasmids not expressing GFP, designed as negative controls (see materials and methods) on 4 different days, measuring each strain in triplicate on each day. Fig 4 shows the estimated mean fluorescences (left 4 panels) and variances in fluorescences (right 4 panels) for each replicate of each strain (red an blue) on each day (one panel per day). Using a procedure described in Section 4 in S1 File, we averaged over different replicates on each day to calculate a mean fluorescence μd for each day (black line in each panel) and an error bar on this estimate (grey region in each panel), and similarly for the variances on each day (right 4 panels). We then additionally averaged over different days to calculate an overall average mean autofluorescence and an overall average variance in autofluorescence (see Section 4 in S1 File).
Fig 4. Autofluorescence measurements.
Each panel shows the measured mean fluorescence (left 4 panels) and variance in fluorescence (right 4 panels) on one day, with each bar indicating the measured value and error bar for one replicate. Two different strains were used (indicated in red and blue) and each was measured in triplicate on each day. The black line and grey bar indicate the estimated averages μd and corresponding error-bars σd for each day d. Note that well G6 on 20/12/2016 appears to be an outlier, possibly due to contamination of the well, which was excluded from the analysis.
Mean fluorescence levels agree between microscopy and FCM across the entire range of expression levels
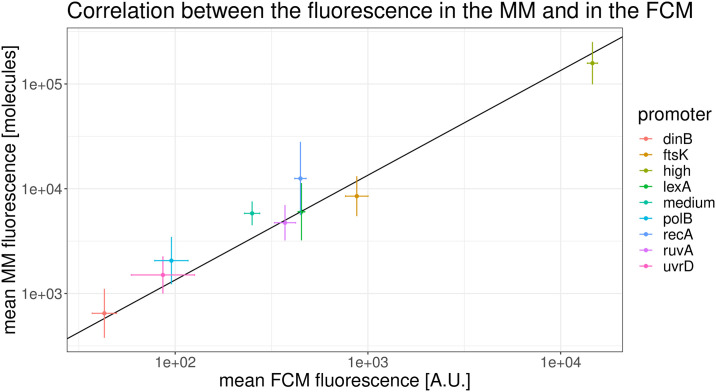
Although commercial flow cytometers have been designed to ensure a linear relationship between GFP content and fluorescence measurements over a wide range and previous gene expression studies studies using FCM have operated under this assumption, we here tested this assumption by comparing estimated mean fluorescence levels of different promoters between FCM and microscopy measurements. To do so we calculated the mean fluorescence levels, corrected for autofluorescence, of promoters with a wide range of expression levels using both the FCM and microscopy measurements. As shown in Fig 5, we indeed find that there is a perfectly linear relationship between the average expression levels of the different promoters as estimated by FCM and microscopy, over the entire expression range.
Fig 5. Estimated mean expression levels of different promoters as estimated by FCM and microscopy.
After correcting for autofluorescence, mean fluorescence levels of different promoters (colors) are perfectly linearly correlated between microscopy and FCM measurements, over the entire range of expression levels. The scales of the axes are in natural log and the error bars show the standard error of the mean. Note that the slope of the black line is 1.
Cytometer fluorescence measurements exhibit significant shot noise
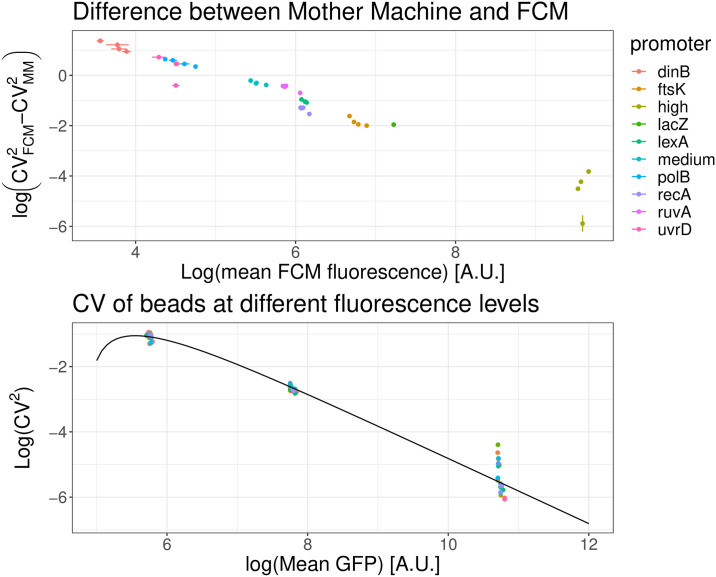
We used Eq (2) to remove the autofluorescence contribution from the mean expression and variance of the population for a number of different transcriptional reporters and calculated the observed squared coefficient of variation CV2 for each promoter. Next, we took microscopy measurements from our microfluidic setup of the same E. coli strains growing in the same conditions and measured CV2 for each of these promoters as well. As shown in the top panel of Fig 6, we observe systematically higher CV2 in the FCM than in the microscopy setup and the difference in the two CV2s decreases almost exactly inversely with the mean expression level.
Fig 6. Difference in CV2 between the FCM and microscopy measurements shows FCM measurements contain substantial shot noise.
Top: Difference between the CV2 as measured by the FCM and the microscopy setup for different transcriptional reporters of E. coli promoters (colored points). Both axes are shown on a logarithmic scale. The difference in CV2 scales inversely with mean expression. Bottom: The observed CV2 of calibration beads of three different intensities also decreases as the inverse of mean intensity and this dependence can be well modeled by shot noise (black line), as given by Eq (3).
Since the growth conditions in the FCM and the microfluidic setup were kept as close as possible, the true CV2 of the distribution of total GFP levels should be highly similar, so that the difference between the measured CV2 must derive from measurement noise. Indeed, one source of noise whose contribution to CV2 is expected to scale inversely with mean intensity is shot noise from the photomultiplier tube, whose CV2 scales as 1/mean [52]. Due to this noise, one generally has the following relationship between the measured fluorescence intensity IM and the true intensity IT:
| (3) |
where ϵ is a Gaussian random variable with mean 0 and an (unknown) variance δ2 which quantifies the size of the shot noise. The constant term O is an offset that is added in BD devices in order to prevent the clipping of negative values during the digital conversion, when true intensities IT are close to zero [51].
Flow cytometers are often calibrated using synthetic fluorescent beads of known intensities and such beads can also be used to estimate the size δ of the measurement shot noise. As shown in the bottom panel of Fig 6 (and S7 Fig in S1 File) the CV2 of the artificial beads also drops inversely with mean expression. If we assume that the true variation of the beads can be ignored, we get from Eq (3) that the measured CV2 is
| (4) |
If we define and , we obtain
| (5) |
and we can infer both the strength δ and the offset O by fitting Y as a simple linear function of X. This simple approach leads to an inferred value of δ = 13.4 and O = 128. In the Section 5 in S1 File we also present a more sophisticated Bayesian mixture model approach to inferring these quantities, which does not ignore the true variability of the beads, but assumes that the CV2 of the true intensities IT is the same for all three types of beads. Using this more rigorous procedure, the resulting strength and offset are: δ = 12.7 ± 0.6, O = 97 ± 29 (S7 Fig in S1 File), which are close to the values we would have obtained with the more simple linear model of Eq (4). Using this result we can now fit the observed CV2 that we expect to see; the fit describes well the observed data, as shown in the bottom panel of Fig 6 (and in the top left panel of S7 Fig in S1 File).
Finally, Section 6 of the S1 File investigates two more subtle technical points that one might think could affect the direct comparison of FCM measurements and microscopy measurement from growth in the microfluidic device. First, one could argue that the age-distributions of the population of cells in the microfluidic device and in a population that is growing exponentially (i.e. as used in the FCM) are different. That is, since in the microfluidic device some newborn daughters are constantly washed out of the growth channels, there are relatively fewer cells close to birth and more cells close to division in the microfluidic device than in a population undergoing exponential growth in bulk (S8 Fig in S1 File). Since total fluorescence correlates with cell size, which again correlates well with time since birth, the access of ‘old’ cells could in principle effect the distribution of total fluorescence one observes. However, as shown in Section 6.1 in S1 File, we derive theoretically that the effects of the altered age-distribution are small enough to be neglected (S9 Fig in S1 File). Second, since in the microfluidic setup we measure the fluorescence of a cell multiple times during its cell cycle, there are clearly substantial correlations between different measurements and one might wonder whether this could significantly affect the observed statistics. In Section 6.2 in S1 File we show that this effect is also negligible (S9 Fig in S1 File).
Correcting for autofluorescence and shot noise
After having estimated the mean and variance of the autofluorescence, and the strength of the FCM’s shot noise, we can now correct the measured means and variances of transcriptional reporters for these two components. Combining the autofluorescence contribution from Eq (1) and the shot noise component from Eq (3), we can write the measured intensity IM as
| (6) |
and the measured autofluorescence as
| (7) |
where variables with subscript T correspond to true values and variables with subscript M correspond to measured values, ϵ is again a Gaussian distributed variable with mean zero and variance δ2 and O is a constant offset. From these equations we find for the mean and variance of the measured intensities IM:
| (8a) |
and
| (8b) |
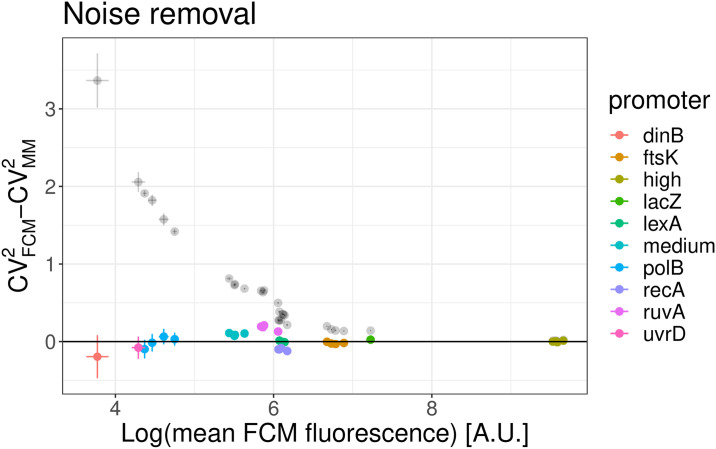
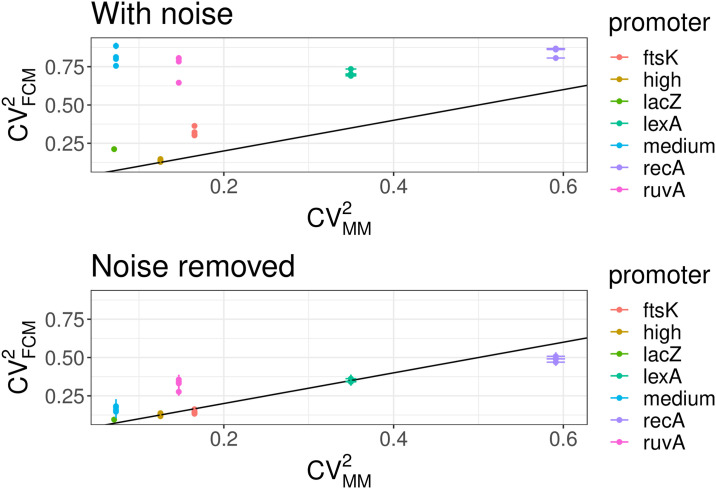
Using these expressions we calculated 〈IT〉, var(IT) and the resulting CV2 for a set of different E. coli promoters and compared the results with the CV2 measured for the same promoters in the microscopy setup. As shown in Fig 7, the estimated CV2 are much closer to the results obtained with the microscopy measurements and the difference no longer systematically depends on the mean expression level. In addition, whereas the CV2 of the raw FCM measurements show little correlation with the CV2 of the microscopy measurements, after correcting for autofluorescence and shot noise there is a much better agreement between the CV2 as measured by the FCM and microscopy (Fig 8).
Fig 7. Comparison of CV2 from FCM and microscope measurements after correcting for autofluorescence and shot noise.
Absolute difference of the CV2 of different transcriptional reporters of native and synthetic E. coli promoters as estimated from FCM and microscope measurements. The black transparent dots use uncorrected FCM measurements and reproduce Fig 6 in linear scale, while the colored dots are obtained when using the CV2 that are corrected for the FCM shot noise.
Fig 8. Correlation of CV2 in the FCM and microscope measurements before and after correcting for autofluorescence and shot noise.
Top: The CV2 of the raw FCM fluorescence measurements is consistently higher than the CV2 of fluorescence in the microscope measurements, and there is little correlation between the two. Bottom: Once the FCM measurements are corrected for autofluorescence and shot noise, there is now a good agreement between the CV2 as estimated by FCM and microscopy. Measurements for different promoters are indicated by different colors (see legend) and different points of the same color represent replicate FCM measurements. Only promoters expressing more than exp(4) above the background are shown and the black line in both plots is a line with slope 1 and intercept 0.
Estimating mean and variance of GFP concentration
As shown in Fig 3, microscopy measurements show a strong correlation between the size of the cells and total GFP of the cells, indicating that cell size variations are responsible for a large fraction of the variation in total GFP, and that GFP concentration fluctuates significantly less than total GFP. It would thus be desirable to be able to estimate the mean and variance of GFP concentrations from the FCM measurements as well. However, the fact there is a much weaker correlation between raw fluorescence and scatter measurements in FCM (Fig 3) suggests that it may be difficult to accurately estimate GFP concentrations for single cells. In particular, to estimate the GFP concentration of a single cell, we need to not only take the autofluorescence and shot noise of the fluorescence measurement into account, we also need to quantify how the cell’s volume relates to the forward- and side-scatter measurement, which is known to be very challenging.
Scattering signals are non-linear functions of cell size
The extent to which forward- and side-scatter measurements of FCMs can be used to estimate the size of the measured object is a topic of considerable debate in the flow cytometry literature. It is generally assumed that forward scatter mostly reflects cell size, and that side scatter reflects surface properties such as granularity [53]. Several previous studies have established that FCM can be successfully used to distinguish bacteria of different shapes and sizes [40–43], i.e. the average scattering of a population of cells reflects the average size of the cells in the population.
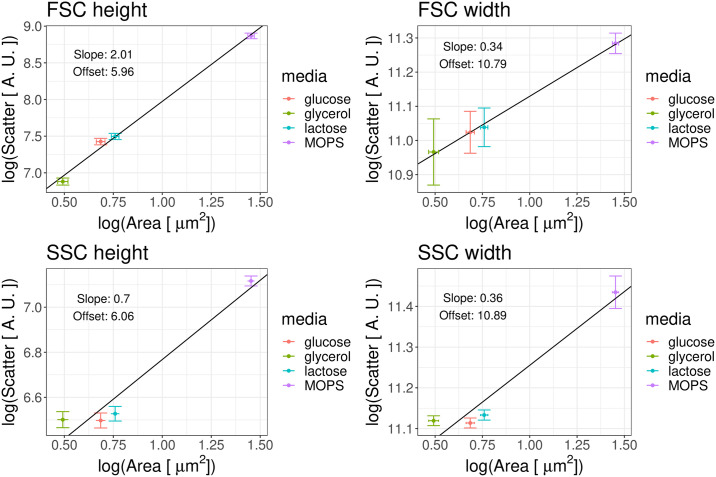
To confirm that, also within our setup, the average size of a population of cells can be inferred from averages of scatter measurements, we made use of flow cytometry measurements from a recent study from our lab in which E. coli cells were grown in a number of different conditions and cell sizes were measured using microscopy in each condition [31]. Notably, the growth-rate of the cells varied considerably across these conditions and E. coli cells are known to increase size with growth-rate. For each condition, we calculated both the average cell size from the microscopy measurements as well as the average height and width of both forward- and side-scatter.
As shown in Fig 9, we found a very good correlation between forward-scatter and cell size in each condition, confirming results from previous studies that average scatter can indeed be used to estimate average cell size. However, it should be noted that the observed relationship between cell size and scatter is highly non-linear. That is, whereas the height of the forward-scatter grows approximately quadratically with cell area, the width of the forward-scatter grows approximately as area to the power 1/3. Previous studies indicate that the mathematical relationship between cell size and scattering signal can be highly dependent on the specific experimental setup and is often at odds with predictions of mathematical theories of light scattering [8, 36, 37]. In [54] it is further shown that even if a particular non-linear relation between scattering and single-cell size can be established in a given setting, this relationship is not universal and it can vary even for bacteria of similar sizes and geometric properties. Thus, although we could here make use of the microscopy cell size measurements to calibrate the non-linear relationship between forward-scatter and cell size, it is highly doubtful that this relationship would apply in other settings.
Fig 9. Average forward- and side-scatter of cells show approximate power-law dependence on average cell size.
Each panels shows the average of the logarithm of one of the four scattering signals, i.e. height or width of either forward- (FSC) or side-scatter (SSC), as a function of the average logarithm of cell area for E. coli cells growing in different media (M9 + glucose, glycerol or lactose; MOPS + glucose, see legend) as measured by microscopy [31]. The error bars represent the standard errors of the mean over replicate experiments.
Scattering signals contain a substantial shot noise component
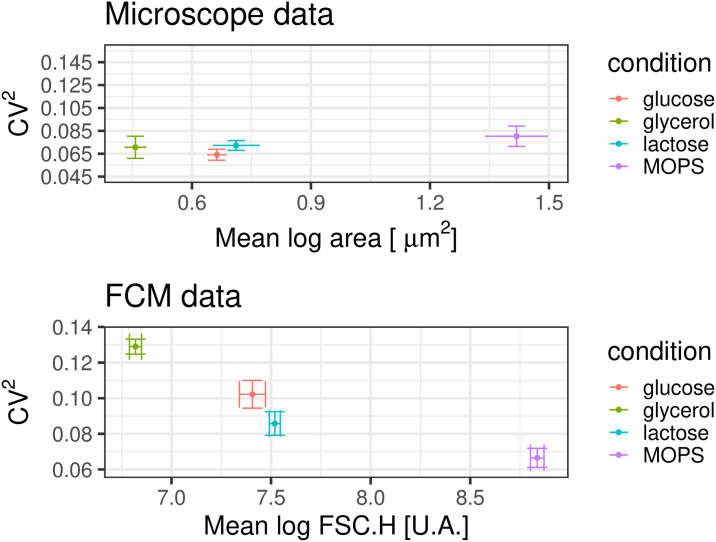
Moreover, in order to be able to estimate GFP concentrations in individual cells, we have to go beyond relating population averages of scatter and size, and estimate sizes of individual cells from the scattering measurements. Several previous studies have reported that it is difficult to use individual scattering measurements to measure variations of the sizes of single cells in a homogeneous population [35, 44–46]. To investigate this within our setup we focused on height of the forward scattering, since based on Fig 9 this signal most strongly correlates with cell size, calculated the CV2 of the scattering as a function of the average scatter, and compared this with the CV2 in cell area as a function of average cell area, as measured by microscope (Fig 10).
Fig 10. The CV2 of the scattering distribution is affected by shot noise.
Top panel: The CV2 of the cell areas as a function of mean cell area across growth conditions, as measured by microscopy. Bottom panel: The CV2 of the height of the forward scattering signal as function of the mean height of forward scattering across growth conditions, as measured by FCM. In both panels the colors corresponds to different growth media as indicated in the legend (M9 + glucose, M9 + glycerol or M9 + lactose, and MOPS + glucose).
We see that, whereas the microscopy measurements indicate that the CV2 in cell size is roughly equal in all conditions, the FCM measurements show a clear decrease of CV2 with mean, similarly to what was observed for the fluorescence signal. As the scatter signal is generated by converting a light signal into an electrical impulse, it is to be expected that scattering measurements are also affected by shot noise, and the results in Fig 10 confirm that this is the case. Thus, in order to estimate the variation in cell sizes from the forward-scatter signals, we not only have to take into account the non-linear relationship between scattering and size, but also the shot noise on the scattering measurements. However, in contrast to the situation with the fluorescence measurements, where we used the calibration beads to estimate the shot noise, we cannot use these beads for estimating the shot noise on the scattering measurements since these are strongly influenced by the geometry and material of the particles. Therefore, the relationship between size and scatter will likely be very different for the beads than for living cells.
In summary, both the complex non-linear relationship between scattering measurements and size, and the absence of a general procedure for estimating the size of the shot noise in the scattering measurements, make it very difficult to estimate the true variability of cell sizes using FCM measurements only. Consequently, we currently do not see a simple way for using FCM measurements to directly measure the GFP concentrations in individual cells.
FCM measurements can be used to quantify the relative sizes of variation in GFP concentrations of different genes
Although we do not believe that, absent of calibration with an independent measurement technology such as microscopy, it is possible to reliably estimate the true sizes of single cells using forward- and side-scattering measurements, FCM measurements can still be used to learn a great deal about the relative noise levels of different genes. Indeed, as confirmed in Fig 7, provided that autofluorescence and shot noise are taken into account, the CV2 of total fluorescence levels of different promoters can be estimated reasonably accurately from FCM fluorescence measurements. Given that each of these fluorescent promoter reporter constructs are embedded in identical cells growing in the same environment, these cells will all exhibit the same variation in cell sizes, so that the differences in CV2 in total fluorescence must reflect differences in the CV2 of the GFP concentrations for these reporter constructs.
Without loss of generality, the total GFP intensity I of a cell can be written as the product I = C ⋅ V of GFP concentration C and cell volume V, and we can additionally write C as the average concentration 〈C〉 plus a deviation δC, and similarly for volume:
| (9) |
where both δC and δV have average zero.
From the microscopy measurements we know that the fluctuations in the GFP concentration C are approximately independent of fluctuations in cell volume V (S10 Fig in S1 File). Using this, we can derive relationships between both the means and coefficients of variation of the total GFP I, and the concentration C and volume V, respectively. We find
| (10a) |
| (10b) |
We can use this to rewrite the coefficient of variation of concentration, in terms of the coefficient of variation of total GFP (which we have shown how to estimate) and the (unknown) coefficient of variation in cell size, i.e.
| (11) |
Thus, if the coefficient of variation of cell volume in the growth condition of interest can be estimated using independent measurements, then Eq (11) can be used to estimate the coefficient of variation of concentration in terms of the for total GFP, as given by Eq (8). Importantly, since the is the same for all reporter constructs, such a measurement would only have to be done once.
Lastly, even if the is not known, we note that it will be the same for each of the promoter reporter constructs. Therefore, the difference of the coefficients of variation in GFP for two promoters is directly proportional to the difference in coefficient of variation of total GFP, i.e.
| (12) |
Although this still depends on the , for all conditions we tested we found that , so that a reasonable estimate of the relative size of variation in concentrations is given by simply setting in the above equation.
Discussion
Although flow cytometry is an attractive technology for single-cell analysis of gene expression in high-throughput, we have shown that for data from bacterial cells there are a number of challenges to overcome in data analysis in order to obtain accurate quantification. We here developed a number of procedures for measuring single-cell expression distributions in bacteria using FCM data and implemented them in an R package called E-Flow.
We first analyzed the forward- and side-scatter signals and their correlation structure. There seems to be little agreement in the literature as to when to use forward-scatter or side-scatter and whether to use height, width or area. We showed that only width and height provide independent measurements and developed a Bayesian mixture model for separating viable cell measurements from debris and other outliers using the full 4-dimensional distribution of forward- and side-scatter measurements. In general the filter we developed is much broader than the very strict gating strategies that are sometimes used and typically only a small fraction of the events are discarded.
We next developed a Bayesian mixture model to estimate the mean and variance in single-cell fluorescences of a population of cells carrying a fluorescent reporter. However, by comparing of the means and variances estimated by FCM with the means and variances estimated from microscopy measurements of the same strains growing in the same conditions, we observed systematic differences because of two effects. First, the amount of autofluorescence per cell differs systematically between FCM and microscopy and we developed methods for estimating and removing the autofluorescence from the FCM measurements. We show that, after correcting for autofluorescence, there is a perfect agreement between the means of different reporters as estimated by FCM and microscopy, over the entire range of expression levels. However, FCM measurements systematically overestimate the variation in fluorescence levels due to shot noise in the FCM measurement. We developed a method to correct for the contribution of shot noise to the estimated variation that uses calibration beads to estimate the size of the FCM shot noise. We showed that, only after correcting for shot noise do gene expression noise measurements from the FCM converge to those obtained from microscopy measurements. Although the precise size of the shot noise and autofluorescence will likely vary between different flow cytometers, the methods we presented here are general, can be applied to data from any flow cytometer, and provide a step-by-step procedure for both estimating the size of autofluorescence and shot noise, and correcting for these components.
Finally, we investigated whether FCM can be used to directly measure the distribution of GFP concentration across cells by using forward- and side-scatter measurements to estimate the volumes of individual cells. In line with previous work, we show that because scattering measurements depend on cell size in a complex non-linear manner and contain a shot noise component that is difficult to calibrate, it is not possible to accurately estimate the fluctuations in volumes of single cells from scattering measurements. However, because GFP concentration and cell size fluctuate independently across cells, we showed that the relative sizes of GFP fluctuations for different reporter constructs can still be estimated from the variation of total GFP with reasonable accuracy.
Supporting information
(PDF)
Data Availability
No primary data were created for this study, and we refer to the articles from which the data used in our manuscript stem. Therefore, all relevant data are within the manuscript.
Funding Statement
This work was supported by the Swiss National Science Foundation in the form of a grant awarded to EvN (31003A 159673). Calculations were performed at sciCORE (http://scicore.unibas.ch/) scientific computing core facility of the University of Basel, and flow cytometry was performed at the FACS core facility of the Biozentrum. The funders had no role in study design, data collection and analysis, decision to publish, or preparation of the manuscript.
References
- 1. Elowitz MB, Levine AJ, Siggia ED, Swain PS. Stochastic gene expression in a single cell. Science. 2002;297(5584):1183–1186. 10.1126/science.1070919 [DOI] [PubMed] [Google Scholar]
- 2. Thattai M, van Oudenaarden A. Stochastic Gene Expression in Fluctuating Environments. Genetics. 2004;167(1):523–530. 10.1534/genetics.167.1.523 [DOI] [PMC free article] [PubMed] [Google Scholar]
- 3. Rosenfeld N, Young JW, Alon U, Swain PS, Elowitz MB. Gene Regulation at the Single-Cell Level. Science. 2005;307(5717):1962–1965. 10.1126/science.1106914 [DOI] [PubMed] [Google Scholar]
- 4. Raser JM, O’Shea EK. Noise in Gene Expression: Origins, Consequences, and Control. Science. 2005;309(5743):2010–2013. 10.1126/science.1105891 [DOI] [PMC free article] [PubMed] [Google Scholar]
- 5. Locke JCW, Elowitz MB. Using movies to analyse gene circuit dynamics in single cells. Nature Reviews Microbiology. 2009. 10.1038/nrmicro2056 [DOI] [PMC free article] [PubMed] [Google Scholar]
- 6. Balaban NQ, Merrin J, Chait R, Kowalik L, Leibler S. Bacterial Persistence as a Phenotypic Switch. Science. 2004;305(5690):1622–1625. 10.1126/science.1099390 [DOI] [PubMed] [Google Scholar]
- 7. Lidstrom ME, Konopka MC. The role of physiological heterogeneity in microbial population behavior. Nature Chemical Biology. 2010. 10.1038/nchembio.436 [DOI] [PubMed] [Google Scholar]
- 8. Davey HM, Kell DB. Flow cytometry and cell sorting of heterogeneous microbial populations: the importance of single-cell analyses. Microbiology and Molecular Biology Reviews. 1996;60(4):641–696. [DOI] [PMC free article] [PubMed] [Google Scholar]
- 9. Winson MK, Davey HM. Flow Cytometric Analysis of Microorganisms. Methods. 2000;21(3):231–240. 10.1006/meth.2000.1003 [DOI] [PubMed] [Google Scholar]
- 10. Chung JD, Stephanopoulos G, K I, D GA. Gene expression in single cells of Bacillus subtilis: evidence that a threshold mechanism controls the initiation of sporulation. Journal of bacteriology. 1994;176 10.1128/jb.176.7.1977-1984.1994 [DOI] [PMC free article] [PubMed] [Google Scholar]
- 11. Valdivia RH, Falkow S. Bacterial genetics by flow cytometry: rapid isolation of Salmonella typhimurium acid-inducible promoters by differential fluorescence induction. Mol Microbiol. 1996;22(2):367–378. 10.1046/j.1365-2958.1996.00120.x [DOI] [PubMed] [Google Scholar]
- 12. Wilson RL, Tvinnereim AR, Jones BD, Harty JT. Identification of Listeria monocytogenes in vivo-induced genes by fluorescence-activated cell sorting. Infect Immun. 2001;69(8):5016–5024. 10.1128/IAI.69.8.5016-5024.2001 [DOI] [PMC free article] [PubMed] [Google Scholar]
- 13. Ozbudak EM, Thattai M, Kurtser I, Grossman AD, van Oudenaarden A. Regulation of noise in the expression of a single gene. Nat Genet. 2002;31(1):69–73. 10.1038/ng869 [DOI] [PubMed] [Google Scholar]
- 14. Hakkila K, Maksimow M, Rosengren A, Karp M, Virta M. Monitoring promoter activity in a single bacterial cell by using green and red fluorescent proteins. J Microbiol Methods. 2003;54(1):75–79. 10.1016/S0167-7012(03)00008-3 [DOI] [PubMed] [Google Scholar]
- 15. Sevastsyanovich Y, Alfasi S, Overton T, Hall R, Jones J, Hewitt C, et al. Exploitation of GFP fusion proteins and stress avoidance as a generic strategy for the production of high-quality recombinant proteins. FEMS Microbiology Letters. 2009;299(1):86–94. 10.1111/j.1574-6968.2009.01738.x [DOI] [PubMed] [Google Scholar]
- 16. Miao H, Ratnasingam S, Pu CS, Desai MM, Sze CC. Dual fluorescence system for flow cytometric analysis of Escherichia coli transcriptional response in multi-species context. J Microbiol Methods. 2009;76(2):109–119. 10.1016/j.mimet.2008.09.015 [DOI] [PubMed] [Google Scholar]
- 17. Kinney JB, Murugan A, Callan CG, Cox EC. Using deep sequencing to characterize the biophysical mechanism of a transcriptional regulatory sequence. Proc Natl Acad Sci USA. 2010;107(20):9158–9163. 10.1073/pnas.1004290107 [DOI] [PMC free article] [PubMed] [Google Scholar]
- 18. Anand R, Rai N, Thattai M. Promoter reliability in modular transcriptional networks. Meth Enzymol. 2011;497:31–49. 10.1016/B978-0-12-385075-1.00002-0 [DOI] [PubMed] [Google Scholar]
- 19. Silander OK, Nikolic N, Zaslaver A, Bren A, Kikoin I, Alon U, et al. A Genome-Wide Analysis of Promoter-Mediated Phenotypic Noise in Escherichia coli. PLOS Genetics. 2012;8(1):1–13. 10.1371/journal.pgen.1002443 [DOI] [PMC free article] [PubMed] [Google Scholar]
- 20. Madar D, Dekel E, Bren A, Zimmer A, Porat Z, Alon U. Promoter activity dynamics in the lag phase of Escherichia coli. BMC Syst Biol. 2013;7:136 10.1186/1752-0509-7-136 [DOI] [PMC free article] [PubMed] [Google Scholar]
- 21. Sanchez-Romero MA, Casadesus J. Contribution of phenotypic heterogeneity to adaptive antibiotic resistance. Proc Natl Acad Sci USA. 2014;111(1):355–360. 10.1073/pnas.1316084111 [DOI] [PMC free article] [PubMed] [Google Scholar]
- 22. Utratna M, Cosgrave E, Baustian C, Ceredig RH, O’Byrne CP. Effects of growth phase and temperature on IfB activity within a Listeria monocytogenes population: evidence for RsbV-independent activation of IfB at refrigeration temperatures. Biomed Res Int. 2014;2014:641647 10.1155/2014/641647 [DOI] [PMC free article] [PubMed] [Google Scholar]
- 23. Wolf L, Silander OK, van Nimwegen E. Expression noise facilitates the evolution of gene regulation. eLife. 2015;4:e05856 10.7554/eLife.05856 [DOI] [PMC free article] [PubMed] [Google Scholar]
- 24. Baert J, Kinet R, Brognaux A, Delepierre A, Telek S, Sörensen SJ, et al. Phenotypic variability in bioprocessing conditions can be tracked on the basis of on-line flow cytometry and fits to a scaling law. Biotechnol J. 2015;10(8):1316–1325. 10.1002/biot.201400537 [DOI] [PubMed] [Google Scholar]
- 25. Yan Q, Fong SS. Study of in vitro transcriptional binding effects and noise using constitutive promoters combined with UP element sequences in Escherichia coli. J Biol Eng. 2017;11:33 10.1186/s13036-017-0075-2 [DOI] [PMC free article] [PubMed] [Google Scholar]
- 26. Nordholt N, van Heerden J, Kort R, Bruggeman FJ. Effects of growth rate and promoter activity on single-cell protein expression. Sci Rep. 2017;7(1):6299 10.1038/s41598-017-05871-3 [DOI] [PMC free article] [PubMed] [Google Scholar]
- 27. Rohlhill J, Sandoval NR, Papoutsakis ET. Sort-Seq Approach to Engineering a Formaldehyde-Inducible Promoter for Dynamically Regulated Escherichia coli Growth on Methanol. ACS Synth Biol. 2017;6(8):1584–1595. 10.1021/acssynbio.7b00114 [DOI] [PMC free article] [PubMed] [Google Scholar]
- 28. Razo-Mejia M, Barnes SL, Belliveau NM, Chure G, Einav T, Lewis M, et al. Tuning Transcriptional Regulation through Signaling: A Predictive Theory of Allosteric Induction. Cell Syst. 2018;6(4):456–469. 10.1016/j.cels.2018.02.004 [DOI] [PMC free article] [PubMed] [Google Scholar]
- 29. Belliveau NM, Barnes SL, Ireland WT, Jones DL, Sweredoski MJ, Moradian A, et al. Systematic approach for dissecting the molecular mechanisms of transcriptional regulation in bacteria. Proc Natl Acad Sci USA. 2018;115(21):E4796–E4805. 10.1073/pnas.1722055115 [DOI] [PMC free article] [PubMed] [Google Scholar]
- 30. Bahrudeen MNM, Chauhan V, Palma CSD, Oliveira SMD, Kandavalli VK, Ribeiro AS. Estimating RNA numbers in single cells by RNA fluorescent tagging and flow cytometry. J Microbiol Methods. 2019;166:105745 10.1016/j.mimet.2019.105745 [DOI] [PubMed] [Google Scholar]
- 31. Urchueguía A, Galbusera L, Bellement G, Julou T, van Nimwegen E. Noise propagation shapes condition-dependent gene expression noise in Escherichia coli. BioRxiv. 2019. 10.1101/795369 [DOI] [PMC free article] [PubMed] [Google Scholar]
- 32. Acar M, Mettetal JT, van Oudenaarden A. Stochastic switching as a survival strategy in fluctuating environments. Nat Genet. 2008;40(4):471–475. 10.1038/ng.110 [DOI] [PubMed] [Google Scholar]
- 33. Carey LB, van Dijk D, Sloot PM, Kaandorp JA, Segal E. Promoter sequence determines the relationship between expression level and noise. PLoS Biol. 2013;11(4):e1001528 10.1371/journal.pbio.1001528 [DOI] [PMC free article] [PubMed] [Google Scholar]
- 34. Veal DA, Deere D, Ferrari B, Piper J, Attfield PV. Fluorescence staining and flow cytometry for monitoring microbial cells. Journal of Immunological Methods. 2000;243(1):191–210. 10.1016/S0022-1759(00)00234-9 [DOI] [PubMed] [Google Scholar]
- 35. Ambriz-Avina V, Contreras-Garduno JA, Pedraza-Reyes M. Applications of Flow Cytometry to Characterize Bacterial Physiological Responses. J BioMed Research International. 2014. 10.1155/2014/461941 [DOI] [PMC free article] [PubMed] [Google Scholar]
- 36. Nebe-von Caron G. Standardization in microbial cytometry. Cytometry Part A. 2009;75A(2):86–89. 10.1002/cyto.a.20696 [DOI] [PubMed] [Google Scholar]
- 37. Müller S, Nebe-von Caron G. Functional single-cell analyses: flow cytometry and cell sorting of microbial populations and communities. FEMS Microbiology Reviews. 2010;34(4):554–587. 10.1111/j.1574-6976.2010.00214.x [DOI] [PubMed] [Google Scholar]
- 38. Taniguchi Y, Choi PJ, Li GW, Chen H, Babu M, Hearn J, et al. Quantifying E. coli Proteome and Transcriptome with Single-Molecule Sensitivity in Single Cells. Science. 2010;329(5991):533–538. 10.1126/science.1188308 [DOI] [PMC free article] [PubMed] [Google Scholar]
- 39. Yang L, Zhou Y, Zhu S, Huang T, Wu L, Yan X. Detection and Quantification of Bacterial Autofluorescence at the Single-Cell Level by a Laboratory-Built High-Sensitivity Flow Cytometer. Analytical Chemistry. 2012;84(3):1526–1532. 10.1021/ac2031332 [DOI] [PubMed] [Google Scholar]
- 40. Akerlund T, Nordström K, Bernander R. Analysis of cell size and DNA content in exponentially growing and stationary-phase batch cultures of Escherichia coli. J Bacteriol. 1995. 10.1128/JB.177.23.6791-6797.1995 [DOI] [PMC free article] [PubMed] [Google Scholar]
- 41. Steen HB, Boye E. Escherichia coli growth studied by dual-parameter flow cytophotometry. Journal of Bacteriology. 1981;145(2):1091–1094. 10.1128/JB.145.2.1091-1094.1981 [DOI] [PMC free article] [PubMed] [Google Scholar]
- 42. Stepanauskas R, Fergusson EA, Brown J, Poulton NJ, Tupper B, Labonté JM, et al. Improved genome recovery and integrated cell-size analyses of individual uncultured microbial cells and viral particles. Nature Communications. 2017. 10.1038/s41467-017-02128-5 [DOI] [PMC free article] [PubMed] [Google Scholar]
- 43. Volkmer B, Heinemann M. Condition-Dependent Cell Volume and Concentration of Escherichia coli to Facilitate Data Conversion for Systems Biology Modeling. PLOS ONE. 2011;6(7):1–6. 10.1371/journal.pone.0023126 [DOI] [PMC free article] [PubMed] [Google Scholar]
- 44. Christensen H, Bakken LR, Olsen RA. Soil bacterial DNA and biovolume profiles measured by flow-cytometry. FEMS Microbiology Ecology. 1993;11(3-4):129–140. 10.1111/j.1574-6968.1993.tb05804.x [DOI] [Google Scholar]
- 45. Vives-Rego J, López-Amorós R, Comas J. Flow cytometric narrow-angle light scatter and cell size during starvation of Escherichia coli in artificial sea water. Letters in Applied Microbiology. 1994;19(5):374–376. 10.1111/j.1472-765X.1994.tb00479.x [DOI] [Google Scholar]
- 46. López-Amorós R, Comas J, Carulla C, Vives-Rego J. Variations in flow cytometric forward scatter signals and cell size in batch cultures of Escherichia coli. FEMS Microbiology Letters. 1994;117(2):225–229. 10.1111/j.1574-6968.1994.tb06769.x [DOI] [PubMed] [Google Scholar]
- 47. Kaiser M, Jug F, Julou T, Deshpande S, Pfohl T, Silander O, et al. Monitoring single-cell gene regulation under dynamically controllable conditions with integrated microfluidics and software. Nature Communications. 2018;9 10.1038/s41467-017-02505-0 [DOI] [PMC free article] [PubMed] [Google Scholar]
- 48. Zaslaver A, Bren A, Ronen M, Itzkovitz S, Kikoin I, Shavit S, et al. A comprehensive library of fluorescent transcriptional reporters for Escherichia coli. Nature Methods. 2006;3 10.1038/nmeth895 [DOI] [PubMed] [Google Scholar]
- 49. Gama-Castro S, Salgado H, Santos-Zavaleta A, Ledezma-Tejeida D, Muñiz-Rascado L, García-Sotelo JS, et al. RegulonDB version 9.0: high-level integration of gene regulation, coexpression, motif clustering and beyond. Nucleic Acids Research. 2015;44(D1):D133–D143. 10.1093/nar/gkv1156 [DOI] [PMC free article] [PubMed] [Google Scholar]
- 50.BD™ Cytometer Setup and Tracking Beads;. http://www.bdbiosciences.com/ds/is/tds/23-9141.pdf.
- 51.Verwer B. BD FACSDiVa Option. White Paper;. http://www.bdbiosciences.com/ds/is/others/23-6579.pdf.
- 52.Eberhardt EH. Noise in photmultiplier tubes. IEEE. 1967.
- 53. Shapiro HM. Practical Flow Cytometry. 34th ed John Wiley and Sons; 2003. [Google Scholar]
- 54. Julià O, Comas J, Vives-Rego J. Second-order functions are the simplest correlations between flow cytometric light scatter and bacterial diameter. Journal of Microbiological Methods. 2000;40(1):57–61. 10.1016/S0167-7012(99)00132-3 [DOI] [PubMed] [Google Scholar]


