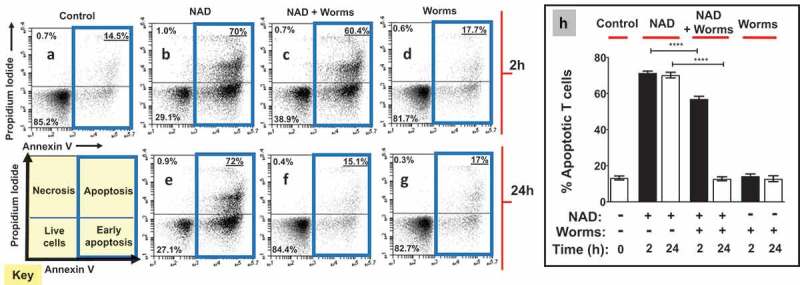
Figure 2.

Adult worms prevent NAD induced T cell death (NICD) in vitro. Panels athrough gare representative (from one run) flow cytometry dot plots of purified T cells following various experimental treatments (described below) and panel h(right) represents composite data showing the mean percent total apoptotic T cells (± SEM) following these treatments in replicate. NAD was incubated at 37°C for 2 or 24 h with (panels cand f) or without (panels band e) adult schistosome parasites (male and female pairs). Equivalent amounts of NAD (25 µM, based on initial concentration) were added to cultures of purified T cells (2.5x10⁵cells/tube) for 30 min. Cells were then stained and subjected to flow cytometry. Controls include T cells incubated without NAD (Control, panel a) as well as cells incubated with worm culture medium that did not contain NAD (Worms, panels dand g). The “Key” at lower left indicates the cell status in each FACS plot quadrant (“live”, “early apoptotic”, “apoptotic” and “necrotic”). Panels b- dshow samples tested after the 2 h incubation period and panels e- gafter the 24 h incubation period. Of primary interest here, the percentages of total apoptotic cells (i.e. early plus late apoptosis; right upper and lower quadrants) are bounded by blue boxes in panels a- g. ****p < 0.0001 NAD v NAD + worms (one-way ANOVA at each time point), n ≥ 4 in each case.
