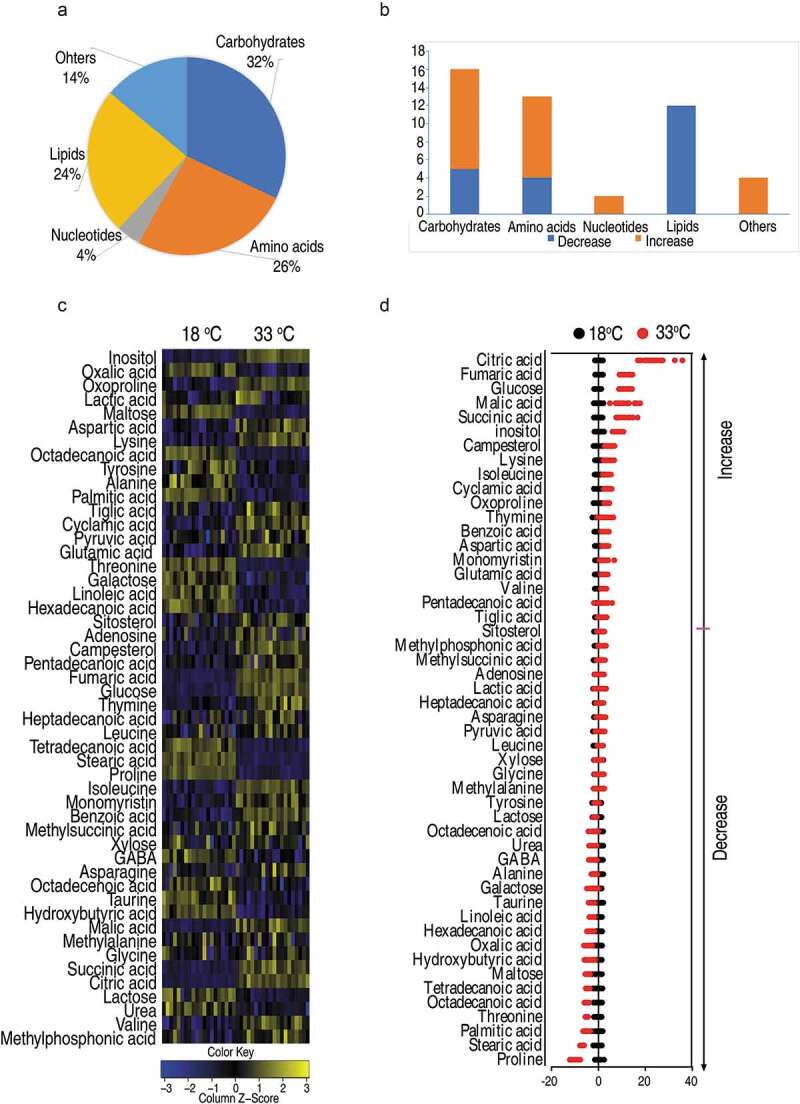
Figure 2.

Crucian carp had different metabolomics profiling when cultured at different temperatures.
(a) Categories of the differential metabolites. (b) The number of differential abundance of metabolites in each category. Blue or orange indicates a decrease or increase in the abundance of metabolites, respectively. (c) Heat map of unsupervised hierarchical clustering of differential metabolites (row). Yellow and blue indicate the increase and decrease of the metabolites scaled to mean and standard deviation of row metabolite level, respectively (see color scale). (d) Z scores (standard deviation from average) of 33°C-group to 18°C-group which are corresponding to the data shown in (c). Each point represents one technical repeat of metabolite.
