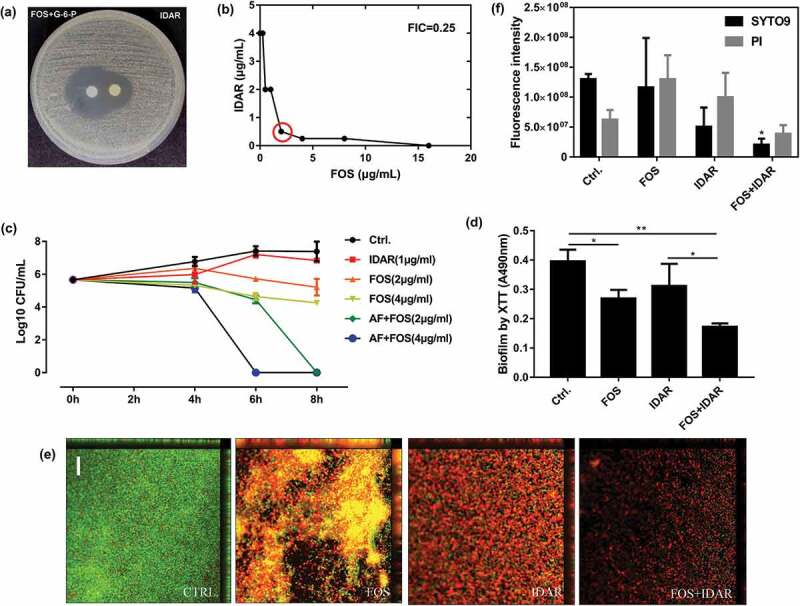
Figure 4.

Synergistic effects between IDAR and FOS against MRSA planktonic cells and biofilms. (a) Drug interaction determined by a disk diffusion assay. (b) Drug interaction determined by a checkerboard assay. The red circle indicates the optimal combination with the lowest FICI. (c) Time-kill curve of drugs in combination or used alone. (d) Antibiofilm effects by IDAR and FOS alone or in combination demonstrated by XTT staining. (e) Representative CLSM images of antibiofilm effects of IDAR and FOS alone or in combination.
