. 2020 Sep 14;9:e60482. doi: 10.7554/eLife.60482

Figure 1. Overall structure of the 70S ribosome and cryo-EM map quality.

(A) Cutaway view through the local resolution map of the 70S ribosome reconstruction. (B) Base pair density in the cores of the 30S (left) and 50S (right) ribosomal subunits. Examples demonstrate the overall high resolution of base pairs and nearby solvation and Mg2+ sites. B factors of −15 Å2 and −10 Å2 were applied to the RELION post-processed 50S subunit and 30S subunit head-focused maps, respectively. (C) Nucleotide ribose in the core of the 30S subunit (left) and 50S subunit (right). A B factor of −10 Å2 was applied to the 30S subunit density after post-processing. (D) Cryo-EM density of the 50S subunit showing the polyamine spermidine.

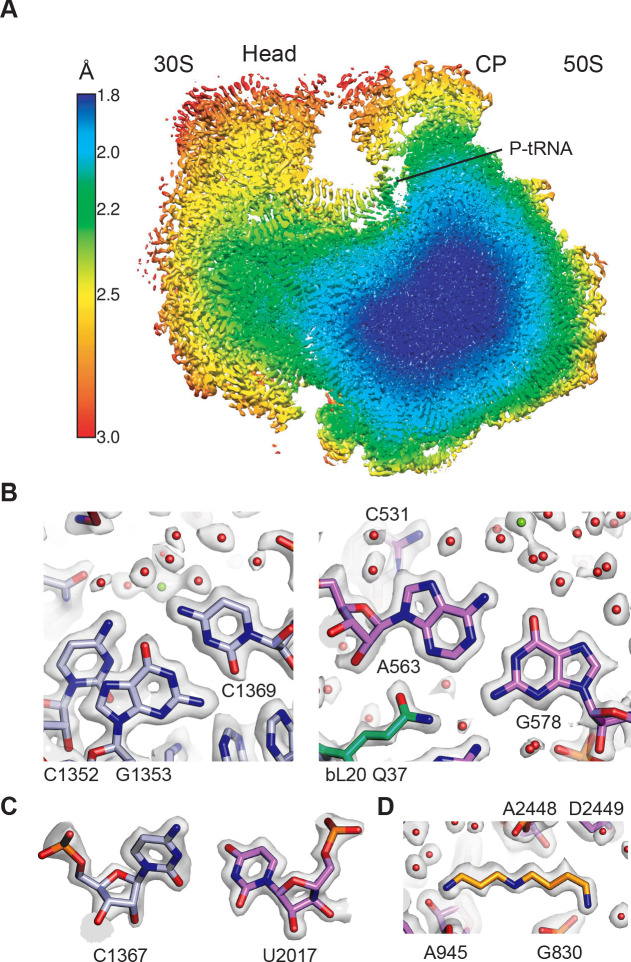
Figure 1.

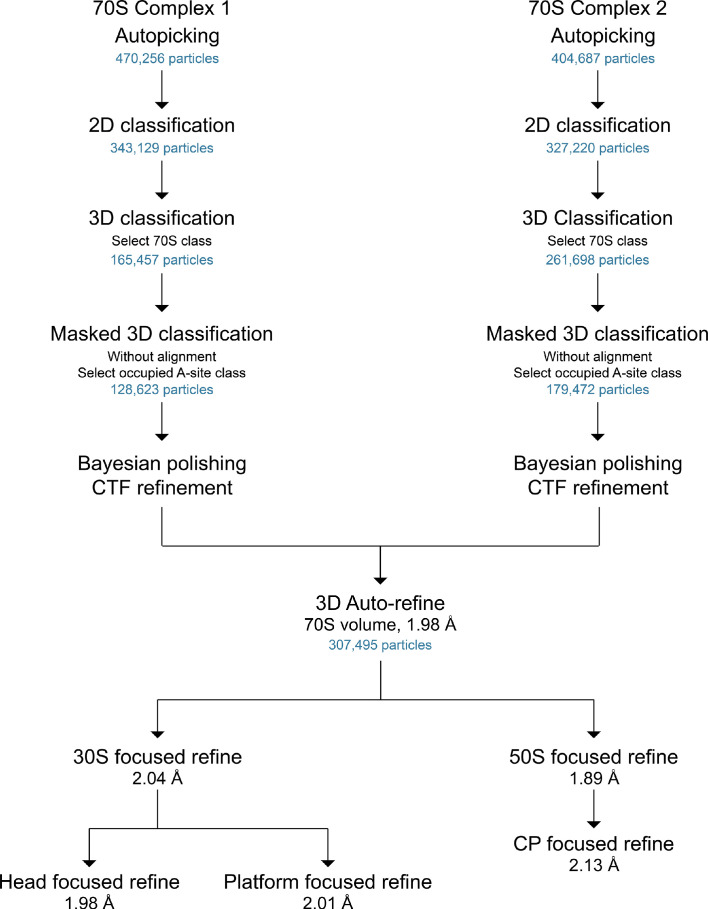
Figure 1—figure supplement 1. General scheme of cryo-EM data processing workflow.

Figure 1—figure supplement 1.

The number of particles at each stage is shown, as well as the final resolutions as defined by half-map FSCs (cutoff of 0.143).
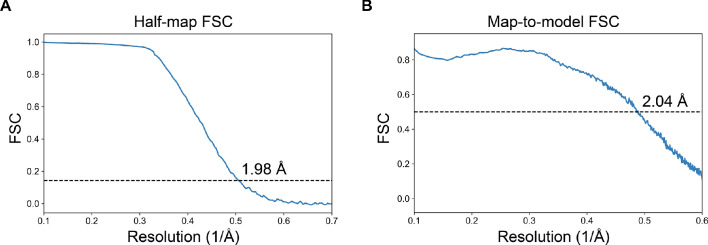
Figure 1—figure supplement 2. Fourier shell correlations for cryo-EM maps of the 70S ribosome.

Figure 1—figure supplement 2.

(A) Half-map FSC curve for the 70S ribosome is shown. The ‘gold-standard’ cutoff value for resolution (0.143) is indicated. (B) The map-to-model FSC curve for the 70S ribosome, with an overall resolution indicated at an FSC value of 0.5.
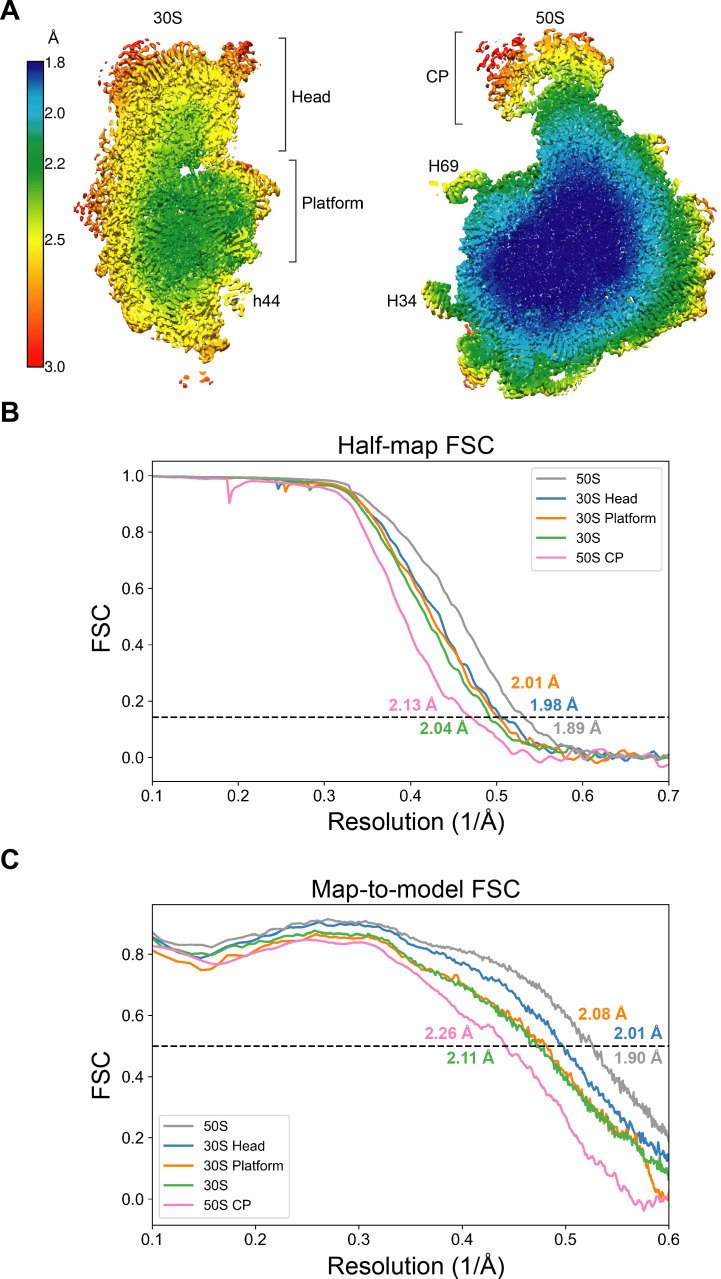
Figure 1—figure supplement 3. Resolution of maps of the 30S and 50S ribosomal subunits.

Figure 1—figure supplement 3.

(A) Local resolution of the 30S and 50S subunits. Brackets indicate regions masked for further focused refinement. 16S rRNA helix h44 and 23S rRNA helices H34 and H69 are also labeled. (B) Half-map FSC curves for focused-refined maps of the 50S subunit, 30S subunit, 50S central protuberance, 30S subunit head domain, and 30S subunit platform are shown. The ‘gold-standard’ cutoff value for resolution (0.143) is indicated in each graph. (C) The map-to-model FSC curves for the focused-refined maps of the 50S subunit, 30S subunit, 50S central protuberance, 30S subunit head domain, and 30S subunit platform are shown.
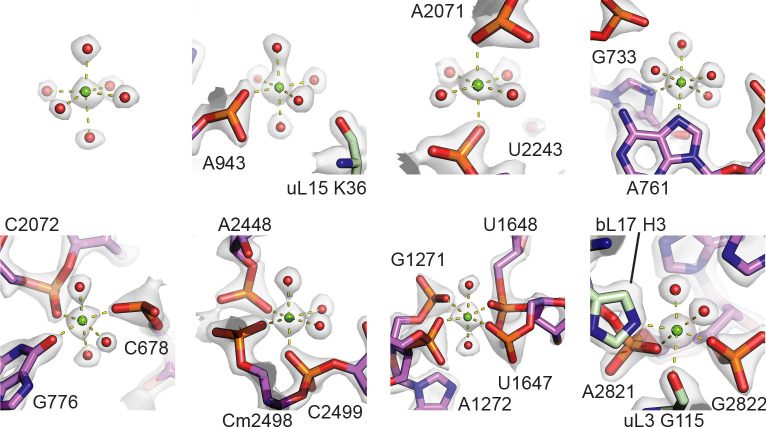
Figure 1—figure supplement 4. Gallery of Mg2+ coordination states observed in the 50S subunit.

Figure 1—figure supplement 4.

Examples include magnesium ions with different levels of direct coordination to the rRNA or proteins. The fully-hydrated Mg2+ is located near 23S rRNA nucleotide A973.
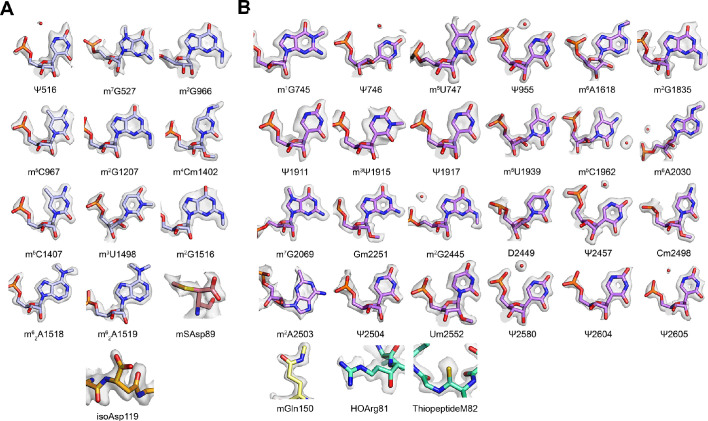
Figure 1—figure supplement 5. Gallery of post-transcriptionally modified nucleotides and post-translationally modified amino acids.

Figure 1—figure supplement 5.

(A) Post-transcriptionally modified nucleotides and post-translationally modified amino acids in the 30S subunit. The density for m7G527 and mSAsp89 is contoured at a lower level to show the presence of the modifications. (B) Post-transcriptionally modified nucleotides and post-translationally modified amino acids in the 50S subunit. In panel A, nucleotides m7G527 and m62A1519 appear hypomodified, when compared to m7G2069 in 23S rRNA, and when compared to other methylated nucleobases and m62A1518 in 16S rRNA.
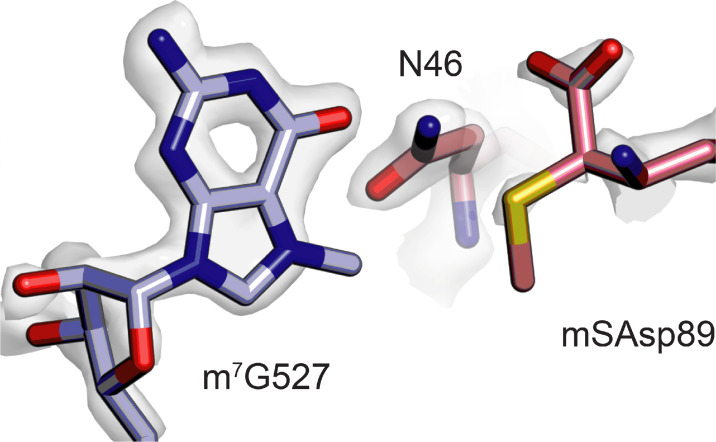
Figure 1—figure supplement 6. Close proximity of m7G527 in 16S rRNA and β-methylthio-Asp89 in uS12.

Figure 1—figure supplement 6.

Both m7G527 (light purple) and β-methylthio-Asp89 in uS12 (pink) appear hypomodified based on the cryo-EM map contour level required to enclose adjacent atoms and residues.
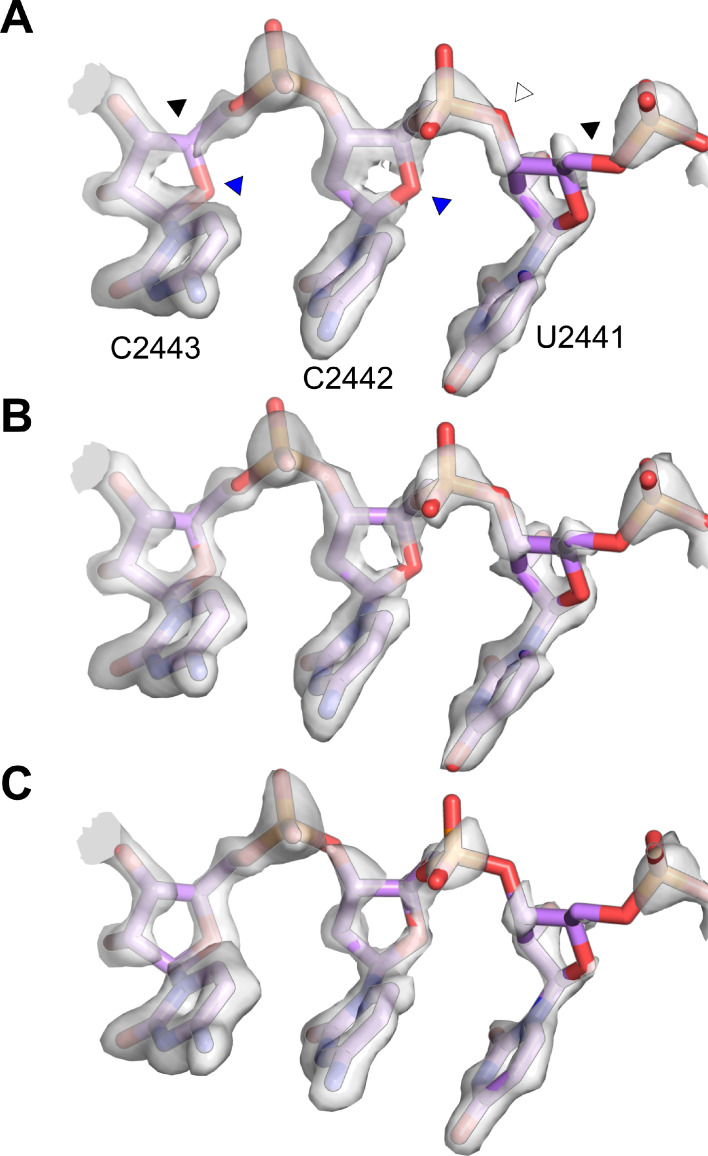
Figure 1—figure supplement 7. Weak RNA backbone density in the 50S subunit.

Figure 1—figure supplement 7.

(A) Map around nucleotides C2443, C2442, and U2441 of the 50S subunit in a reconstruction from frames 1–2 of the exposure, corresponding to the first ~2 electrons per Å2. The same nucleotides are shown for the first three frames (~3 electrons per Å2) (B) and the final 50S-focused, Ewald sphere-corrected map with all frames included (~40 electrons per Å2, with dose weighting) (C). Some features persist in all three reconstructions, for instance, the break between C3’ and C4’ in C2443 or between C5’ and O5’ in U2441 (indicated with black triangles). Some features become less connected with longer exposure (e.g. O3’ in C2441, indicated with a white triangle), while others appear improved with longer exposure (e.g. O4’ in C2443 and C2442, indicated with blue triangles).