. 2020 Sep 14;9:e60482. doi: 10.7554/eLife.60482

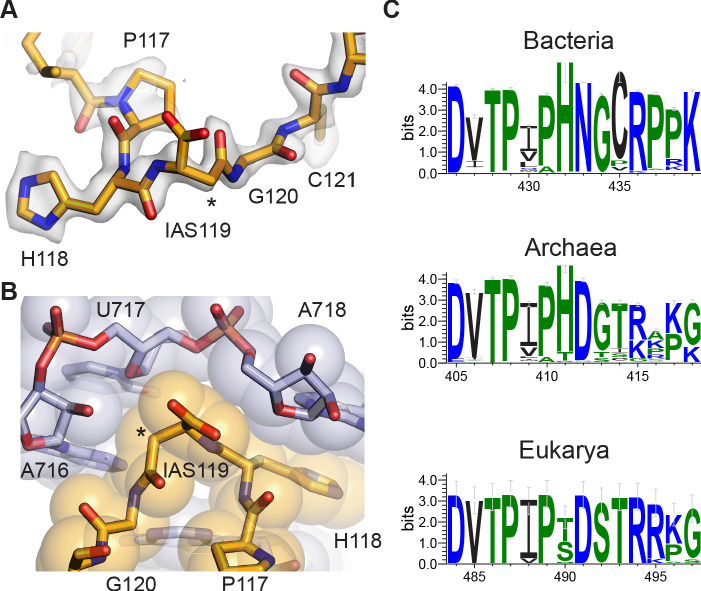
Figure 4. Isoaspartyl residue in protein uS11.

(A) Model of isoAsp at residue position 119 in uS11, with nearby residues and cryo-EM density from the 30S subunit platform-focused refinement. Weak density for the carboxylate is consistent with the effects of damage from the electron beam. The asterisk indicates the position of the additional backbone methylene group. (B) Shape complementarity between uS11 and 16S rRNA nucleotides surrounding IsoAsp119. 16S rRNA is shown in light purple and uS11 in orange, with atomistic coloring for the stick model. (C) Sequence logos of conserved amino acids spanning the putative isoAsp residue in all three domains of life.

Figure 4.

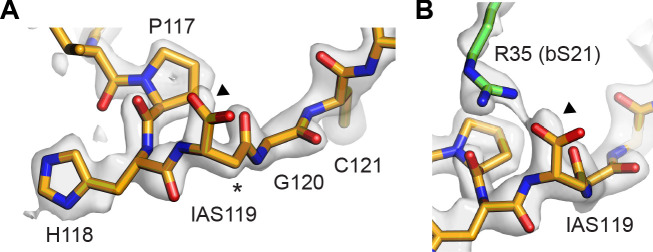
Figure 4—figure supplement 1. Cryo-EM density for uS11 based on early movie frames.

Figure 4—figure supplement 1.

Frames 1–3 of the acquired movies were used to calculate a 30S focused-refined cryo-EM map. (A) The model of isoaspartate 119 in uS11 and neighboring amino acids is shown in the density. The arrow points to the isoaspartate sidechain density, and the asterisk indicates the position of the additional backbone methylene group. The map-to-model resolution for the 30S subunit in this map was 2.45 Å and GS-FSC resolution was 2.26 Å. (B) An alternative view of isoaspartate sidechain in uS11 (orange) showing interaction with R35 of protein bS21 (green).
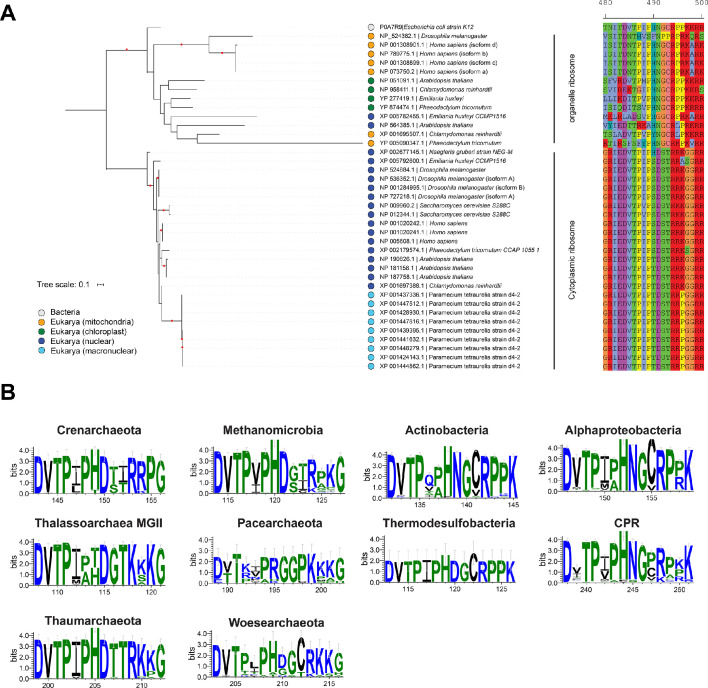
Figure 4—figure supplement 2. Conservation of residues near the isoAsp residue in uS11 homologs.

Figure 4—figure supplement 2.

(A) Phylogenetic tree of the uS11 ribosomal proteins in eukaryotes, including both cytoplasmic and organelle examples, along with Escherichia coli and the amino acids around the PHNG motif. The maximum likelihood tree was constructed under an LG+G4 model of evolution. Nodes with bootstrap values ≥ 85 are indicated by red circles. Scale bar indicates the average substitutions per site. (B) Sequence conservation in uS11 homologs in different bacterial and archaeal phyla.
Figure 4—figure supplement 3. Structural models for isoaspartate in archaeal and eukaryotic ribosomes.
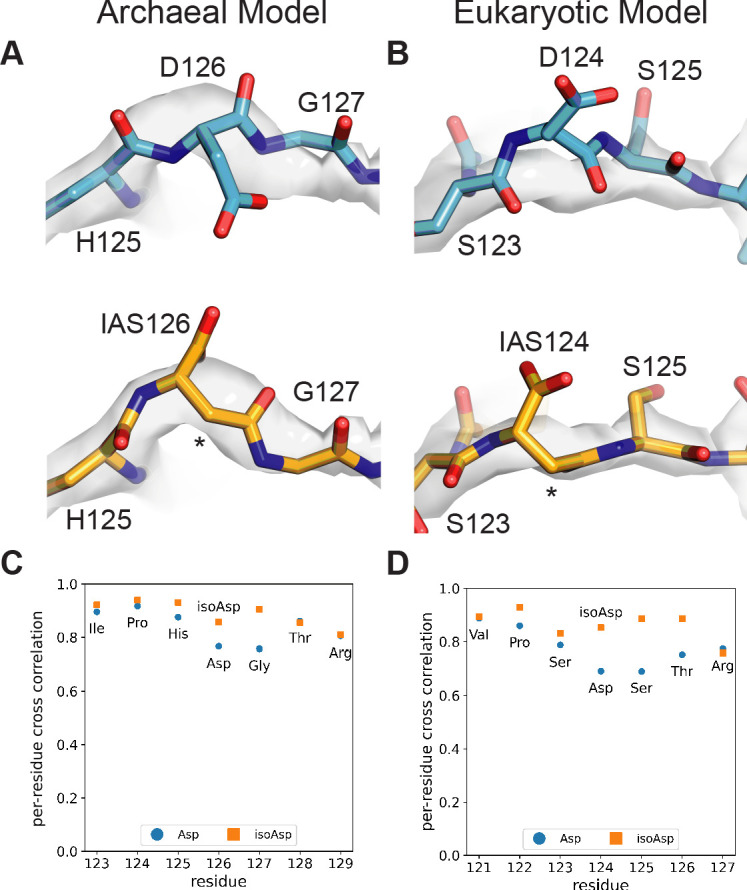
Figure 4—figure supplement 3.

Comparisons of published uS11 models (blue) in the archaeal (Nürenberg-Goloub et al., 2020) (A) and eukaryotic (Tesina et al., 2020) ribosomes (B) with models incorporating the IsoAsp modification (yellow-orange), real-space refined into the corresponding published maps. (C) Real-space correlations of models refined into the archaeal 30S subunit cryo-EM map, on a per-residue basis. (D) Real-space correlations of models refined into the eukaryotic ribosome cryo-EM map.