

Abstract
Pear juice concentrate (PJC) can be used as a natural sweetener in various processed foods. In this study, sesame bars were manufactured by adding PJC and rice syrup at mixing ratios of 0:30 (G-0), 1:29 (G-1), 3:27 (G-3), and 5:25 (G-5), and the bars were investigated for their physiochemical properties, antioxidants, morphology, and sensory attributes. Addition of PJC at more than 3% increased a* and b* values of bars, decreased cohesiveness, hardness, and compactness, and made the bars malleable. Antioxidants, sugars, and organic acids in the sesame bars increased significantly with a corresponding increase in PJC level from 1 to 5%. Prominent changes in functional groups and corresponding spectral characteristics were observed in sesame bars with 5% PJC. Lower PJC levels produced a compacted morphology, bars with more than 5% PJC exhibited a dented structure. Based on the sensory properties, sesame bars with PJC (3%) showed excellent overall acceptability.
Electronic supplementary material
The online version of this article (10.1007/s13197-020-04494-3) contains supplementary material, which is available to authorized users.
Keywords: Pear juice concentrate, Sesame bars, Natural sweetener, Physicochemical characteristics, Sensory evaluation
Introduction
Nowadays, consumption of ready-to-eat foods, such as fast food and snacks has increased tremendously owing to modern life style. Among different types of snacks, sesame bars are gaining great interest on a global level, including Korea, Japan and China because of their nutritional balance and convenient consumption. Usually, sesame and sugar are used to prepare sesame bars. Sugar is used in cereal bars as a major ingredient to impart sweetness and improve texture (Jingrong et al. 2016). Among various types of sweeteners and sugars, rice syrup (RS), which is rich in sweetening compounds, is produced as a result of starch breakdown by saccharifying enzymes. RS comprises of low moisture content and is widely employed as a sugar substitute, confectionery item, and sweetener in the Korea to sweeten foodstuffs. For preparation of sesame bars, RS is generally used in combination with a high amount of other sweeteners like white sugar, glucose syrup, and high fructose corn syrup to improve sweetness profile. However, RS in synergy with other sweeteners does not always produce a desirable taste. Moreover, these sweeteners are usually extracted from beet root or starch or are obtained by refining processes. Refined sugars have been classified as white/potential poisons owing to their adverse effects on physiological processes in human body. Such sugars provide only empty calories and lack other nutrients and minerals. Thus, intake of refined sugar should be limited, and foods that provide carbohydrates in a more complex form should be preferred. Consumers have now become aware, resulting in increased health consciousness, and the demand for products based on natural sweeteners has increased in recent years. It was hypothesized that pear juice concentrate (PJC) prepared from pear fruit as a natural ingredient provides strong sweetness, improves the functionality of products, and imparts sensory attributes like flavor and taste. Moreover, many published reports revealed that the pear contains various phenolic compounds with strong antioxidant and coloring properties (Jiang et al. 2016a, b).
Pears can be processed to produce a concentrate by pressing and filtering of pear fruits followed by prolonged heating until the soluble solid content reaches almost 80°Brix. In this regard two different terms are applicable in the industry: soft and hard PJC. From an industrial perspective, ‘soft’ PJC refers to the juice concentrate prepared from ripened pears, whereas PJC obtained from the processing of raw pear fruits is termed as ‘hard’ PJC (Pilando and Wrolstad 1992). Both hard and soft PJC samples have been reported to exhibit low sucrose content, whereas sorbitol content has been found to be considerably higher in hard PJC than in soft PJC (Pilando and Wrolstad 1992). Therefore, PJC could be used in preparation of beverages, confectionary, bakery products, etc.
Here, PJC was added to sesame bars at different mixing ratios with RS to obtain desirable sweetness and taste profiles. There are no published reports available on usage of PJC as a natural sweetener along with RS for production of sesame bars. Therefore, this study aimed to evaluate PJC as a sugar substitute in manufacturing sesame bars and to determine the color, texture, antioxidant activities, free sugar, organic acids, functional groups, morphology, and sensory characteristics of resulting sesame bars.
Materials and methods
Materials
The pear (Pyrus pyrifolia Nakai ‘Hwasan’) used in this experiment was purchased from a farmhouse located in Gyeongsangbuk-do, South Korea, stored at 4 °C, and further used for the preparation of juice concentrate. Sesame, cane sugar, and RS were purchased from local market in Gwangju, South Korea.
Preparation of PJC
After washing, pears were divided into quarters, put into a juice extractor (JRC001, Koryeo Industry, Seoul, Korea) in unpeeled form, and pear juice was obtained by applying 130 MPa pressure for 3 min. The extracted juice was filtered through a 0.45 μm filter (MFE4500-hs, Rover Pompe, Polverara, Italy) using a press filter (MFS0010, Rover Pompe, Polverara, Italy). The pear juice was placed in a stirrer and concentrated by heating at an internal temperature of 100 ± 1 °C (thermometer) until achieving a soluble solids content of 80 ± 2°Brix. The obtained PJC was transferred to a glass bottle with a cap and was stored at 4 °C until further use.
Manufacture of sesame bars using PJC and RS at different mixing ratios
The sesame bars were manufactured in accordance with method of AACC (1995) with some modifications using different mixing ratios of PJC and RS as shown in supplementary Table 1. Sesame, cane sugar (brown color), RS (80°Brix), and PJC were used as primary ingredients and sesame bars were manufactured using different mixing ratios, such as G-0, G-1, G-3, and G-5. The PJC: RS ratios were 0:30 (G-0), 1:29 (G-1), 3:27 (G-3), and 5:25 (G-5), respectively for all manufactured bars. Cane sugar was employed as a binder to enhance sesame binding in manufactured bars. Preparation of sesame bars was carried out in a pan with different mixing ratios of PJC and RS followed by addition of a small amount of cane sugar (2 g) and heating (60 °C) for up to 2 min and 30 s using an electric range (EGH-372, Evergreen, China). After addition of 70 g of sesame as a supplementary ingredient, the mixture was heated with stirring for 30 s. After molding, the bars were allowed to cool down for 1 h and were cut with a knife to the desired size (2 cm × 2 cm × 0.5 cm).
Table 1.
Color and texture properties of sesame bars prepared with different mixing ratios of pear juice concentrate (PJC) and rice syrup (RS)
| Samples | Color properties | Texture properties | ||||||
|---|---|---|---|---|---|---|---|---|
| L* | a* | b* | Hardness (g) | Springiness | Gumminess (N) | Chewiness (N) | Cohesiveness | |
| G-0 | 55.80 ± 0.72a | 4.80 ± 0.27*b | 23.91 ± 0.20b | 23,950.00 ± 894.69a | 0.31 ± 0.04ab | 29.86 ± 1.56a | 9.34 ± 2.06ab | 0.13 ± 0.01a |
| G-1 | 55.49 ± 0.47a | 5.00 ± 0.25ab** | 23.94 ± 0.34b | 23,333.33 ± 597.55a | 0.37 ± 0.03a | 30.43 ± 1.81a | 11.33 ± 1.87a | 0.13 ± 0.00a |
| G-3 | 55.36 ± 0.60ab | 4.84 ± 0.26b | 25.02 ± 0.51ab | 22,616.67 ± 874.69a | 0.29 ± 0.03ab | 30.15 ± 0.98a | 8.65 ± 1.69ab | 0.14 ± 0.01a |
| G-5 | 54.65 ± 0.17b | 5.43 ± 0.34a | 26.12 ± 0.69a | 20,033.33 ± 756.36b | 0.25 ± 0.02b | 25.05 ± 1.36b | 6.30 ± 0.88b | 0.13 ± 0.01a |
G-0, G-1, G-3, and G-5 indicate sesame bars prepared with PJC: RS mixing ratios of 0:30, 1:29, 3:27, and 5:25, respectively
*Values are mean ± standard deviation of triplicate determinations
**a–bMeans followed by different letters in a column are significantly different (p < 0.05)
Color values
Color was measured by a hand-held colorimeter (CR-400, Minolta, Osaka, Japan). Pallets of RS and PJC samples at each concentration level were prepared and formulated into shape of tablets. The PJC and RS tablets at each level were analyzed by tristimulus colorimeter through digitization of color information into pixels (24 bits/pixel) containing levels of the three primary colors: red, green and blue (RGB) and converted into XYZ tristimulus values (a widely used, device-independent color standard developed by CIE based on color-matching experiments with human observers). The color of the surface of the five tablets of each sample was also measured using a HunterLab colorimeter (CR-400, Minolta, Osaka, Japan) (Hunter Associates Inc., Reston, VA) after calibration with white and black glass standards. For each sesame bar sample (G-0 to G-5) prepared with different mixing ratios of PJC and RS, five tablets were analyzed and the average and standard deviation were calculated. In the following step, CIEXYZ data were converted to CIELAB or L*, a*, b*-value (Briones and Aguilera 2005; Gonzalez and Woods 1992) using an algorithm written in Matlab 6.5 and ran in a Pentium III computer. Three equidistant spots were examined on the major axis of each tablet of PJC-added sesame bar. Since the spot diameter of the instrument was 12.5 mm, the total area of the tablet from which information was taken was 3.68 cm2.The colorimeter yielded L*, a* and b* values for each spot.
Texture
Textural profile was analyzed by a two-cycle compression test with a triggering force of 50 g using a Texture Analyzer (500 N; Zwick GmbH & Co. KG, Ulm, Germany) equipped with a flat-ended spindle (5.0 cm dia.). Each sesame bar sample (1 × 1 × 1 cm) was measured at a pre-test speed of 2.0 mm/s, test speed of 1.0 mm/s, and post-test speed of 5.0 mm/s with a 30% compression strain and a holding time of 3 s between compressions. The hardness, springiness, gumminess, chewiness, and adhesiveness of each sample was calculated and recorded.
Viscosity determination
Both PJC and RS were analyzed for their viscosities at varying speeds (30, 60, and 100 rpm) and at a fixed time interval by employing a Brookfield Viscometer (model RVT) and spindle No. 2 in accordance with the method described by Singhal and Kulkarni (1990).
Extract preparation
The samples were extracted according to the method described by Jiang et al. (2018). Homogenization and sonication treatments were performed repeatedly followed by filtration through a No. 2 filter paper (Whatman, Maidstone, UK). The supernatant of each sample was collected and concentrated in vacuum and was employed for determination of the total phenolic content (TPC) and antioxidant activities in later experiments.
TPC
The TPC of samples was measured using the Folin–Ciocalteu reagent method following the protocol described by Eghdami and Sadeghi (2010). Absorbance of samples was measured at 765 nm (Optizen 2120 UV; Mecasys Co., Daejon, Korea). Measurements of TPC were expressed as mg gallic acid equivalent (mg GAE)/100 g dry weight (DW).
2,2-Diphenyl-1-picrylhydrazyl (DPPH) radical-scavenging activity
The DPPH radical-scavenging activity of samples was determined according to the method described by Kang et al. (2001). Sample absorbance was spectrophotometrically analyzed at 517 nm.
Reducing power
The reducing power of samples was measured as described by Wong and Chye (2009). Sample absorbance was evaluated at 700 nm; increased absorbance corresponded to higher reducing power.
Free sugar analysis
Each sample (1 g) was mixed with 40 mL of 80% ethanol, and the mixture was extracted with a Whatman membrane filter (1 μm) at 80 °C for 5 h in a reflux condenser. The liquid extract was evaporated at 37 °C until dryness using a vacuum rotary evaporator. The dried extract was dissolved in 20 mL of 80% ethanol, and then filtered with a membrane filter (0.22 μm) prior to HPLC analysis. An aliquot of 20 μL was injected into an HPLC system (Prominence HPLC, Shimadzu Co., Japan). The HPLC conditions were as follows: Column, Shim–pack ISA-07/S2504 (250 × 4.0 mm) and Shim-pack Guard Column ISA (50 × 4.0 mm); the mobile phase consisted of: A, potassium borate (pH 8) and B, potassium borate (pH 9), at a flow rate of 0.5 mL/min at 65 °C, equipped with a fluorescence detector with the excitation wavelength set to 320 nm and emission wavelength set to 430 nm. Sugars were quantified by comparing the retention times of all samples with those of the internal standard; the results were expressed as mg/100 g.
Organic acids
Each sample (1 g) was taken in an Erlenmeyer flask equipped with a cap and 30 mL of distilled water was added. The mixture was stirred and extracted for 4 h in a water bath at a constant temperature of 80 °C, filtered through a Whatman membrane filter (1 μm), and dissolved in 20 mL of distilled water. HPLC (Prominence, Shimadzu Co., Japan) was used for the quantification of organic acids. The mobile phase comprising 4 mM p-toluene sulfonic acid was employed at a flow rate of 0.7 mL/min and at a wavelength of 210 nm. The samples were filtered through a 0.45-μm filter, each sample was injected at an amount of 20 μL, and detection was carried out using an SCR-102H (50 × 6.0 mm) column at 40 °C. Quantification of organic acids was performed by comparing the retention times of samples with those of the internal standard solution. The results were demonstrated as mg/100 g of sample.
Fourier transform infrared (FT-IR) spectroscopic analysis
All samples were subjected to FTIR spectroscopic analysis and spectra were recorded using a FTIR spectrophotometer (Perkin Elmer, Inc., MA, USA). Sample placement was performed on an ATR top-plate and 120 N was applied on top of each sample. The employed wavelength for spectra recoding was 380–4000 cm−1 at a resolution rate of 4 cm−1. The universal diamond ATR top-plate was cleaned using alcohol.
Microstructural analysis by SEM
The microstructural attributes and morphology were monitored using low vacuum scanning electron microscope (SEM; JSM–7500F, JEOL Ltd., Tokyo, Japan). All samples were cut into a rectangular shape in the horizontal plane, coated with gold using ion sputter, and examined at an operational voltage of 20 kV at 50× magnification.
Sensory evaluation
Sensory evaluation was carried out by a trained panel comprising 50 trained panelists who were students of the Department of Food Science and Technology, Chonnam National University. A seven point hedonic scale was utilized to evaluate the sesame bars for sensory properties such as appearance color, flavor, texture, and overall acceptability (Meilgaard et al. 1999). The samples were ranked from point 1 to point 7 where 1 denoted dislike and 7 represented liking to the maximum extent.
Statistical analysis
All experiments were performed twice, and measurements were recorded in triplicate. The recorded data was presented as mean ± standard deviation. One-way analysis of variance (ANOVA) was used to determine the statistical significance of obtained data. Statistical analysis was performed using SPSS program (ver. 18.0). The difference between means was evaluated by Duncan’s multiple-range test at a significance level of p < 0.05.
Results and discussion
Color values
The color values (L*, a*, and b*) of sesame bar samples (G-0 to G-5) prepared with different mixing ratios of PJC and RS are shown in Table 1. Addition of PJC up to 3% in the bar formulation did not exhibit any significant change in the L* value of sesame bars. However, at values above 3% PJC, there was a prominent decrease in the L* value in case of G-5 compared with the control (G-0). In contrast, a* and b* values showed a tendency to increase with a corresponding increase in PJC addition levels from 1 to 5% in G-1, G-3, and G-5, respectively. The high increase in b* values with the corresponding increase in PJC addition ratios implied the prevalence of a brownish yellow color in sesame bars. This might be due to the possible caramelization of PJC during heating owing to the occurrence of Maillard reaction, which resulted in a darker color compared to RS. Similar to our results, Srebernich et al. (2016) have also reported a high degree of yellowness (positive b* value) in the color tone of cereal bars and this increased yellowness degree was attributed to reduced inulin addition and increased addition of sorbitol.
Textural properties and viscosity
The G-0 and PJC-added sesame bars (G-1 to G5) were analyzed for their textural profiles including various attributes such as hardness, springiness, gumminess, chewiness, and cohesiveness (Table 1). There was no significant difference in the hardness of sesame bars with addition of up to 3% PJC. However, at values greater than 3% PJC, hardness was significantly decreased from 22,616.67 to 20,033.33 g. This significant decrease in hardness may be attributed to the high free sugar content of PJC. It was evident from the textural analysis that the springiness of sesame bars decreased with increased PJC content. The decreasing tendency of springiness showed that PJC exhibited a significant impact on the restorative ability of sesame bars after application of stretchability, and bars were found to be softer compared to G-0. Variation in textural characteristics might be induced by modification of inner structure (Siddiq et al. 2009) because addition of PJC and RS may lead to changes in food systems during manufacture, thereby affecting the texture of the final product. The mouthfeel sensation of chewing owing to sustained elastic food resistance is termed as chewiness. Addition of PJC did not exhibit any significant effect on gumminess of sesame bars up to 3% PJC addition as compared to G-0. However, addition of 5% PJC led to significant decreases in gumminess. Moreover, sesame bars containing higher levels of PJC (5%) demonstrated a lower degree of chewiness. This attribute is subjected to variations due to mastication complexities of shear compression, penetration, and tearing of the food matrix. For cohesiveness, no significant difference was found between G-0 and PJC-added sesame bars (G1 to G5).
High viscosity is usually correlated with an increase in hardness and vice versa (Mitchell 2003). Therefore, to the best of our knowledge, PJC and RS were analyzed for their viscosities, and the results are shown in Fig. 1. It was evident that until 50 rpm, the difference in viscosities was very low and that the viscosity of both PJC and RS showed significant rises with the increase in speed. However, RS exhibited higher viscosity compared to PJC. At 100 rpm, the RS viscosity was greater at 15,000 cP compared to PJC (10,000 cP). Similar findings were reported for bitter orange juice concentrate by Bozdogan (2015), who showed that viscosity increased with an increase in velocity and shear rate. Based on these results, different viscosities were measured for both PJC and RS, which may affect the binding of sesame bars.
Fig. 1.
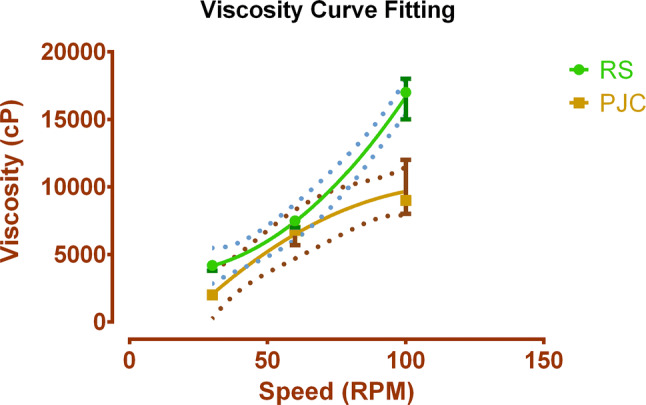
Fitting curve of the viscosity of pear juice concentrate (PJC) and rice syrup (RS)
Furthermore, one possible explanation is the glass transition temperature (Tg) of free sugars, predominantly fructose and maltose, which might be related to the binding of PJC and RS in sesame bars; this binding could affect the texture properties of the bars. RS had a significantly higher quantity of maltose in its composition, which has a Tg of 93 °C (Shirke and Ludescher 2005), whereas PJC had fructose in significant amounts in its composition, which has Tg of − 5 °C (Fazaeli et al. 2012). Due to higher fructose content, sesame bars showed a significant change in compactness with PJC addition greater than 3%, whereas at up to 3% PJC, no significant change in compactness was observed. At greater than 3% PJC, the hardness and compactness of sesame bars decreased and they became softer and malleable.
TPC and antioxidant activities
All samples (G-0 to G-5) were analyzed for their TPC and antioxidant activities, and the results are shown in Fig. 2. The TPC, DPPH, and reducing power showed increasing tendencies in a linear fashion with corresponding increases in PJC levels from 1 to 5% in sesame bars. Increased antioxidant activities are correlated with higher levels of TPC (Jiang et al. 2018). Pear fruits are reported to comprise various antioxidant, phenolic, and flavonoid compounds such as arbutin and chlorogenic acid (Jiang et al. 2018). Because of these bioactive compounds, it may be inferred that sesame bars showed increases in antioxidant activities with a corresponding increase in PJC addition from 1 to 5% in comparison with G-0.
Fig. 2.

Total phenolic content, DPPH radical-scavenging activity, and reducing power of sesame bars prepared with different mixing ratios of pear juice concentrate (PJC) and rice syrup (RS). G-0, G-1, G-3, and G-5 indicate sesame bars prepared with PJC: RS mixing ratios of 0:30, 1:29, 3:27, and 5:25, respectively. a–dMeans with different letters on the bar are significantly different (p < 0.05)
Free sugar content
The results of free sugars from PJC, RS, and all sesame bar samples are presented in Table 2. Sucrose, fructose, and mannose were detected in significantly higher concentrations in PJC compared to those in RS, which demonstrated very large quantities of maltose, lactose, and ribose compared to those in PJC. Compared to sesame bar samples, sucrose, fructose, rhamnose, mannose, and glucose showed increasing tendencies in sesame bars with a corresponding rise in PJC levels from 1 to 5%. On the other hand, maltose, lactose, and ribose showed decreasing trends in a gradual manner. Based on these results, it could be implied that PJC may serve as a natural source of sweetener, by being an integral part of sesame bars.
Table 2.
Free sugar and organic acid content of sesame bars prepared with different mixing ratios of pear juice concentrate (PJC) and rice syrup (RS) (unit: mg/100 g)
| Samples | Free sugar compositions | |||||||
|---|---|---|---|---|---|---|---|---|
| Sucrose | Maltose | Lactose | Rhamnose | Ribose | Mannose | Fructose | Glucose | |
| PJC | 2480.28 ± 1.05*c | 7.51 ± 0.17e** | 1.41 ± 0.13e | 79.36 ± 0.65a | 3.06 ± 0.03e | 625.32 ± 34.28a | 22,279.47 ± 404.75a | 9215.64 ± 146.47a |
| RS | 283.23 ± 9.77d | 42,251.14 ± 397.34a | 1862.92 ± 27.72a | 2.27 ± 0.52bc | 624.03 ± 8.37a | 79.55 ± 1.97b | 595.52 ± 37.37d | 8415.07 ± 47.38b |
| G-0 | 5088.46 ± 40.21b | 16,378.84 ± 392.97b | 446.48 ± 9.21b | 0.82 ± 0.00d | 187.32 ± 12.91b | 23.31 ± 2.02c | 195.87 ± 17.01e | 2677.99 ± 101.88cd |
| G-1 | 4959.97 ± 167.57b | 15,370.64 ± 79.88c | 426.33 ± 21.73b | 1.38 ± 0.04c | 163.07 ± 1.00c | 23.65 ± 4.22c | 1000.23 ± 23.69d | 2602.36 ± 36.09d |
| G-3 | 5173.76 ± 3.43b | 15,937.43 ± 18.57bc | 324.68 ± 4.16c | 2.39 ± 0.09bc | 165.76 ± 3.95c | 40.84 ± 0.18c | 1383.08 ± 7.87c | 2828.72 ± 79.14bc |
| G-5 | 5547.23 ± 71.60a | 14,077.32 ± 324.04d | 268.39 ± 1.09d | 3.40 ± 0.01b | 136.10 ± 4.59d | 45.21 ± 0.93c | 1857.37 ± 46.78b | 2789.30 ± 52.90bcd |
| Samples | Organic acid compositions | |||||
|---|---|---|---|---|---|---|
| Citric acid | Malic acid | Succinic acid | Lactic acid | Formic acid | Acetic acid | |
| PJC | 649.08 ± 6.37a | 962.25 ± 3.06a | 11.47 ± 0.68a | 7.83 ± 0.08a | 41.36 ± 0.98a | 18.06 ± 1.48a |
| RS | ND | 9.84 ± 0.30e | 2.96 ± 0.12cd | 8.21 ± 0.32a | 20.22 ± 0.23b | 7.97 ± 0.94f |
| G-0 | 181.34 ± 5.48d | 75.20 ± 3.61d | 2.56 ± 0.33d | 2.21 ± 0.16d | 10.58 ± 0.20d | 10.73 ± 0.39e |
| G-1 | 193.26 ± 4.48d | 91.01 ± 2.90c | 3.58 ± 0.54c | 4.05 ± 0.08d | 12.11 ± 0.06d | 12.00 ± 0.54de |
| G-3 | 208.63 ± 4.64c | 104.70 ± 2.43b | 4.71 ± 0.32b | 4.65 ± 0.28bc | 13.57 ± 1.05cd | 13.31 ± 0.76cd |
| G-5 | 226.05 ± 3.40b | 107.09 ± 1.49b | 5.32 ± 0.36b | 4.95 ± 0.08b | 16.09 ± 0.37c | 15.05 ± 0.05bc |
G-0, G-1, G-3, and G-5 indicate sesame bars prepared with PJC: RS mixing ratios of 0:30, 1:29, 3:27, and 5:25, respectively
*Values are mean ± standard deviation of triplicate determinations
**a–fMeans followed by different letters in a column are significantly different (p < 0.05). ND: not detected
Organic acid content
A wide distribution of organic acids has been reported in fruits, beverages, and wines. Organic acid content plays an important contributory role in the determination of taste profiles of fruit juices and beverages. Organic acid consumption in moderate amounts has been linked to facilitate digestion and is beneficial for appetite promotion as well as overall human wellness (Liu et al. 2014). Therefore, qualitative and quantitative analyses of organic acids hold great significance. The results of the organic acid analysis for PJC, RS, and sesame bar samples are given in Table 2. Overall, all organic acids were detected in significantly higher concentrations in PJC compared to those in RS. All sesame bar samples showed significantly increasing tendencies for all organic acids and gradual linear rises were observed with the corresponding rise in PJC levels. Corresponding to our results, Damasceno et al. (2016) reported organic acids based on titratable acidity (high citric acid concentration) in the range of 0.18–0.38% in cereal bars prepared by enrichment with pineapple peel flour.
FT-IR analysis
FT-IR, which operates in the mid-infrared region, has opened avenues to provide insight regarding changes in functional groups of purees, juices, concentrates, and jams. The results of FT-IR spectral features of G-0 and PJC-added sesame bars (G-1, G-3 and G-5) are shown in supplementary Fig. 1. The most visible band stretching was observed in all samples from 3800 to 2800 cm−1 (normal polymeric OH, OH stretch bonded with H, O–H broad) and from 1500 to 500 cm−1 (aromatic ring structures). As compared to G-0, it was evident from the FT-IR spectra that increase in PJC led to significant changes in specific functional groups such as H-bonding. Increased PJC levels (greater than 3%) in sesame bars caused marked elongation of stretches (3470 and 1050 cm−1), which suggested weakening of H-bonds. This might be due to the weak binding of internal structure in the sesame bar with the addition of PJC. From 1000 to 700 cm−1, G-5 demonstrated prominent functional group changes corresponding to spectral characteristics and these changes were less evident in the case of G-1 and G-3 bars when compared to the G-0 bars. Band intensity was also increased with the corresponding rise in PJC levels from 1 to 5%, which might be due to the interaction of non-polar components between PJC and sesame bars. Similar findings were reported by Park et al. (2015) who used FT-IR as an additional indicator to evaluate the similarities and differences in various fruits based on the bands and similarity of peaks in the polyphenol region, and orange and grapefruit juices were discriminated based on their spectral features regarding carbonyl (C-Q-O) stretching in the region ranging from 4000 to 600 cm−1 (Ellis et al. 2012). It was evident from these results that RS and PJC interacted with sesame bars via intermolecular hydrogen bonding and non-polar compound interaction and that addition of PJC at greater than 3% resulted in significantly high band stretching and weakening owing to C=C stretching of aromatic rings and weakening of hydrogen bonds.
Microstructural attributes
The SEM images of G-0 and PJC-added sesame bars (G-1, G-3 and G-5) are shown in Fig. 3. Lower PJC levels produced a compacted structure and an increase in PJC resulted in significant morphology changes in the sesame bars. Sesame bars with the highest level of PJC (5%) demonstrated a dented structure. This may be implied due to the possible effect of PJC on particle (each sesame seed) stickiness and increased aggregation with a corresponding rise in PJC levels as shown in Fig. 3b–d. Increase in PJC up to 3% showed similar compactness and binding as observed for G-0, whereas sesame bars with greater than 5% addition of PJC showed a brittle structure (Fig. 3d). Overall, PJC addition up to 3% was sufficient to retain compactness comparable with the control.
Fig. 3.

Scanning electron micrographs of cross sections of sesame bars prepared with different mixing ratios of pear juice concentrate (PJC) and rice syrup (RS). G-0, G-1, G-3, and G-5 indicate sesame bars prepared with PJC: RS mixing ratios of 0:30, 1:29, 3:27, and 5:25, respectively
Sensory evaluation
The results of sensory evaluation for sesame bar samples are shown in Table 3. Appearance and flavor showed no significant differences among all the samples as compared to the control. The taste scores of sesame bars showed increases with increase in PJC addition levels and maximum scores were recorded for the 3% PJC-sesame bars (G-3). Addition of PJC at greater than 3% resulted in a decrease in taste due to elevated sweetness intensity. Addition of PJC affected the texture of sesame bars and texture was quite desirable up to 3% addition of PJC, whereas further increase in PJC above 3% led to a significant decrease in the texture of sesame bars. A similar trend was observed for overall acceptability. Based on these results, it may be inferred that 3% PJC-sesame bars showed excellent overall acceptability. These results are in agreement with the findings of Ho et al. (2013), who reported the highest sensory acceptability of banana flour added food products.
Table 3.
Sensory characteristics of sesame bars prepared with different mixing ratios of pear juice concentrate (PJC) and rice syrup
| Samples | Appearance | Flavor | Taste | Texture | Overall acceptability |
|---|---|---|---|---|---|
| G-0 | 5.85NS | 4.85NS** | 4.05b* | 5.85a | 4.20b |
| G-1 | 5.20 | 4.60 | 4.75ab | 6.15a | 4.85ab |
| G-3 | 5.50 | 5.10 | 5.15a | 6.00a | 5.30a |
| G-5 | 5.10 | 5.05 | 4.60ab | 4.30b | 4.70ab |
G-0, G-1, G-3, and G-5 indicate sesame bars prepared with PJC: RS mixing ratios of 0:30, 1:29, 3:27, and 5:25, respectively
*a–bMeans followed by different letters in a column are significantly different (p < 0.05)
**NSMeans showing no significant differences (p > 0.05)
Conclusion
In this study, PJC was utilized as a natural sweetener in different mixing ratios with RS to manufacture sesame bars and to investigate its effects on the color, texture, antioxidant activities, free sugars, organic acids, functional groups, structure, and sensory characteristics of sesame bars. The degrees of redness and yellowness of sesame bars showed marked changes with increase in PJC levels. PJC addition at more than 3% resulted in significantly decreased hardness and compactness of sesame bars, and the bars became softer and malleable. TPC, antioxidant activity, free sugars, and organic acids were significantly increased with a corresponding increase in PJC levels from 1 to 5%. Higher PJC levels could alter the functional groups of sesame bars. Lower PJC levels produced a compacted morphology. Based on sensory properties, 3% PJC-sesame bars showed excellent overall acceptability. Sesame bars prepared using PJC sweetener may thus represent an interesting option as a snack, particularly for health-conscious consumers.
Electronic supplementary material
Below is the link to the electronic supplementary material.
Acknowledgments
This study was supported by the Cooperative Research Program for Agriculture Science and Technology Development at the Rural Development Administration, Republic of Korea (Project Number PJ01002402).
Compliance with ethical standards
Conflict of interest
The authors declare that they have no conflict of interest.
Footnotes
Publisher's Note
Springer Nature remains neutral with regard to jurisdictional claims in published maps and institutional affiliations.
References
- AACC . Approved methods of the American Association of Cereal Chemists. 15. St. Paul: American Association of Cereal Chemists; 1995. [Google Scholar]
- Bozdogan A. Viscosity behavior of bitter orange (Citrus aurantium) juice as affected by temperature and concentration. Cyta J Food. 2015;13:535–540. [Google Scholar]
- Briones V, Aguilera JM. Image analysis of changes in surface color of chocolate. Food Res Int. 2005;38:87–94. doi: 10.1016/j.foodres.2004.09.002. [DOI] [Google Scholar]
- Damasceno KA, Goncalves CAA, Pereira GDS, Costa LL, Campagnol PCB, Almeida PLD, Arantes-Pereira L. Development of cereal bars containing pineapple peel flour (Ananas Comosus L. Merril) J Food Qual. 2016;39:417–424. doi: 10.1111/jfq.12222. [DOI] [Google Scholar]
- Eghdami A, Sadeghi F. Determination of total phenolic and flavonoid contents in methanolic and aqueous extract of Achillea millefolium. J Org Chem. 2010;2:81–84. [Google Scholar]
- Ellis DI, Brewster VL, Dunn WB, Allwood JW, Golovanov AP, Goodacre R. Fingerprinting food: current technologies for the detection of food adulteration and contamination. Chem Soc Rev. 2012;41:5706–5727. doi: 10.1039/c2cs35138b. [DOI] [PubMed] [Google Scholar]
- Fazaeli M, Emam-Djomeh Z, Kalbasi-Ashtari A, Omid M. Effect of spray drying conditions and feed composition on the physical properties of black mulberry juice powder. Food Bioprod Process. 2012;90:667–675. doi: 10.1016/j.fbp.2012.04.006. [DOI] [Google Scholar]
- Gonzalez RC, Woods RE. Digital image processing. Boston: Addison-Wesley Longman Publishing Co., Inc; 1992. [Google Scholar]
- Ho LH, Aziz NAA, Azahari B. Physico-chemical characteristics and sensory evaluation of wheat bread partially substituted with banana (Musa acuminata X balbisiana cv. Awak) pseudo-stem flour. Food Chem. 2013;139:532–539. doi: 10.1016/j.foodchem.2013.01.039. [DOI] [PubMed] [Google Scholar]
- Jiang GH, Yim SH, Eun JB. Physicochemical characteristics and antioxidant activities of new Asian pear cultivars. Korean Soc Appl Biol Chem. 2016;59:337–343. doi: 10.3839/jabc.2016.057. [DOI] [Google Scholar]
- Jiang GH, Nam SH, Yim SH, Kim YM, Gwak HJ, Eun JB. Changes in total phenolic and flavonoid content and antioxidative activities during production of juice concentrate from Asian pears (Pyrus pyrifolia Nakai) Food Sci Biotechnol. 2016;25:47–51. doi: 10.1007/s10068-016-0097-4. [DOI] [PMC free article] [PubMed] [Google Scholar]
- Jiang GH, Nam SH, Eun JB. Effects of peeling, drying temperature, and sodium metabisulfite treatment on physicochemical characteristics and antioxidant activities of Asian pear powder. J Food Process Preserv. 2018;42:e13526. doi: 10.1111/jfpp.13526. [DOI] [Google Scholar]
- Jingrong GAO, Brennan MA, Mason SL, Brennan CS. Effect of sugar replacement with stevianna and inulin on the texture and predictive glycaemic response of muffins. Int J Food Sci Technol. 2016;51:1979–1987. doi: 10.1111/ijfs.13143. [DOI] [Google Scholar]
- Kang MH, Park CG, Cha MS, Seong NS, Chung HK, Lee JB. Component characteristics of each extract prepared by different extract methods from byproducts of Glycyrrhizia uralensis. J Korean Soc Food Sci Nutr. 2001;30:138–142. [Google Scholar]
- Liu FJ, Ding GS, Tang AN. Simultaneous separation and determination of five organic acids in beverages and fruits by capillary electrophoresis using diamino moiety functionalized silica nanoparticles as pseudostationary phase. Food Chem. 2014;145:109–114. doi: 10.1016/j.foodchem.2013.08.035. [DOI] [PubMed] [Google Scholar]
- Meilgaard MC, Carr BT, Civille GV. Sensory evaluation techniques. 3. Boca Raton: CRC Press; 1999. [Google Scholar]
- Mitchell J. Food texture and viscosity: concept and measurement. Int J Food Sci Technol. 2003;38:839–840. doi: 10.1046/j.1365-2621.2003.00667.x. [DOI] [Google Scholar]
- Park YS, Im MH, Ham KS, Kang SG, Park YK, Namiesnik J, Leontowicz H, Leontowicz M, Trakhtenberg S, Gorinstein S. Quantitative assessment of the main antioxidant compounds, antioxidant activities and FTIR spectra from commonly consumed fruits, compared to standard kiwi fruit. LWT Food Sci Technol. 2015;63:346–352. doi: 10.1016/j.lwt.2015.03.057. [DOI] [Google Scholar]
- Pilando LS, Wrolstad RE. Compositional profiles of fruit juice concentrates and sweeteners. Food Chem. 1992;44:19–27. doi: 10.1016/0308-8146(92)90252-W. [DOI] [Google Scholar]
- Shirke S, Ludescher RD. Molecular mobility and the glass transition in amorphous glucose, maltose, and maltotriose. Carbohydr Res. 2005;340:2654–2660. doi: 10.1016/j.carres.2005.08.016. [DOI] [PubMed] [Google Scholar]
- Siddiq M, Nasir M, Ravi R, Butt MS, Dolan KD, Harte JB. Effect of defatted maize germ flour addition on the physical and sensory quality of wheat bread. LWT Food Sci Technol. 2009;42:464–470. doi: 10.1016/j.lwt.2008.09.005. [DOI] [Google Scholar]
- Singhal RS, Kulkarni PR. Some properties of Amaranthus paniculatas (Rajgeera) starch pastes. Starch-Stärke. 1990;42:5–7. doi: 10.1002/star.19900420103. [DOI] [Google Scholar]
- Srebernich SM, Conçalves GMS, Ormenese RD, Ruffi CRG. Physico-chemical, sensory and nutritional characteristics of cereal bars with addition of acacia gum, inulin and sorbitol. Food Sci Technol. 2016;36:555–562. doi: 10.1590/1678-457X.05416. [DOI] [Google Scholar]
- Wong JY, Chye FY. Antioxidant properties of selected tropical wild edible mushrooms. J Food Compos Anal. 2009;22:269–277. doi: 10.1016/j.jfca.2008.11.021. [DOI] [Google Scholar]
Associated Data
This section collects any data citations, data availability statements, or supplementary materials included in this article.