

Abstract
Spindle checkpoint strength is dictated by the number of unattached kinetochores, cell volume, and cell fate. We show that the conserved AAA-ATPase PCH-2/TRIP13, which remodels the checkpoint effector Mad2 from an active conformation to an inactive one, controls checkpoint strength in Caenorhabditis elegans. Having previously established that this function is required for spindle checkpoint activation, we demonstrate that in cells genetically manipulated to decrease in cell volume, PCH-2 is no longer required for the spindle checkpoint or recruitment of Mad2 at unattached kinetochores. This role is not limited to large cells: the stronger checkpoint in germline precursor cells also depends on PCH-2. PCH-2 is enriched in germline precursor cells, and this enrichment relies on conserved factors that induce asymmetry in the early embryo. Finally, the stronger checkpoint in germline precursor cells is regulated by CMT-1, the ortholog of p31comet, which is required for both PCH-2′s localization to unattached kinetochores and its enrichment in germline precursor cells. Thus, PCH-2, likely by regulating the availability of inactive Mad2 at and near unattached kinetochores, governs checkpoint strength. This requirement may be particularly relevant in oocytes and early embryos enlarged for developmental competence, cells that divide in syncytial tissues, and immortal germline cells.
INTRODUCTION
To prevent the missegregation of chromosomes and the production of daughter cells with an incorrect number of chromosomes, the spindle checkpoint (also called the spindle assembly checkpoint or the mitotic checkpoint) monitors whether chromosomes are attached to the spindle via kinetochores. If kinetochores fail to attach properly, this checkpoint delays the cell cycle to promote error correction and prevent aneuploidy. Despite its critical role, the duration of the cell cycle delay, defined as the strength of the spindle checkpoint, can be highly variable. This variability can be controlled by the number of unattached kinetochores (Collin et al., 2013), cell volume (Galli and Morgan, 2016; Kyogoku and Kitajima, 2017), and cell fate (Galli and Morgan, 2016; Gerhold et al., 2018).
The spindle checkpoint response is initiated by the recruitment of Mad1 and Mad2 at unattached kinetochores (Chen et al., 1996, 1998; Li and Benezra, 1996; Sironi et al., 2001), which catalyzes the production of a mitotic checkpoint complex (MCC). The MCC enforces a checkpoint arrest by inhibiting the anaphase-promoting complex/cyclosome (APC/C) and preventing cell cycle progression (Sudakin et al., 2001). Formation of the MCC is driven by conformational changes in Mad2, which can exist in an open conformation (O-Mad2) or a closed conformation (C-Mad2; Luo et al., 2002, 2004; Sironi et al., 2002). Mad2 is in the closed conformation in the Mad1/Mad2 tetramer recruited to unattached kinetochores. C-Mad2 in the tetramer acts as a template to convert additional soluble O-Mad2 to C-Mad2, which can be assembled into the MCC (Sironi et al., 2001; De Antoni et al., 2005; Simonetta et al., 2009; Fava et al., 2011). Thus, unattached kinetochores act as a platform for MCC assembly. This soluble signal generated by unattached kinetochores effectively tunes the spindle checkpoint response: the length of the cell cycle delay imposed by the checkpoint is governed by the ratio of unattached kinetochores producing MCC, and its ability to inhibit the APC, to cytoplasmic volume (Collin et al., 2013; Dick and Gerlich, 2013; Galli and Morgan, 2016; Kyogoku and Kitajima, 2017).
PCH-2/TRIP13 is a hexameric AAA+ ATPase that remodels HORMA domain-containing proteins, a group that includes Mad2 (Aravind and Koonin, 1998; Rosenberg and Corbett, 2015; Vader, 2015). Biochemical and structural studies have shown that PCH-2 converts C-Mad2 to O-Mad2 (Ye et al., 2015; Brulotte et al., 2017; Alfieri et al., 2018). TRIP13 works with the adaptor protein p31comet to extract C-Mad2 from the MCC and promote its disassembly, permitting the activation of the APC/C and silencing the checkpoint (Eytan et al., 2014; Wang et al., 2014; Miniowitz-Shemtov et al., 2015; Ye et al., 2015; Brulotte et al., 2017; Alfieri et al., 2018). In addition to this role, we and others have shown that PCH-2/TRIP13 is essential for spindle checkpoint activation in Caenorhabditis elegans and human cells (Nelson et al., 2015; Ma and Poon, 2016, 2018; Yost et al., 2017). PCH-2 is present at unattached kinetochores (Tipton et al., 2012; Wang et al., 2014; Nelson et al., 2015) and is needed to robustly localize Mad2, but not Mad1, to unattached kinetochores (Nelson et al., 2015; Yost et al., 2017). A major implication of this work is that O-Mad2 can be limiting during checkpoint activation and PCH-2/TRIP13 plays a central role in ensuring its availability (Ma and Poon, 2018).
Based on genetic interaction between the C. elegans ortholog of p31comet, CMT-1, and PCH-2, we had previously proposed that PCH-2 disassembles a CMT-1/Mad2 complex to promote checkpoint signaling, similarly to its role in checkpoint silencing (Nelson et al., 2015). However, recent data from mammalian systems, in which loss of p31comet does not suppress the requirement for TRIP13 (Nelson et al., 2015; Ma and Poon, 2016, 2018; Yost et al., 2017), and TRIP13’s function becomes essential for checkpoint activity only when O-Mad2 becomes limiting (Ma and Poon, 2018), suggest elaborations to this model in C. elegans. Given that p31comet binds Mad2, specifically C-Mad2, throughout the cell cycle (Xia et al., 2004; Date et al., 2014) and that CMT-1 is required to maintain Mad2 protein levels (Nelson et al., 2015), we hypothesize that CMT-1′s binding of Mad2 plays two roles in C. elegans: to stabilize Mad2 and to sequester it until it is required for checkpoint function. In the absence of CMT-1, more O-Mad2 is available despite the reduction in total protein levels, making PCH-2 partially dispensable and explaining the genetic suppression. This model differs from our understanding of TRIP13 and p31comet in cultured human cells (see Table 1), potentially because of the rapidity of embryonic cell cycles, the fact that relative levels of C and O-Mad2 may vary between systems, and the observation that most Mad2 in cultured human cells is present as O-Mad2 (Luo et al., 2004). Further, it highlights the importance of studying spindle checkpoint function in developmentally relevant model organisms.
TABLE 1:
Mitotic roles of PCH-2/TRIP13 and CMT-1/p31comet.
| Protein | Mitotic roles in C. elegans | Mitotic roles in human cells |
|---|---|---|
| PCH-2/TRIP13 |
|
|
| CMT-1/p31comet |
|
|
This model, however, raises another question: if the primary role of PCH-2/TRIP13 is to guarantee that enough O-Mad2 is available for checkpoint activation and this role can be dispensable when enough O-Mad2 is available, is there a reason for PCH-2/TRIP13 to localize to unattached kinetochores (Tipton et al., 2012; Wang et al., 2014; Nelson et al., 2015)? One possible answer comes from our analysis of cmt-1 mutant worms. In addition to its role as a PCH-2 adapter (Ye et al., 2015) and in stabilizing Mad2 protein levels (Nelson et al., 2015), CMT-1 is also needed to localize PCH-2 to unattached kinetochores during the spindle checkpoint response and generate a robust spindle checkpoint response in AB cells (Nelson et al., 2015). Overexpressing Mad2 does not suppress the partial defect in spindle checkpoint activation in cmt-1 mutants (Nelson et al., 2015), suggesting that the defect in spindle checkpoint strength is not because of reduced Mad2 protein levels but because of the inability to localize PCH-2 to unattached kinetochores.
Here, we test this possibility and show that PCH-2 controls spindle checkpoint strength in C. elegans. Despite being essential for the spindle checkpoint in the large somatic, or AB, cell of the two-cell embryo (Nelson et al., 2015), PCH-2 becomes dispensable for the spindle checkpoint and partially dispensable for Mad2 recruitment at unattached kinetochores as AB cells are genetically manipulated to become smaller. The requirement for PCH-2 in promoting spindle checkpoint strength is also observed as cells decrease in size during embryogenesis and in germline precursor, or P1 cells, which have a stronger checkpoint than their similarly sized somatic counterparts. PCH-2 is enriched in P1 cells, and this enrichment depends on conserved regulators of embryonic polarity, PAR-1 and PAR-6. Further, the stronger checkpoint in P1 cells also relies on the C. elegans ortholog of p31comet, CMT-1, indicating that CMT-1′s ability to enrich PCH-2 in P1 cells, in addition to its role in localizing PCH-2 to unattached kinetochores, contributes to a stronger checkpoint. We propose that PCH-2 and its mammalian ortholog TRIP13 ensure a robust spindle checkpoint response and proper chromosome segregation by regulating the availability of O-Mad2 at and near unattached kinetochores. This role may be specifically relevant in scenarios where maintaining genomic stability is particularly challenging, such as in oocytes and early embryos enlarged for developmental competence, cells that divide in a syncytium, and germline cells that maintain immortality.
RESULTS
PCH-2 becomes dispensable for the spindle checkpoint response in somatic cells experimentally reduced in size
In the large somatic, or AB, cell of the C. elegans two-cell embryo, PCH-2 is essential for spindle checkpoint activation (Nelson et al., 2015). To further assess the requirements for PCH-2 function, we manipulated the cell volume of embryos, and thus AB cells, experimentally by performing RNA interference (RNAi) against ani-2. ani-2 encodes a germline-specific anillin whose depletion generates oocytes and, after fertilization, embryos of varying size (Maddox et al., 2005; Figure 1A). We monitored the length of mitosis in these AB cells, using the times of nuclear envelope breakdown (NEBD) and onset of cortical contractility (OCC) as markers for entry into and exit from mitosis, respectively (Essex et al., 2009). We then correlated the length of mitosis to cytoplasmic volume. RNAi of ani-2 did not affect normal cell cycle progression in controls and pch-2 and mad-1 mutants (Supplemental Figure S1A), indicating that reducing cytoplasmic volume did not affect mitotic timing in AB cells. (In C. elegans, the genes that encode Mad1 and Mad2 are mdf-1 and mdf-2, respectively. To avoid confusion, we will use mad-1 and mad-2.)
FIGURE 1:
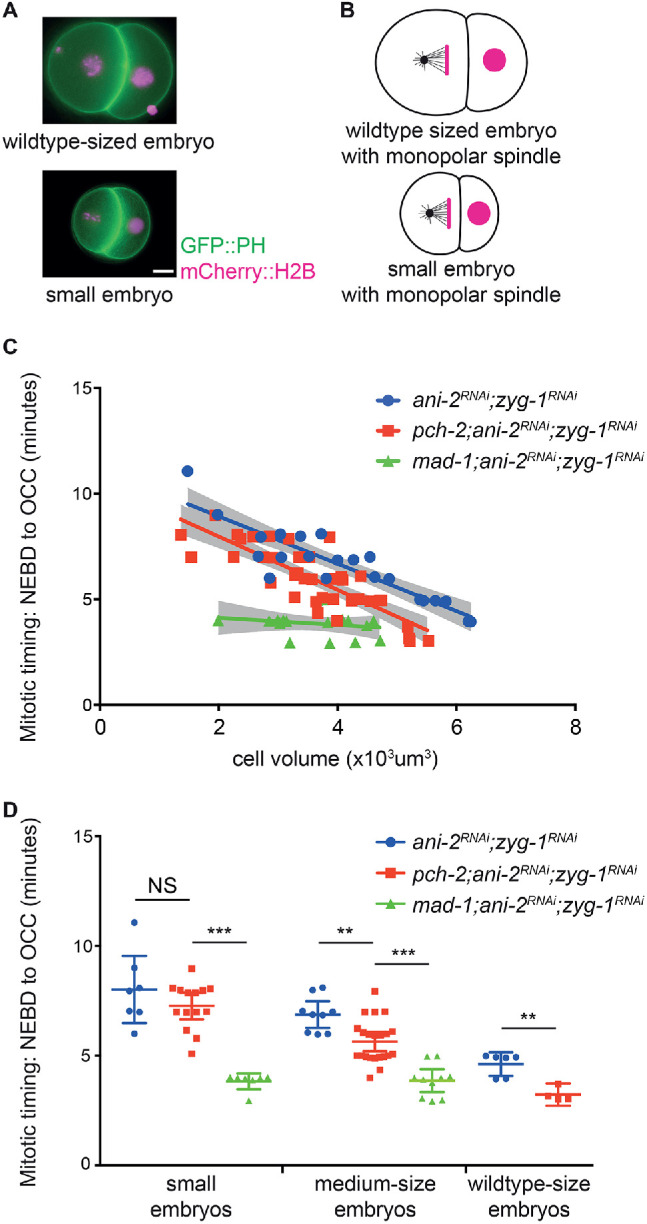
PCH-2 becomes dispensable for the spindle checkpoint response in somatic cells experimentally reduced in size. (A) Images of wild type–sized and small ani-2RNAi two-cell embryos. Scale bar indicates 5 μm. (B) Cartoon of wild type–sized and small ani-2RNAi two-cell embryos treated with zyg-1RNAi. (C) Mitotic timing, as measured from nuclear envelope breakdown (NEBD) to the onset of cortical contractility (OCC), in AB cells of control and of pch-2 and mad-1 mutant embryos plotted against cell volume. Lines represent least-squares regression models with 95% confidence intervals (gray-shaded areas) for each set of data. Equations and p values indicating whether slopes are significantly nonzero for each model are as follows: ani-2RNAi;zyg-1RNAi (blue): y = -1.117x + 11.15 and p < 0.0001; pch-2;ani-2RNAi;zyg-1RNAi (red): y = -1.264x + 10.50 and p < 0.0001; mad-1;ani-2RNAi;zyg-1RNAi (green): y = -0.1709x + 4.468 and p = 0.4197. (D) Data from (C) partitioned into three categories: wild type–sized embryos (more than 5 × 103 μm3), medium-sized embryos (between 3.3 × 10³ and 5 × 103 μm3), and small embryos (less than 3.3 × 103 μm3). Error bars are 95% confidence intervals. In all graphs, a * indicates p < 0.05, ** indicates p < 0.01, and *** indicates p < 0.0001.
We performed double depletion of ani-2 and zyg-1 to induce the spindle checkpoint response in control embryos and pch-2 and mad-1 mutants. ZYG-1 is essential for centrosome duplication, and after the first embryonic division, its depletion generates monopolar spindles (O’Connell et al., 2001) and unattached kinetochores (Essex et al., 2009; Figure 1B). Consistent with previous reports, as AB cells decreased in cell volume, the length of the cell cycle delay, an indicator of spindle checkpoint strength, increased in control embryos (Galli and Morgan, 2016; Gerhold et al., 2018; Figure 1C; Supplemental Videos 1 and 2). Surprisingly, as pch-2 mutants decreased in size, the spindle checkpoint response resembled that of control AB cells more closely than mad-1 mutants (Figure 1C; Supplemental Videos 3 and 4). mad-1 mutant embryos appear more sensitive to ani-2 RNAi treatment, and we had difficulty recovering any wild type–sized mad-1 embryos. There was no significant difference between the slopes of the regression analysis of control and pch-2 mutant data (p = 0.4664), while the slopes between the regression analyses of pch-2 and mad-1 mutant data were significantly different (p = 0.0007).
Movie S1.
Mitosis in the AB cell of a wild-type sized control 2-cell embryo with monopolar spindles expressing GFH::PH and mCherry::H2B for visualization of the plasma membrane and the chromosomes, respectively (strain OD95). The timer starts at NEBD and OCC, visualized as blebbing at the membrane of cells with monopolar spindles, occurs at t = 5 minutes.
Movie S2.
Mitosis in the AB cell of a small control 2-cell embryo with monopolar spindles expressing GFH::PH and mCherry::H2B for visualization of the plasma membrane and the chromosomes, respectively (strain OD95). The timer starts at NEBD and OCC, visualized as blebbing at the membrane of cells with monopolar spindles, occurs at t = 8 minutes.
Movie S3.
Mitosis in the AB cell of a wild-type sized pch-2(tm1458) 2-cell embryo with monopolar spindles expressing GFH::PH and mCherry::H2B for visualization of the plasma membrane and the chromosomes, respectively (strain BHL575). The timer starts at NEBD and OCC, visualized as blebbing at the membrane of cells with monopolar spindles, occurs at t = 3 minutes.
Movie S4.
Mitosis in the AB cell of a small pch-2(tm1458) 2-cell embryo with monopolar spindles expressing GFH::PH and mCherry::H2B for visualization of the plasma membrane and the chromosomes, respectively (strain BHL575). The timer starts at NEBD and OCC, visualized as blebbing at the membrane of cells with monopolar spindles, occurs at t = 6 minutes.
To make these comparisons more clear, we binned our data. By our measurements, control AB cells ranged from 5 to 6 × 103 μm3. Therefore, we classified AB cells larger than 5 × 103 μm3 as wild type–sized. ani-2RNAi;zyg-1RNAi AB cells that were wild type–sized exhibited mitotic delays, while similarly sized pch-2;ani-2RNAi;zyg-1RNAi mutants produced no checkpoint response (Figure 1D). These data are consistent with what we have reported previously and report here for zyg-1RNAi and pch-2;zyg-1RNAi AB cells (Nelson et al., 2015 and Supplemental Figure S4). The remaining cells, which ranged from 1.5 × 10³ to 5 × 103 μm3, were partitioned equally into two classes: medium-sized embryos were between 3.3 × 10³ and 5 × 103 μm3 and small embryos were between 1.5 × 10³ and 3.3 × 103 μm3. When embryos were partitioned into these two classes, medium-sized cells in pch-2 mutants produced a checkpoint response intermediate between similarly sized control and mad-1 mutant cells, while small pch-2 cells had a robust checkpoint when compared with control and mad-1 mutant cells (Figure 1D).
We verified that the mitotic delay observed in pch-2 AB cells was a legitimate spindle checkpoint response by monitoring mitotic timing after performing double depletion of ani-2 and zyg-1 in san-1 and pch-2;san-1 mutant embryos. SAN-1 is the C. elegans ortholog of the essential spindle checkpoint factor Mad3 (Nystul et al., 2003; Supplemental Figure S1B). There was no significant difference between the slopes of the regression analyses of san-1 and pch-2;san-1 data (p = 0.8813), and the slopes of the models were not statistically different than zero (Supplemental Figure S1B). However, we observed a slight increase in the length of the cell cycle as cells got smaller in san-1 mutants, potentially reflecting that the spindle checkpoint in C. elegans is composed of two independent branches (Essex et al., 2009). Altogether, these data allow us to draw two important conclusions. First, the requirement for PCH-2 during spindle checkpoint activation is proportional to cell volume in AB cells with monopolar spindles. And second, since we observe mitotic timing in small pch-2 mutant AB cells similar to that in small control cells (Figure 1D), PCH-2 does not appear to affect spindle checkpoint silencing in C. elegans.
MAD-2 recruitment is partially restored to unattached kinetochores in pch-2 somatic cells experimentally reduced in size
We showed that PCH-2 is required for robust recruitment of Mad2 at unattached kinetochores during spindle checkpoint activation in AB cells of two-cell embryos (Nelson et al., 2015). Therefore, we tested whether the checkpoint-induced delay we observed in small pch-2;ani-2RNAi;zyg-1RNAi AB cells was accompanied by increased recruitment of GFP::MAD-2 at unattached kinetochores. We quantified GFP::MAD-2 recruitment at unattached kinetochores in pseudo-metaphase in control animals and pch-2 mutants treated with ani-2 and zyg-1 RNAi (Figure 2A) and plotted GFP::MAD-2 fluorescence against cell volume (Figure 2B). Surprisingly, the regression analysis for control AB cells had a positive slope, suggesting that less GFP::MAD-2 at unattached kinetochores is required for spindle checkpoint function as these cells became smaller (Figure 2B). This was despite similar levels of soluble GFP::MAD2 around mitotic chromosomes after NEBD in both genetic backgrounds (Supplemental Figure S2, A and B). We observed that the regression analysis of GFP::MAD-2 fluorescence at unattached kinetochores in pch-2;ani-2RNAi;zyg-1RNAi AB cells exhibited a negative slope, showing improved GFP::MAD-2 recruitment to unattached kinetochores as cells got smaller. However, the amount of GFP::MAD-2 was typically lower in fluorescence intensity than ani-2RNAi;zyg-1RNAi control cells (Figure 2B). Therefore, our experiments demonstrate that MAD-2 recruitment is partially restored to unattached kinetochores in pch-2 mutant somatic cells experimentally reduced in size.
FIGURE 2:

MAD-2 recruitment is partially restored to unattached kinetochores in pch-2 mutant somatic cells experimentally reduced in size. (A) Cartoon and images of GFP::MAD-2 recruitment to unattached kinetochores in AB cells of control and pch-2 AB cells treated with ani-2 and zyg-1 RNAi. Scale bar indicates 1 μm. (B) Quantification of kinetochore-bound GFP::MAD-2 in control and pch-2 AB cells plotted against cell volume. Lines represent least-squares regression models with 95% confidence intervals (gray-shaded areas) for each set of data. Equations and p values indicating whether slopes are significantly nonzero for each model are as follows: ani-2RNAi;zyg-1RNAi (blue): y = 1.531x + 5.024 and p = 0.0115; pch-2;ani-2RNAi;zyg-1RNAi (red): y = -1.384x + 7.911 and p = 0.0384.
MAD-2 dosage controls checkpoint strength
C. elegans meiotic nuclei in the germline exist in a syncytium and cellularize after completing meiotic prophase. Knockdown of ani-2 affects this cellularization event, resulting in a loss of cytoplasmic volume after nuclei are fully formed (Maddox et al., 2005). MAD-2 is localized to the nucleus and nuclear envelope in these oocytes (Bohr et al., 2015; Lawrence et al., 2015; Figure 3A). Because embryonic nuclear size is not affected by ani-2 RNAi (Supplemental Figure S3), we reasoned that as cells are genetically manipulated to decrease in cell volume, the absolute amount of Mad2 protein is likely to remain constant but its concentration to increase. Given that TRIP13 function is dispensable for checkpoint activation when O-Mad2 is readily available in human cells (Ma and Poon, 2018), we reasoned that something similar might be happening in C. elegans embryos. Specifically, we hypothesized that an increase in the concentration of Mad2, and O-Mad2 in particular, may explain the reduced requirement for PCH-2 in ani-2RNAi;zyg-1RNAi small AB cells (Figure 3B).
FIGURE 3:

MAD-2 dosage controls checkpoint strength. (A) Immunostaining of MAD-2 and nuclear pore complex components (NPCs) shows MAD-2 localized in the nucleus and at the nuclear envelope during interphase. Scale bar indicates 5 μm. (B) Model depicting how a decrease in cell volume might result in an increase in the local concentration of O-Mad2 in ani-2RNAi;zyg-1RNAi embryos, in contrast to zyg-1RNAi embryos. (C) Mitotic timing, as measured from nuclear envelope breakdown (NEBD) to the onset of cortical contractility (OCC), in AB cells of control and mad-2/+ mutant embryos plotted against cell volume. Lines represent least-squares regression models with 95% confidence intervals (gray-shaded areas) for each set of data. Equations and p values indicating whether slopes are significantly nonzero for each model are as follows: control (dark purple): y = -1.302x + 8.477 and p = 0.0002; mad-2/+ (light purple): y = -0.3171x + 4.402 and p = 0.0395.
To test this possibility, we initially attempted to visualize O-Mad2 directly in C. elegans embryos. Unfortunately, we were unable to perform this experiment with a commercial antibody (unpublished data). Further, we could not directly probe total Mad2 concentration as cells decreased in volume upon treatment with ani-2 RNAi because GFP::MAD-2 did not localize to the nucleus and instead localized in the cytoplasm until NEBD (Essex et al., 2009; Nelson et al., 2015), making it an inaccurate reporter for this assay. Instead, we tested whether reducing Mad2 dosage affected checkpoint strength. We hypothesized that if Mad2 concentration influences checkpoint strength, reducing it by half should attenuate checkpoint strength in comparison to that in control animals. We performed double depletion of ani-2 and zyg-1 by RNAi in mad-2 heterozygotes. Indeed, mad-2 heterozygotes exhibited stronger spindle checkpoint strength as cells became smaller. However, the increase in spindle checkpoint strength was less robust than in control cells (Figure 3C). The slopes of the linear regressions for both control and mad-2 heterozygotes were significantly nonzero, in contrast to similar experiments with mad-1 and san-1 homozygotes (Figure 1B and Supplemental Figure S1D). Therefore, spindle checkpoint strength depends on MAD-2 dosage.
We wondered whether the decrease in Mad2 protein levels might restore the reliance on PCH-2 in small embryos. However, pch-2;mad-2/+ double mutants exhibited a substantial decrease in the production and viability of embryos, preventing us from performing these experiments: pch-2;mad-2/+ double mutants produced broods that were 14% of control animals, and only 1% of these embryos were viable. Further, pch-2;mad-2 double mutants could not be recovered from pch-2;mad-2/+ mothers, a genetic interaction that we did not observe when we generated pch-2;mad-1 double mutants (Bohr et al., 2015) or pch-2;san-1 double mutants (Supplemental Figure S1B). Worms with mutations in some spindle checkpoint mutants often display defects in fertility, viability, and development (Kitagawa and Rose, 1999; Stein et al., 2007; Lara-Gonzalez et al., 2019). Thus, in addition to MAD-2 dosage controlling checkpoint strength, it collaborates with PCH-2 to promote C. elegans fertility and viability.
PCH-2 affects spindle checkpoint strength during embryogenesis
During embryogenesis, cell volume decreases and spindle checkpoint strength increases (Galli and Morgan, 2016; Gerhold et al., 2018). Given that the requirement for PCH-2 is proportional to cell volume in two-cell embryos treated with ani-2 RNAi, we assessed the role of PCH-2 in spindle checkpoint activation as cells decreased in size during normal embryogenesis.
We initially performed these experiments in embryos treated with nocodazole, which depolymerizes microtubules and induces spindle checkpoint activation in a manner similar to that when cells have monopolar spindles (Galli and Morgan, 2016; Gerhold et al., 2018). We permeabilized embryos by performing perm-1 RNAi (Carvalho et al., 2011) and treated these embryos with nocodazole. Because we could not reliably visualize OCC in these dividing embryos, we measured mitotic timing from NEBD to decondensation of chromosomes (DECON) in cells of the AB lineage. These cells in control embryos exhibited a longer mitotic delay in 16-cell than in four-cell embryos (Figure 4A), verifying that the spindle checkpoint increases in strength as cells decrease in volume during embryogenesis (Galli and Morgan, 2016; Gerhold et al., 2018). As a control, we performed the same experiment in san-1 mutants and did not detect a mitotic delay when these embryos were treated with nocodazole (Figure 4A). Cells in four-cell pch-2 mutant embryos treated with nocodazole showed greater variability in cell cycle timing than san-1 mutants, but the average was not significantly different (Figure 4A). However, cells in the AB lineage in 16-cell pch-2 mutant embryos treated with nocodazole exhibited a slight but significant cell cycle delay compared with similar cells in pch-2 mutants treated with DMSO and san-1 mutants treated with nocodazole. Thus, as cells of the AB lineage naturally decrease in cell size to 16-cell embryos, pch-2 mutants treated with nocodazole exhibit some delay in the cell cycle, albeit not as prolonged as in control embryos, consistent with a defect in spindle checkpoint strength.
FIGURE 4:

PCH-2 regulates spindle checkpoint strength during embryogenesis. (A) Mitotic timing, as measured from nuclear envelope breakdown (NEBD) to decondensation of chromatin (DECON), in control and pch-2 and san-1 mutant embryos treated with perm-1 RNAi and DMSO or nocodazole at different developmental stages (4- and 16-cell embryos). (B) Mitotic timing in control and pch-2 mutant embryos overexpressing GFP::MAD-2 and treated with perm-1 RNAi and either DMSO or nocodazole at different developmental stages (4- and 16-cell embryos). (C) Mitotic timing in zyg-1ts and pch-2;zyg-1ts mutant embryos at different developmental stages (2-, 4-, and 8-cell embryos). All error bars are 95% confidence intervals.
Given our hypothesis that Mad2 dosage might contribute to spindle checkpoint strength, particularly in pch-2 mutants, we tested if a subtle increase in MAD-2 protein levels would suppress the defect in spindle checkpoint function or strength in pch-2 mutant embryos. The presence of a GFP::MAD-2 transgene, in addition to endogenous MAD-2, results in about 2.5 times more MAD-2 in worms. This slight overexpression generates a normal spindle checkpoint response in control AB cells and can bypass the requirement for checkpoint components MAD-3 or BUB-3 (Essex et al., 2009), but not PCH-2 (Nelson et al., 2015), in AB cells of two-cell embryos with monopolar spindles. Overexpression of MAD-2 did not affect the checkpoint response in 16-cell pch-2 embryos (Figure 4B). However, in contrast to our results in four-cell pch-2 mutant embryos treated with nocodazole (Figure 4A), we found that overexpression of MAD-2 in cells of the AB lineage of four-cell pch-2 embryos produced cell cycle delays compared with the same cells in embryos treated with DMSO. Again, these delays were not as dramatic as in control cells overexpressing GFP::MAD-2 (Figure 4B) but were significant, allowing us to conclude that slight overexpression of Mad2 partially restores checkpoint function to pch-2 mutants as cells of the AB lineage decrease in size during embryogenesis, at least in four-cell embryos.
Given that we activated the spindle checkpoint in ani-2RNAi embryos by generating monopolar spindles (Figures 1C and 3C), we also formally tested whether pch-2 mutant embryos with monopolar spindles exhibited defects in checkpoint strength, particularly in very early embryogenesis. We used a fast-acting temperature-sensitive allele of zyg-1 (zyg-1ts) (O’Rourke et al., 2011) to activate the spindle checkpoint in developing embryos with two, four, and eight cells. We shifted embryos at different stages of development, verified the appearance of monopolar spindles, and measured mitotic timing from NEBD to DECON. In control zyg-1ts mutant embryos, we observed a delay in mitotic timing in cells from the AB lineage ,and this delay became only marginally longer as embryos had more cells (Figure 4C), similarly to previous reports (Gerhold et al., 2018). In stark contrast to our ani-2RNAi experiments, the mitotic timing observed in pch-2;zyg-1ts mutant embryos was the same in AB cells of two-, four-, and eight-cell embryos and significantly reduced in comparison to zyg-1ts embryos. Thus, similar to our results with four-cell pch-2 mutant embryos treated with nocodazole, pch-2 mutants exhibit no cell cycle delay in the presence of monopolar spindles in AB cells in two-, four-, and eight-cell embryos. However, additional considerations may make direct comparisons between our ani-2RNAi;zyg-1RNAi experiments and zyg-1ts embryos difficult (see Discussion).
PCH-2 is responsible for the stronger spindle checkpoint in the germline lineage
Cell fate is another important determinant of spindle checkpoint strength. In C. elegans embryos, the spindle checkpoint is stronger in germline precursor cells than in similarly sized somatic counterparts (Galli and Morgan, 2016; Gerhold et al., 2018). However, as we observed with AB cells (Nelson et al., 2015), PCH-2 is essential for the spindle checkpoint in wild type–sized P1 cells (Supplemental Figure S4). Therefore, having established that PCH-2 becomes dispensable for the spindle checkpoint as two-cell embryos are genetically manipulated to become smaller (Figure 1, C and D), we tested whether PCH-2 contributed to the stronger spindle checkpoint in P1 cells of two-cell embryos treated with ani-2 RNAi (Figure 5 and Supplemental Figure S4B). Consistent with other reports (Galli and Morgan, 2016; Gerhold et al., 2018), when we performed double depletion of ani-2 and zyg-1 in control embryos and monitored mitotic timing, we observed P1 cells with volumes similar to those of AB cells exhibiting a longer cell cycle delay (Figure 5A and Supplemental Figure S4B; Supplemental Videos 5 and 6). Further, the regression analysis that best fit control P1 data is significantly different and steeper than that of control AB cells (p < 0.0001), indicating that variables in addition to cell volume contribute to the spindle checkpoint strength in germline precursor cells. When we knocked down both ani-2 and zyg-1 in pch-2 mutant embryos, we no longer observed a significant difference (p = 0.9096) between the slopes of the regression analysis of P1 and AB cells (Figure 5B and Supplemental Figure S4B; Supplemental Videos 7 and 8), indicating that PCH-2 is responsible for the stronger checkpoint in P1 cells.
FIGURE 5:

PCH-2 is responsible for the stronger spindle checkpoint in the germline lineage. Mitotic timing, as measured from nuclear envelope breakdown (NEBD) to the onset of cortical contractility (OCC), in AB and P1 cells plotted against cell volume in control ani-2RNAi;zyg-1RNAi embryos (A) or pch-2;ani-2RNAi;zyg-1RNAi (B) embryos. Lines represent least-squares regression models with 95% confidence intervals (gray-shaded areas) for each set of data. Equations and p values indicating whether slopes are significantly nonzero for each model are as follows: ani-2RNAi;zyg-1RNAi AB (dark blue): y = -1.117x + 11.15 and p < 0.0001; ani-2RNAi;zyg-1RNAi P1 (light blue): y = -8.047x + 32.27 and p = 0.0021; pch-2;ani-2RNAi;zyg-1RNAi AB (red): y = -1.264x + 10.50 and p < 0.0001; pch-2;ani-2RNAi;zyg-1RNAi P1 (pink): y = -1.218x + 7.75 and p = 0.0125. Data for AB cells in both control and pch-2 mutants are the same as in Figure 1C. (C) Mitotic timing of AB and P1 cells in controls and in pch-2 and mad-1 mutants during unperturbed divisions. Error bars are 95% confidence intervals.
Movie S5.
Mitosis in the P1 cell of a wild-type sized control 2-cell embryo with monopolar spindles expressing GFH::PH and mCherry::H2B for visualization of the plasma membrane and the chromosomes, respectively (strain OD95). The timer starts at NEBD and OCC, visualized as deformation of the membrane of cells with monopolar spindles, occurs at t = 9 minutes.
Movie S6.
Mitosis in the P1 cell of a small control 2-cell embryo with monopolar spindles expressing GFH::PH and mCherry::H2B for visualization of the plasma membrane and the chromosomes, respectively (strain OD95). The timer starts at NEBD and OCC, visualized as deformation of the membrane of cells with monopolar spindles, occurs at t = 26 minutes.
Movie S7.
Mitosis in the P1 cell of a wild-type sized pch-2(tm1458) 2-cell embryo with monopolar spindles expressing GFH::PH and mCherry::H2B for visualization of the plasma membrane and the chromosomes, respectively (strain BHL575). The timer starts at NEBD and OCC, visualized as deformation of the membrane of cells with monopolar spindles, occurs at t = 3 minutes.
Movie S8.
Mitosis in the P1 cell of a small pch-2(tm1458) 2-cell embryo with monopolar spindles expressing GFH::PH and mCherry::H2B for visualization of the plasma membrane and the chromosomes, respectively (strain BHL575). The timer starts at NEBD and OCC, visualized as deformation of the membrane of cells with monopolar spindles, occurs at t = 7 minutes.
We observed that cell cycle timing was faster in pch-2 mutant P1 cells than similarly sized pch-2 mutant AB cells after treatment with ani-2 and zyg-1 RNAi (Figure 5B and Supplemental Figure S4B). We wondered if embryonic germline precursor cells might rely on some spindle checkpoint proteins for normal mitotic timing, analogously to mitotically dividing stem cells in the C. elegans germline (Gerhold et al., 2015) and similarly to mammalian cultured cells (Meraldi et al., 2004; Rodriguez-Bravo et al., 2014; Ma and Poon, 2016). To address this, we measured normal mitotic timing in AB and P1 cells of both control and pch-2 mutant embryos. We found that while normal mitotic timing is unaffected by mutation of pch-2 in AB cells, pch-2 mutant P1 cells go through mitosis significantly faster than control P1 cells (Figure 5C), thus providing an explanation for the faster cell cycle timing in pch-2 mutant P1 cells with the same cell volume as pch-2 mutant AB cells after treatment with ani-2 and zyg-1 RNAi. We saw a decrease in the cell cycle timing of P1 cells in mad-1 mutants but this was not significantly different than control P1 cells (Figure 5C).
PCH-2′s enrichment in P 1 cells depends on PAR-1 and PAR-6
Cell fate is driven by the asymmetric distribution of various determinants between somatic and germline lineages during early divisions of the C. elegans embryo (Rose and Gonczy, 2014). Because we found that PCH-2 promoted the spindle checkpoint strength in both AB and P1 cells, but even more dramatically in P1 cells, we asked if PCH-2 was regulated differently between these cells. First, we tested whether PCH-2::GFP could also support the stronger checkpoint in P1 cells. We treated embryos expressing PCH-2::GFP with zyg-1 RNAi and evaluated mitotic timing in both AB and P1 cells, using chromosome decondensation as a marker for mitotic exit. P1 cells expressing PCH-2::GFP had full checkpoint function, exhibiting a mitotic delay longer than that in AB cells also expressing PCH-2::GFP and not significantly different from that in control P1 cells treated with zyg-1 RNAi (Figure 6A).
FIGURE 6:

PCH-2′s enrichment around mitotic chromosomes in P1 cells depends on PAR-1. (A) Mitotic timing of control embryos and embryos expressing PCH-2::GFP during unperturbed divisions or in the presence of monopolar spindles. (B) Cartoon and images of PCH-2::GFP localization around mitotic chromosomes in AB and P1 cells of two-cell embryos. Scale bar indicates 5 μm. (C) Quantification of PCH-2::GFP fluorescence in AB and P1 cells. (D) Cartoon and images of PCH-2::GFP localization around mitotic chromosomes in AB and P1 cells of control RNAi and par-1RNAi two-cell embryos. (E) Quantification of PCH-2::GFP fluorescence in AB and P1 cells of par-1RNAi embryos. All error bars are 95% confidence intervals. NS indicates not significant.
Previous transcriptome analysis of PCH-2 did not reveal asymmetric enrichment of PCH-2 mRNA between AB and P1 cells (Tintori et al., 2016). We tested whether PCH-2::GFP exhibited differences in protein levels between AB and P1 cells. First, we assessed whether PCH-2::GFP was more enriched in pseudo-metaphase at unattached kinetochores in P1 than AB cells. We quantified PCH-2::GFP fluorescence at unattached kinetochores in both AB and P1 cells of embryos treated with zyg-1 RNAi but did not detect any difference between the two cell types (Supplemental Figure S5, A and B). Similarly, we did not detect any difference in GFP::MAD-2 recruitment at unattached kinetochores between AB and P1 cells in zyg-1RNAi embryos (Supplemental Figure S5, C and D).
Checkpoint factors, including MAD-2 and PCH-2, form a diffuse “cloud” around mitotic chromosomes after NEBD, even during normal cell cycles (Essex et al., 2009; Nelson et al., 2015). We wondered if PCH-2::GFP fluorescence in this cloud might be different between AB and P1 cells. First, we verified that PCH-2::GFP fluorescence around mitotic chromosomes was similar between AB cells during unperturbed (control) or monopolar mitosis (zyg-1RNAi; Supplemental Figure S6). PCH-2::GFP fluorescence around chromosomes was significantly higher in zyg-1RNAi AB cells than in control AB cells (Supplemental Figure S6B). However, we noticed that the area occupied by PCH-2::GFP in control AB cells was significantly larger than that of zyg-1RNAi AB cells (yellow dashed circle in Supplemental Figure S6A and quantified in Supplemental Figure S6C). When we factored this larger area of PCH-2::GFP fluorescence into our analysis, we observed a similar amount of PCH-2::GFP around mitotic chromosomes in both control and zyg-1RNAi AB cells (Supplemental Figure S6D).
Having established that AB cells had similar amounts of PCH-2::GFP whether the checkpoint was active or not, we quantified PCH-2::GFP fluorescence in the area around mitotic chromosomes in AB and P1 cells during unperturbed cell cycles. Similarly to AB cells (Nelson et al., 2015 and Supplemental Figure S6A), we observed PCH-2::GFP enriched in the area around the chromosomes in prometaphase in P1 cells (Figure 6B). When we quantified the fluorescence of PCH-2::GFP in this area surrounding chromosomes after NEBD in both AB and P1 cells, we detected a statistically significant enrichment of PCH-2::GFP in the area surrounding chromosomes in P1 cells (Figure 6C) but not in the cytoplasm of P1 cells (Supplemental Figure S7, A and B). Although this enrichment is limited to a “cloud” around mitotic chromosomes (see Supplemental Figure S7B), we verified that this enrichment was not the indirect consequence of the smaller volume of P1 cells by quantifying PCH-2::GFP fluorescence in gpr-1/2RNAi embryos. This double knockdown equalizes the size of AB and P1 cells without affecting their cell fate (Colombo et al., 2003; Gotta et al., 2003; Srinivasan et al., 2003). RNAi of gpr-1/2 showed variability in the effect on AB and P1 cell size (Supplemental Figure S7C). However, when we limited our analysis of PCH-2::GFP fluorescence to embryos in which AB and P1 cells were of similar area (red symbols in Supplemental Figure S7C), we observed an enrichment of PCH-2::GFP in P1 cells similar to that in control embryos (Supplemental Figure S7, D and E).
To better understand the relationship between PCH-2 enrichment in P1 cells and cell fate, we abrogated the asymmetry of the two-cell embryo by performing RNAi against the essential polarity factors, PAR-1 (Guo and Kemphues, 1995) and PAR-6 (Hung and Kemphues, 1999). These factors antagonize each other, with PAR-6 at the anterior cortex and PAR-1 at the posterior cortex of early embryos, to establish asymmetries during the first two embryonic divisions (Goldstein and Macara, 2007). In par-1RNAi and par-6RNAi mutant embryos, AB and P1 cells exhibit similar checkpoint strength (Gerhold et al., 2018), indicating that the stronger spindle checkpoint response in P1 cells depends on this asymmetric division. Despite the loss of cell fate in par-1RNAi and par-6RNAi embryos, we will refer to the anterior blastomere as “AB” and the posterior as “P1.” We verified the efficiency of par-1 and par-6 RNAi by measuring cell area and found that AB and P1 cells approached similar sizes in both conditions (Supplemental Figure S8, A and B), although AB cells were still significantly larger than P1 cells in par-1RNAi mutant embryos (Supplemental Figure S8A). We quantified PCH-2::GFP fluorescence in the area around chromosomes in AB and P1 cells after par-1 RNAi and observed that the fluorescence of PCH-2::GFP, despite being slightly lower in P1 cells, was not significantly different between AB and P1 cells, unlike what we observed in embryos exposed to control RNAi (Figure 6, D and E). AB and P1 cells treated with par-6 RNAi showed equal PCH-2::GFP fluorescence (Supplemental Figure S8, C and D). Therefore, PCH-2::GFP’s enrichment around mitotic chromosomes in P1 cells depends on the conserved factors that induce embryonic asymmetry and germline cell fate, PAR-1 and PAR-6.
The stronger checkpoint in P 1 cells depends on CMT-1
In vitro, the C. elegans ortholog of p31comet, CMT-1, is required for PCH-2 to bind and remodel Mad2 (Ye et al., 2015). In addition to this role, CMT-1 is also needed to localize PCH-2 to unattached kinetochores and generate a robust spindle checkpoint response in AB cells (Nelson et al., 2015). Therefore, we reasoned that CMT-1 might also be needed for the stronger checkpoint in P1 cells.
To test this possibility, we first performed double knockdown of ani-2 and zyg-1 in cmt-1 mutants and monitored the length of the spindle checkpoint response as AB and P1 cells became smaller (Figure 7A; Supplemental Videos 9-12). When the results were compared with the regression model for control AB cells (opaque blue line in Figure 7A), we saw that cmt-1 AB cells consistently exhibit a weaker checkpoint at all cell volumes. Similarly to pch-2;ani-2RNAi;zyg-1RNAi mutants (Figure 5B), the stronger spindle checkpoint response in P1 cells was lost in cmt-1;ani-2RNAi;zyg-1RNAi mutants and we did not observe any statistical difference between the between the slopes of the regression analysis of P1 and AB cells (p = 0.9403). We also observed that cell cycle timing was faster in cmt-1 P1 cells that were similar in volume to cmt-1 AB cells (Figure 7A). Thus, CMT-1 is also essential to promote spindle checkpoint strength in germline precursor cells.
FIGURE 7:

The stronger checkpoint in P1 cells depends on CMT-1. (A) Mitotic timing, as measured from nuclear envelope breakdown (NEBD) to the onset of cortical contractility (OCC), in AB and P1 cells plotted against cell volume in cmt-1;ani-2RNAi;zyg-1RNAi embryos. Lines represent least-squares regression models with 95% confidence intervals (gray-shaded areas) for each set of data. The opaque blue line represents the regression model of the control AB data from Figure 1C. Equations and p values indicating whether slopes are significantly nonzero for each model are as follows: cmt-1;ani-2RNAi;zyg-1RNAi AB (dark green): y = -0.713x + 7.44 and p = 0.0050; cmt-1;ani-2RNAi;zyg-1RNAi P1 (light green): y = -0.6767x + 5.291 and p = 0.0452. (B) Mitotic timing of control and cmt-1 and mad-1 mutant embryos during unperturbed divisions or in the presence of monopolar spindles. (C) Cartoon and images of PCH-2::GFP localization around mitotic chromosomes in AB and P1 cells of cmt-1 mutant embryos. Scale bar indicates 5 μm. (D) Quantification of PCH-2::GFP fluorescence in AB and P1 cells of cmt-1 mutant embryos. All error bars are 95% confidence intervals. NS indicates not significant.
Movie S9.
Mitosis in the AB cell of a wild-type sized cmt-1(ok2879) 2-cell embryo with monopolar spindles expressing GFH::PH and mCherry::H2B for visualization of the plasma membrane and the chromosomes, respectively (strain BHL608). The timer starts at NEBD and OCC, visualized as blebbing at the membrane of cells with monopolar spindles, occurs at t = 4 minutes.
Movie S10.
Mitosis in the AB cell of a small cmt-1(ok2879) 2-cell embryo with monopolar spindles expressing GFH::PH and mCherry::H2B for visualization of the plasma membrane and the chromosomes, respectively (strain BHL608). The timer starts at NEBD and OCC, visualized as blebbing at the membrane of cells with monopolar spindles, occurs at t = 6 minutes.
Movie S11.
Mitosis in the P1 cell of a wild-type sized cmt-1(ok2879) 2-cell embryo with monopolar spindles expressing GFH::PH and mCherry::H2B for visualization of the plasma membrane and the chromosomes, respectively (strain BHL608). The timer starts at NEBD and OCC, visualized as deformation of the membrane of cells with monopolar spindles, occurs at t = 4 minutes.
Movie S12.
Mitosis in the P1 cell of a small cmt-1(ok2879) 2-cell embryo with monopolar spindles expressing GFH::PH and mCherry::H2B for visualization of the plasma membrane and the chromosomes, respectively (strain BHL608). The timer starts at NEBD and OCC, visualized as deformation of the membrane of cells with monopolar spindles, occurs at t = 5 minutes.
We also performed zyg-1 RNAi on control and cmt-1 mutant embryos and monitored mitotic timing in both AB and P1 cells. AB and P1 cells of control and cmt-1 mutant embryos treated with control RNAi had similar mitotic timing. Unlike similar experiments in pch-2 mutants (Figure 5C), we did not detect a statistically significant difference between cell cycle time in P1 cells between wild-type and cmt-1 mutant embryos (Figure 7B), suggesting that ani-2RNAi;zyg-1RNAi embryos might be more sensitive to subtle perturbations in cell cycle timing. In zyg-1RNAi embryos, P1 cells exhibited a stronger checkpoint response than AB cells (Figure 7B). In contrast, both AB and P1 cells in cmt-1;zyg-1RNAi mutant embryos exhibited similar spindle checkpoint delays (Figure 7B). Despite having spindle checkpoint responses that were less robust than that of control zyg-1RNAi embryos, AB and P1 cells in cmt-1 mutant embryos treated with zyg-1 RNAi spent significantly longer in mitosis than cmt-1 mutant embryos treated with control RNAi (Figure 7B), indicating that they activated a weaker spindle checkpoint response, similar to our published results (Nelson et al., 2015). More importantly, cmt-1;zyg-1RNAi mutant embryos failed to generate a stronger checkpoint in P1 cells, consistent with cmt-1;ani-2RNAi;zyg-1RNAi experiments (Figure 7A).
Aside from localizing PCH-2 to unattached kinetochores (Nelson et al., 2015), we wondered if CMT-1 was required for any other aspects of PCH-2 regulation. Therefore, we tested whether CMT-1 was necessary for PCH-2′s asymmetric enrichment in P1 cells. We quantified PCH-2::GFP fluorescence in prometaphase in the area around chromosomes in both cmt-1 mutant AB and P1 cells (Figure 7C). First, we found that PCH-2::GFP fluorescence was slightly higher in AB cells in cmt-1 mutants than in control embryos (Figure 7D). We saw a similar result in our par-1 RNAi experiments, although in both cases these increases were not statistically significant. However, unlike the case with par-1RNAi embryos (Gerhold et al., 2018), this increase in PCH-2::GFP was not accompanied by an increase in checkpoint strength (Figure 7B), consistent with our hypothesis that the weaker checkpoint in cmt-1 AB cells is a consequence of PCH-2′s absence from unattached kinetochores (Nelson et al., 2015). Further, when we compared the quantification of PCH-2::GFP fluorescence in cmt-1 mutant AB and P1 cells (Figure 7C), we did not detect a significant difference between the two types of cells (Figure 7D), unlike our experiment in control embryos (Figure 6, B and C), indicating that CMT-1 contributes to the asymmetric enrichment of PCH-2 in P1 cells. Thus, CMT-1 promotes spindle checkpoint strength through two mechanisms: localizing PCH-2 to unattached kinetochores and ensuring its enrichment in germline precursor cells.
DISCUSSION
The role of PCH-2, and its mammalian ortholog TRIP13, in the spindle checkpoint has been enigmatic (see Table 1). Originally identified as a checkpoint silencing factor (Eytan et al., 2014; Wang et al., 2014; Miniowitz-Shemtov et al., 2015; Ye et al., 2015; Brulotte et al., 2017; Alfieri et al., 2018), more recent evidence also indicates a role in promoting the checkpoint response (Nelson et al., 2015; Ma and Poon, 2016, 2018; Yost et al., 2017). It is clear that the reliance on PCH-2/TRIP13 in checkpoint activation reflects the relative levels and availability of O-Mad2 (Ma and Poon, 2018). We show here that PCH-2 also controls checkpoint strength. Surprisingly, we can uncouple PCH-2′s requirement for checkpoint activation, which we detect in both AB and P1 cells of wild type–sized two-cell embryos (Nelson et al., 2015 and Supplemental Figure S4), from the requirement for spindle checkpoint strength, which we observe when we genetically manipulate the cell size of two-cell embryos by ani-2 RNAi (Figures 1C and 5B). Based on this, we propose that PCH-2 regulates checkpoint strength not simply by regulating O-Mad2 availability, but by doing so specifically at and near unattached kinetochores, providing an unanticipated mechanism to explain this phenomenon (Figure 8). Given that cmt-1 mutants exhibit decreased Mad2 protein levels (Nelson et al., 2015), suggesting that CMT-1′s binding to C-Mad2 stabilizes the protein in C. elegans, we speculate that PCH-2 is specifically disassembling a C-Mad2/CMT-1 complex to generate this pool of O-Mad2. This role in checkpoint strength appears to be particularly important in large cells, such as oocytes and cells in early embryos, as well as cells that give rise to immortal germ cells.
FIGURE 8:

Model. (A) A robust spindle checkpoint response in large cells requires the presence of PCH-2 at unattached kinetochores to increase the local concentration of O-MAD-2 at and near unattached kinetochores. (B) Reducing cell volume of two-cell embryos increases the concentration of O-Mad-2 at and near unattached kinetochores, allowing a checkpoint response in the absence of PCH-2. (C) The enrichment of PCH-2 around mitotic chromosomes in P1 cells results in a greater production of O-MAD-2, generating a stronger spindle checkpoint response in these cells.
Our model assumes that two-cell embryos have a significant amount of O-Mad2 available, even when PCH-2 function is lost (Figure 8), unlike what is reported in human cells (Ma and Poon, 2016). Given that this is a developmental system in which embryos have undergone only a single mitotic division before we perform our assays and newly synthesized Mad2 adopts the open conformation (Kim et al., 2018), we propose that O-Mad2 is not limiting in very early embryos, even in pch-2 null mutants. In this way, C. elegans two-cell embryos would be analogous to human cells undergoing cell division soon after acute depletion of TRIP13 (Ma and Poon, 2018). Unfortunately, we were unable to directly probe O-Mad2 concentration or its availability at or near unattached kinetochores in small ani-2RNAi embryos or germline precursor cells. However, we think that several pieces of data support our model (Figure 8). PCH-2′s characterized biochemical activity regulates the availability of O-Mad2 (Ye et al., 2015; Brulotte et al., 2017; Alfieri et al., 2018), making this the likely mechanism through which PCH-2 regulates checkpoint strength. PCH-2 at unattached kinetochores in AB and P1 cells (Nelson et al., 2015 and Figure 7B) and its enrichment around mitotic chromosomes in P1 cells (Figures 5A and 6C) correlates with a stronger checkpoint. The loss of PCH-2 or this enrichment produces similar checkpoint strength between AB and P1 cells (Gerhold et al., 2018, Figures 1C, 5B, 6E, and 7, A and D, and Supplemental Figure S7D). Indeed, the equalization of PCH-2::GFP between AB and P1 cells that we observe in par-1RNAi and par-6RNAi embryos (Figure 6E and Supplemental Figure S8D) is entirely consistent with the observation that in these mutants, AB cells more closely resemble P1 cells in spindle checkpoint strength (Gerhold et al., 2018). Finally, checkpoint strength depends on Mad2 dosage (Figure 2C), particularly in AB cells of four-cell pch-2 mutant embryos (Figure 4B).
Another prediction of our model is that overexpression of Mad2 should also make PCH-2 dispensable for spindle checkpoint activation. We’ve shown that subtle elevations of Mad2 protein levels introduce a cell cycle delay in AB cells of four-cell embryos treated with nocodazole but not those treated with DMSO (Figure 4B), entirely consistent with our model. However, it is not clear why we do not observe a similar effect in cells of the AB lineage of 16-cell embryos that overexpress Mad2 (Figure 4B). Unfortunately, more dramatic overexpression experiments are technically difficult in C. elegans. Further, it is likely that strong overexpression of Mad2 in C. elegans embryos will delay normal mitosis, consistent with similar findings in mammalian cells (Marks et al., 2017) and budding yeast (Mariani et al., 2012). In this way, PCH-2′s function may provide a useful buffer: Because Mad2 protein levels may need to stay within a narrow range to allow normal mitotic timing, PCH-2′s localization at and near unattached kinetochores provide a mechanism to increase O-Mad2’s local concentration to promote effective and efficient signaling during checkpoint activation.
The requirement for PCH-2 in spindle checkpoint strength is also seen as AB cells normally decrease in volume during embryogenesis (Figure 4A), although not as dramatically as when we genetically manipulate cell size (Figure 1C). The inconsistency between our ani-2 and embryogenesis experiments could be explained by a variety of factors. O-Mad2 may eventually become limiting in cells of the AB lineage with successive divisions after the two-cell stage, resulting in a greater reliance on PCH-2 function. Moreover, it may also suggest that relative levels of O-Mad2 and C-Mad2 are more stringently regulated as embryonic development progresses and the multicellular embryo becomes more complex. This possibility is supported by our finding that PCH-2 regulates normal cell cycle timing in P1 cells, but not AB cells (Figure 5C), which implies that variations in O-Mad2/C-Mad2 ratios influence normal mitotic timing in cells with specific developmental fates. In addition, unlike the nuclei of two-cell embryos treated with ani-2RNAi (Supplemental Figure S3), nuclear volume scales with cell volume during embryogenesis (Gerhold et al., 2018). Therefore, the concentration of Mad2 may not necessarily increase as cell size decreases in cells of the developing embryo, making direct comparisons between small cells obtained by ani-2RNAi treatment and small cells resulting from normal embryogenesis challenging. Finally, recent reports have indicated that, during embryogenesis in other systems, cell volume may not be a major contributor to spindle checkpoint strength (Chenevert et al., 2019; Vazquez-Diez et al., 2019). Indeed, in C. elegans, when only AB cells are monitored during very early embryogenesis (the two- to eight-cell stage), they exhibit very minor increases, if any, in checkpoint strength (Galli and Morgan, 2016; Gerhold et al., 2018; Figure 4). This may suggest that cell fate is generally a more important determinant of spindle checkpoint strength during normal embryogenesis, potentially reconciling reports from a wide array of systems.
Our experiments identify CMT-1, the C. elegans ortholog of mammalian p31comet, as an important regulator of PCH-2 function and, as a result, checkpoint strength. In addition to its requirement in facilitating PCH-2′s ability to interact with its substrate, Mad2 (Miniowitz-Shemtov et al., 2015; Ye et al., 2015; Brulotte et al., 2017; Alfieri et al., 2018), CMT-1 localizes PCH-2 to unattached kinetochores (Nelson et al., 2015) and promotes PCH-2′s enrichment in P1 cells (Figure 7D). We propose that both of these roles contribute to checkpoint strength. In large AB cells, CMT-1 ensures PCH-2′s presence at unattached kinetochores, increasing the local concentration of O-Mad2, driving the production of soluble C-Mad2 and MCC and enforcing a robust checkpoint (Figure 8A). In P1 cells, the combination of PCH-2′s localization at kinetochores and its enrichment around chromosomes and near unattached kinetochores produces a checkpoint stronger than in somatic cells (Figure 8C). It is striking that, when CMT-1 is absent, AB cells, in which there is more PCH-2 (Figure 7D), and P1 cells, which are slightly smaller than AB cells, exhibit similar checkpoint strength (Figure 7B). This indicates that even these cells depend on PCH-2 to be present at unattached kinetochores to increase the local concentration of O-Mad2 and promote checkpoint strength.
P1 cells in both pch-2;ani-2RNAi;zyg-1RNAi and cmt-1;ani-2RNAi;zyg-1RNAi mutants show faster cell cycle timing than similarly sized AB cells of the same genotype (Figures 5B and 7A). However, only pch-2 mutants significantly affect cell cycle timing in unperturbed P1 cells (Figure 5C); P1 cells in cmt-1 and mad-1 mutants show accelerated cell cycle timing but this is not significantly faster than control (Figures 5C and 7B). Further, we do not detect significant acceleration of the cell cycle in P1 cells of pch-2;zyg-1RNAi or mad-1;zyg-1RNAi mutant embryos (Supplemental Figure S4 and Figure 7B). Given the rapidity of cell cycles in these early embryos, it is possible that ani-2RNAi;zyg-1RNAi experiments provide greater sensitivity to observe subtle accelerations in cell cycle timing and that some subset of spindle checkpoint components, including PCH-2, CMT-1, MAD-1, and MAD-2 regulate normal cell cycle timing in germline precursor cells, similarly to the role of MAD-1 and MAD-2 in germline mitotic nuclei (Gerhold et al., 2015). Unfortunately, we cannot test this with MAD-1 or MAD-2, since mad-1 and mad-2 mutants abolish the spindle checkpoint response in ani-2RNAi;zyg-1RNAi embryos (Gerhold et al., 2015 and Figure 1C). An alternative hypothesis that we do not favor is that only PCH-2 regulates cell cycle timing in P1 cells, in a mechanism independent of other spindle checkpoint proteins.
Evolutionary analysis across phyla has revealed a close coevolutionary relationship between PCH-2 and its orthologs and HORMA domain–containing proteins, including CMT-1 and Mad2 (Vleugel et al., 2012; van Hooff et al., 2017). However, some organisms that rely on the templated conversion of O-Mad2 to C-Mad2 to assemble the MCC, such as budding and fission yeasts (Nezi et al., 2006; Chao et al., 2012), either do not express their PCH-2 ortholog during mitosis (budding yeast; San-Segundo and Roeder, 1999) or do not have a PCH-2 ortholog in their genome (fission yeast; Wu and Burgess, 2006). This is potentially explained by cell volume: both budding and fission yeasts are two orders of magnitude smaller than mammalian cells and C. elegans embryos. They also undergo closed mitosis, in which the nuclear envelope does not break down, providing an additional opportunity to concentrate factors required for mitosis. We propose that recruiting O-Mad2 to unattached kinetochores may not present as great a challenge in these significantly smaller cells, making a factor required to increase the local concentration of O-Mad2 at unattached kinetochores unnecessary.
An obvious question our experiments raise is how PCH-2 is enriched in P1 cells. Germline precursor cells are transcriptionally silent until gastrulation (Seydoux et al., 1996) and sequencing of mRNA in early embryos shows that neither CMT-1 nor PCH-2 mRNA is enriched in germline precursor cells (Tintori et al., 2016), indicating that enrichment of PCH-2 is likely to occur at the level of protein regulation. Understanding this regulation, its control by developmental events and its effect on the relative levels of O-Mad2 and C-Mad2 in different cell types promise to be an exciting area of investigation.
MATERIALS AND METHODS
Worm strains
The C. elegans Bristol N2 (Brenner, 1974) was used as the wild-type strain. Most strains were maintained at 20°C, except for zyg-1(or297) strains, which were maintained at 15°C. See Supplemental Table S1 for the list of all the strains used in this study.
Immunostaining
Immunostaining was performed on adult worms 48 h after L4, as described in Bhalla and Dernburg (2005). The antibodies used were rabbit anti-MAD-2 (1/500; Essex et al., 2009) and mouse anti-MAb414 (1/400; Davis and Blobel, 1986). Secondary antibodies were Alexa Fluor 488 anti-rabbit (Invitrogen) and Cy3 anti-mouse (Jackson ImmunoResearch Laboratories) diluted at 1:500. Antibody against MAD-2 was a gift from A. Desai (Ludwig Institute/University of California, San Diego, La Jolla, CA).
Images were acquired on a DeltaVision Personal DV microscope (GE Healthcare) equipped with a 100 × NA 1.40 oil-immersion objective (Olympus) and a short ARC xenon lamp (GE Healthcare) and using a CoolSNAP charge-coupled camera (Roper Scientific). Z-stacks were collected at Z-spacing 0.2 µm and processed by constrained, iterative deconvolution. Imaging, image scaling, and analysis were performed using functions in the softWoRx software package (GE Healthcare). Projections were calculated by a maximum intensity algorithm. Composite images were assembled and some false coloring was performed with Fiji.
Live imaging of two-cell embryos
For live imaging of two-cell embryos, worms were dissected on glass coverslips in egg buffer and then mounted on 2% agar pads. Images were acquired every 1 min or 20 s on a DeltaVision Personal DV microscope as described in the previous section; except that the distance between two planes was 2 µm. Mitotic timing was measured from NEBD to OCC as described in Nelson et al. (2015). Cell volumes were measured as described in Galli and Morgan (2016). To measure the nuclear area, a sum projection of the embryo was generated 1 min before chromosomes began to condense and the area was measured with Fiji (Supplemental Figure S3A).
Live imaging of embryogenesis
After treatment with perm-1RNAi (see below), worms were dissected onto a coverslip with egg salt buffer (118 mM NaCl, 48 mM KCl) supplemented with 10 mM PIPES pH 7.3, 1 mM ATP, and 10 mM sucrose. Embryos and adult carcasses were transferred into a well of an eight-well plate (ibidi 1 μ-Slide 8 Well Glass bottom) that had been freshly coated with 0.1% poly-l-lysine solution (Sigma P8920) and washed extensively. Time-lapse videos were acquired with a Solamere spinning disk confocal system piloted by μManager software (Edelstein et al., 2014) and equipped with a Yokogawa CSUX-1 scan head, a Nikon (Garden City, NY) TE2000-E inverted stand, a Hamamatsu ImageEM × 2 camera, LX/MAS 489 nm and LS/MAS 561 nm lasers, and a Plan Apo × 60/1.4 numerical aperture oil objective. Acquisition times per frame were 50 ms using 5% of the lasers’ power for both channels, and images were obtained as stacks of planes at 2-μm intervals taken every 1 min. Nocodazole was added from a 5X stock to a final concentration of 50 μM after the first time point. Mitotic timing was measured from NEBD to DECON as described in Essex et al. (2009).
To image embryogenesis in zyg-1(or297) mutants, images were generated under the same conditions as described previously for the live imaging of two-cell embryos with a few modifications: images were acquired every 20 s on a DeltaVision Personal DV microscope in a room heated to 26°C. Mitotic timing was measured from NEBD to DECON as described in Essex et al. (2009).
Quantification of fluorescence intensity
To quantify GFP::MAD-2 and PCH-2::GFP levels, images were generated under the same conditions as described previously for the live imaging of two-cell embryos with a few modifications: only the area defined by the GFP cloud and mitotic chromosomes was imaged, the interval between the four planes was 1 μm, and images were collected every 20 s. Quantification of fluorescence at kinetochores was performed in Fiji as described in Moyle et al. (2014) and Nelson et al. (2015). Briefly, maximum-intensity projections of both mCh::H2B and GFP fusion proteins were made after the pseudo-metaphase plate was generated. The image was rotated so that the metaphase plate was vertical, channels were split, and the maximum GFP pixel was identified using the process function within a box on the unattached side of the metaphase plate. In the same x-plane, the maximum mCh::H2B pixel was found. The width was changed to 12 pixels and the maximum GFP signal intensity was recorded in this 12-pixel window centered at the mCherry maxima. The background GFP signal was calculated by taking the average GFP intensity of a four-pixel box in the same x-plane, eight pixels away from the maximum mCherry on the opposite side of the pseudo-metaphase plate to the maximum GFP (i.e., the attached side). This background GFP was then subtracted from the maximum to measure the kinetochore bound GFP fusion intensity. Fluorescence around mitotic chromosomes was quantified as described in Galli and Morgan (2016). Sum intensity projections were generated and fluorescence in the area around mitotic chromosomes was measured in Fiji. Background fluorescence was measured in a 30-pixel band around this “cloud” and subtracted from the initial fluorescence intensity to determine the final fluorescence value. In some of our movies, identifying a clear metaphase plate was more difficult in AB than in P1 cells. Therefore, to ensure that we were quantifying PCH-2::GFP fluorescence around mitotic chromosomes at the same stage in mitosis in these two cell types, PCH-2::GFP was quantified in frames that were normalized relative to NEBD and mitotic exit. To measure the cell volume, one Z-stack of the entire cell was taken at NEBD at Z-spacing 2 µm.
Feeding RNA interference (RNAi)
C. elegans strains were fed HT115 bacteria expressing the desired dsRNA after IPTG induction. Bacterial strains containing RNAi vectors were cultured overnight at 37°C and centrifuged, and the pellet was resuspended in 1/50 of the original volume. Concentrated culture (100 µl) was spotted onto a nematode growth medium plate containing 1 mM IPTG and 50 µg/μl of kanamycin or carbenicillin and the plate was incubated overnight at 37°C.
For ani-2 RNAi, gravid adults were bleached onto the RNAi plate and their progeny were allowed to develop at 20°C for 2.5 d. Then L4s were transferred to a fresh plate containing OP50 or zyg-1 RNAi bacteria.
For zyg-1 RNAi, L4s were transferred from an OP50 or ani-2 RNAi plate onto a zyg-1 RNAi plate and cultured at 20°C for 1.5 d.
For perm-1 RNAi, young adults (8 h post-L4) were incubated on perm-1 RNAi plates at 15°C for 16–20 h.
For par-1, par-6, and gpr-1/2 RNAi, gravid adults were bleached onto control RNAi (L4440) plates and their progeny were allowed to develop at 15°C for 3 d. L4s were then transferred onto par-1, par-6, or gpr-1/2 RNAi or control RNAi plates and incubated at 15°C for 3 d. For gpr-1/2 RNAi, “small” AB cells were identified by whether their area was at least one SD lower than the average of control AB cells and “large” P1 cells were identified by whether their area was at least one SD higher than the average of control P1 cells.
Statistical Analysis
All statistical analysis was performed using GraphPad Prism version 6 for Macintosh, including linear regression analysis and assessing the significance of these data (Figures 1C, 2B, 3C, 5A, B, and 7A and Supplemental Figure S1, C and D). In comparing two means, significance was assessed by performing two-tailed t tests (Figure 6C and Supplemental Figures S5, B and D, S6, B–D, and S7A). In graphs in which multiple means were tested, we performed ANOVA analysis with the Sidak post hoc test (Figures 1D, 5C, 6, A and E, and 7, B and D, and Supplemental Figures S4A and S8, A, B, and D). In all graphs, a * indicates p < 0.05, ** indicates p < 0.01, and *** p < 0.0001.
Supplementary Material
Acknowledgments
We would like to thank Arshad Desai, Karen Oegema, Susan Strome, and David Morgan for valuable strains and reagents. This work was supported by the NIH (Grants T32GM008646 [C.R.N. and A.R.] and R01GM097144 [N.B.]). Some strains were provided by the CGC, which is funded by NIH Office of Research Infrastructure Programs (P40 OD010440).
Abbreviations used:
- APC/C
anaphase promoting complex/cyclosome
- DECON
decondensation
- MCC
mitotic checkpoint complex
- NEBD
nuclear envelope breakdown
- OCC
onset of cortical contractility
- RNAi
RNA interference.
Footnotes
This article was published online ahead of print in MBoC in Press (http://www.molbiolcell.org/cgi/doi/10.1091/mbc.E20-05-0310) on July 22, 2020.
REFERENCES
- Alfieri C, Chang L, Barford D. (2018). Mechanism for remodeling of the cell cycle checkpoint protein MAD2 by the ATPase TRIP13. Nature , 274–278. [DOI] [PMC free article] [PubMed] [Google Scholar]
- Aravind L, Koonin EV. (1998). The HORMA domain: a common structural denominator in mitotic checkpoints, chromosome synapsis and DNA repair. Trends Biochem Sci , 284–286. [DOI] [PubMed] [Google Scholar]
- Bhalla N, Dernburg AF. (2005). A conserved checkpoint monitors meiotic chromosome synapsis in Caenorhabditis elegans. Science , 1683–1686. [DOI] [PubMed] [Google Scholar]
- Bohr T, Nelson CR, Klee E, Bhalla N. (2015). Spindle assembly checkpoint proteins regulate and monitor meiotic synapsis in C. elegans. J Cell Biol , 233–242. [DOI] [PMC free article] [PubMed] [Google Scholar]
- Brenner S. (1974). The genetics of Caenorhabditis elegans. Genetics , 71–94. [DOI] [PMC free article] [PubMed] [Google Scholar]
- Brulotte ML, Jeong BC, Li F, Li B, Yu EB, Wu Q, Brautigam CA, Yu H, Luo X. (2017). Mechanistic insight into TRIP13-catalyzed Mad2 structural transition and spindle checkpoint silencing. Nat Commun , 1956. [DOI] [PMC free article] [PubMed] [Google Scholar]
- Carvalho A, Olson SK, Gutierrez E, Zhang K, Noble LB, Zanin E, Desai A, Groisman A, Oegema K. (2011). Acute drug treatment in the early C. elegans embryo. PLoS One , e24656. [DOI] [PMC free article] [PubMed] [Google Scholar]
- Chao WC, Kulkarni K, Zhang Z, Kong EH, Barford D. (2012). Structure of the mitotic checkpoint complex. Nature , 208–213. [DOI] [PubMed] [Google Scholar]
- Chen RH, Shevchenko A, Mann M, Murray AW. (1998). Spindle checkpoint protein Xmad1 recruits Xmad2 to unattached kinetochores. J Cell Biol , 283–295. [DOI] [PMC free article] [PubMed] [Google Scholar]
- Chen RH, Waters JC, Salmon ED, Murray AW. (1996). Association of spindle assembly checkpoint component XMAD2 with unattached kinetochores. Science , 242–246. [DOI] [PubMed] [Google Scholar]
- Chenevert J, Roca M, Besnardeau L, Ruggiero A, Nabi D, McDougall A, Copley RR, Christians E, Castagnetti S. (2019). The spindle assembly checkpoint functions during early development in non-chordate embryos. bioRxiv. [DOI] [PMC free article] [PubMed] [Google Scholar]
- Collin P, Nashchekina O, Walker R, Pines J. (2013). The spindle assembly checkpoint works like a rheostat rather than a toggle switch. Nat Cell Biol , 1378–1385. [DOI] [PMC free article] [PubMed] [Google Scholar]
- Colombo K, Grill SW, Kimple RJ, Willard FS, Siderovski DP, Gonczy P. (2003). Translation of polarity cues into asymmetric spindle positioning in Caenorhabditis elegans embryos. Science , 1957–1961. [DOI] [PubMed] [Google Scholar]
- Date DA, Burrows AC, Summers MK. (2014). Phosphorylation regulates the p31Comet-mitotic arrest-deficient 2 (Mad2) interaction to promote spindle assembly checkpoint (SAC) activity. J Biol Chem , 11367–11373. [DOI] [PMC free article] [PubMed] [Google Scholar]
- Davis LI, Blobel G. (1986). Identification and characterization of a nuclear pore complex protein. Cell , 699–709. [DOI] [PubMed] [Google Scholar]
- De Antoni A, Pearson CG, Cimini D, Canman JC, Sala V, Nezi L, Mapelli M, Sironi L, Faretta M, Salmon ED, Musacchio A. (2005). The Mad1/Mad2 complex as a template for Mad2 activation in the spindle assembly checkpoint. Curr Biol , 214–225. [DOI] [PubMed] [Google Scholar]
- Dick AE, Gerlich DW. (2013). Kinetic framework of spindle assembly checkpoint signalling. Nat Cell Biol , 1370–1377. [DOI] [PMC free article] [PubMed] [Google Scholar]
- Edelstein AD, Tsuchida MA, Amodaj N, Pinkard H, Vale RD, Stuurman N. (2014). Advanced methods of microscope control using muManager software. J Biol Methods . [DOI] [PMC free article] [PubMed] [Google Scholar]
- Essex A, Dammermann A, Lewellyn L, Oegema K, Desai A. (2009). Systematic analysis in Caenorhabditis elegans reveals that the spindle checkpoint is composed of two largely independent branches. Mol Biol Cell , 1252–1267. [DOI] [PMC free article] [PubMed] [Google Scholar]
- Eytan E, Wang K, Miniowitz-Shemtov S, Sitry-Shevah D, Kaisari S, Yen TJ, Liu ST, Hershko A. (2014). Disassembly of mitotic checkpoint complexes by the joint action of the AAA-ATPase TRIP13 and p31(comet). Proc Natl Acad Sci USA , 12019–12024. [DOI] [PMC free article] [PubMed] [Google Scholar]
- Fava LL, Kaulich M, Nigg EA, Santamaria A. (2011). Probing the in vivo function of Mad1:C-Mad2 in the spindle assembly checkpoint. EMBO J , 3322–3336. [DOI] [PMC free article] [PubMed] [Google Scholar]
- Galli M, Morgan DO. (2016). Cell size determines the strength of the spindle assembly checkpoint during embryonic development. Dev Cell , 344–352. [DOI] [PMC free article] [PubMed] [Google Scholar]
- Gerhold AR, Poupart V, Labbe JC, Maddox PS. (2018). Spindle assembly checkpoint strength is linked to cell fate in the Caenorhabditis elegans embryo. Mol Biol Cell , 1435–1448. [DOI] [PMC free article] [PubMed] [Google Scholar]
- Gerhold AR, Ryan J, Vallee-Trudeau JN, Dorn JF, Labbe JC, Maddox PS. (2015). Investigating the regulation of stem and progenitor cell mitotic progression by in situ imaging. Curr Biol , 1123–1134. [DOI] [PubMed] [Google Scholar]
- Goldstein B, Macara IG. (2007). The PAR proteins: fundamental players in animal cell polarization. Dev Cell , 609–622. [DOI] [PMC free article] [PubMed] [Google Scholar]
- Gotta M, Dong Y, Peterson YK, Lanier SM, Ahringer J. (2003). Asymmetrically distributed C. elegans homologs of AGS3/PINS control spindle position in the early embryo. Curr Biol , 1029–1037. [DOI] [PubMed] [Google Scholar]
- Guo S, Kemphues KJ. (1995). par-1, a gene required for establishing polarity in C. elegans embryos, encodes a putative Ser/Thr kinase that is asymmetrically distributed. Cell , 611–620. [DOI] [PubMed] [Google Scholar]
- Habu T, Kim SH, Weinstein J, Matsumoto T. (2002). Identification of a MAD2-binding protein, CMT2, and its role in mitosis. EMBO J , 6419–6428. [DOI] [PMC free article] [PubMed] [Google Scholar]
- Hung TJ, Kemphues KJ. (1999). PAR-6 is a conserved PDZ domain-containing protein that colocalizes with PAR-3 in Caenorhabditis elegans embryos. Development , 127–135. [DOI] [PubMed] [Google Scholar]
- Kim DH, Han JS, Ly P, Ye Q, McMahon MA, Myung K, Corbett KD, Cleveland DW. (2018). TRIP13 and APC15 drive mitotic exit by turnover of interphase- and unattached kinetochore-produced MCC. Nat Commun , 4354. [DOI] [PMC free article] [PubMed] [Google Scholar]
- Kitagawa R, Rose AM. (1999). Components of the spindle-assembly checkpoint are essential in Caenorhabditis elegans. Nat Cell Biol , 514–521. [DOI] [PubMed] [Google Scholar]
- Kyogoku H, Kitajima TS. (2017). Large Cytoplasm Is Linked to the Error-Prone Nature of Oocytes. Dev Cell , 287–298.e284. [DOI] [PubMed] [Google Scholar]
- Lara-Gonzalez P, Moyle MW, Budrewicz J, Mendoza-Lopez J, Oegema K, Desai A. (2019). The G2-to-M transition is ensured by a dual mechanism that protects Cyclin B from degradation by Cdc20-activated APC/C. Dev Cell , 313–325.e310. [DOI] [PMC free article] [PubMed] [Google Scholar]
- Lawrence KS, Chau T, Engebrecht J. (2015). DNA damage response and spindle assembly checkpoint function throughout the cell cycle to ensure genomic integrity. PLoS Genet , e1005150. [DOI] [PMC free article] [PubMed] [Google Scholar]
- Li Y, Benezra R. (1996). Identification of a human mitotic checkpoint gene: hsMAD2. Science , 246–248. [DOI] [PubMed] [Google Scholar]
- Luo X, Tang Z, Rizo J, Yu H. (2002). The Mad2 spindle checkpoint protein undergoes similar major conformational changes upon binding to either Mad1 or Cdc20. Mol Cell , 59–71. [DOI] [PubMed] [Google Scholar]
- Luo X, Tang Z, Xia G, Wassmann K, Matsumoto T, Rizo J, Yu H. (2004). The Mad2 spindle checkpoint protein has two distinct natively folded states. Nat Struct Mol Biol , 338–345. [DOI] [PubMed] [Google Scholar]
- Ma HT, Poon RY. (2016). TRIP13 regulates both the activation and inactivation of the spindle-assembly checkpoint. Cell Rep , 1086–1099. [DOI] [PubMed] [Google Scholar]
- Ma HT, Poon RYC. (2018). TRIP13 Functions in the establishment of the spindle assembly checkpoint by replenishing O-MAD2. Cell Rep , 1439–1450. [DOI] [PubMed] [Google Scholar]
- Maddox AS, Habermann B, Desai A, Oegema K. (2005). Distinct roles for two C. elegans anillins in the gonad and early embryo. Development , 2837–2848. [DOI] [PubMed] [Google Scholar]
- Mariani L, Chiroli E, Nezi L, Muller H, Piatti S, Musacchio A, Ciliberto A. (2012). Role of the Mad2 dimerization interface in the spindle assembly checkpoint independent of kinetochores. Curr Biol , 1900–1908. [DOI] [PubMed] [Google Scholar]
- Marks DH, Thomas R, Chin Y, Shah R, Khoo C, Benezra R. (2017). Mad2 overexpression uncovers a critical role for TRIP13 in mitotic exit. Cell Rep , 1832–1845. [DOI] [PMC free article] [PubMed] [Google Scholar]
- Meraldi P, Draviam VM, Sorger PK. (2004). Timing and checkpoints in the regulation of mitotic progression. Dev Cell , 45–60. [DOI] [PubMed] [Google Scholar]
- Miniowitz-Shemtov S, Eytan E, Kaisari S, Sitry-Shevah D, Hershko A. (2015). Mode of interaction of TRIP13 AAA-ATPase with the Mad2-binding protein p31comet and with mitotic checkpoint complexes. Proc Natl Acad Sci USA , 11536–11540. [DOI] [PMC free article] [PubMed] [Google Scholar]
- Moyle MW, Kim T, Hattersley N, Espeut J, Cheerambathur DK, Oegema K, Desai A. (2014). A Bub1-Mad1 interaction targets the Mad1–Mad2 complex to unattached kinetochores to initiate the spindle checkpoint. J Cell Biol , 647–657. [DOI] [PMC free article] [PubMed] [Google Scholar]
- Nelson CR, Hwang T, Chen PH, Bhalla N. (2015). TRIP13PCH-2 promotes Mad2 localization to unattached kinetochores in the spindle checkpoint response. J Cell Biol , 503–516. [DOI] [PMC free article] [PubMed] [Google Scholar]
- Nezi L, Rancati G, De Antoni A, Pasqualato S, Piatti S, Musacchio A. (2006). Accumulation of Mad2-Cdc20 complex during spindle checkpoint activation requires binding of open and closed conformers of Mad2 in Saccharomyces cerevisiae. J Cell Biol , 39–51. [DOI] [PMC free article] [PubMed] [Google Scholar]
- Nystul TG, Goldmark JP, Padilla PA, Roth MB. (2003). Suspended animation in C. elegans requires the spindle checkpoint. Science , 1038–1041. [DOI] [PubMed] [Google Scholar]
- O’Connell KF, Caron C, Kopish KR, Hurd DD, Kemphues KJ, Li Y, White JG. (2001). The C. elegans zyg-1 gene encodes a regulator of centrosome duplication with distinct maternal and paternal roles in the embryo. Cell , 547–558. [DOI] [PubMed] [Google Scholar]
- O’Rourke SM, Carter C, Carter L, Christensen SN, Jones MP, Nash B, Price MH, Turnbull DW, Garner AR, Hamill DR, et al. (2011). A survey of new temperature-sensitive, embryonic-lethal mutations in C. elegans: 24 alleles of thirteen genes. PLoS One , e16644. [DOI] [PMC free article] [PubMed] [Google Scholar]
- Rodriguez-Bravo V, Maciejowski J, Corona J, Buch HK, Collin P, Kanemaki MT, Shah JV, Jallepalli PV. (2014). Nuclear pores protect genome integrity by assembling a premitotic and Mad1-dependent anaphase inhibitor. Cell , 1017–1031. [DOI] [PMC free article] [PubMed] [Google Scholar]
- Rose L, Gonczy P. (2014). Polarity establishment, asymmetric division and segregation of fate determinants in early C. elegans embryos. WormBook, 1–43. [DOI] [PubMed] [Google Scholar]
- Rosenberg SC, Corbett KD. (2015). The multifaceted roles of the HORMA domain in cellular signaling. J Cell Biol , 745–755. [DOI] [PMC free article] [PubMed] [Google Scholar]
- San-Segundo PA, Roeder GS. (1999). Pch2 links chromatin silencing to meiotic checkpoint control. Cell , 313–324. [DOI] [PubMed] [Google Scholar]
- Seydoux G, Mello CC, Pettitt J, Wood WB, Priess JR, Fire A. (1996). Repression of gene expression in the embryonic germ lineage of C. elegans. Nature , 713–716. [DOI] [PubMed] [Google Scholar]
- Simonetta M, Manzoni R, Mosca R, Mapelli M, Massimiliano L, Vink M, Novak B, Musacchio A, Ciliberto A. (2009). The influence of catalysis on mad2 activation dynamics. PLoS Biol , e10. [DOI] [PMC free article] [PubMed] [Google Scholar]
- Sironi L, Mapelli M, Knapp S, De Antoni A, Jeang KT, Musacchio A. (2002). Crystal structure of the tetrameric Mad1–Mad2 core complex: implications of a “safety belt” binding mechanism for the spindle checkpoint. EMBO J , 2496–2506. [DOI] [PMC free article] [PubMed] [Google Scholar]
- Sironi L, Melixetian M, Faretta M, Prosperini E, Helin K, Musacchio A. (2001). Mad2 binding to Mad1 and Cdc20, rather than oligomerization, is required for the spindle checkpoint. EMBO J , 6371–6382. [DOI] [PMC free article] [PubMed] [Google Scholar]
- Srinivasan DG, Fisk RM, Xu H, van den Heuvel S. (2003). A complex of LIN-5 and GPR proteins regulates G protein signaling and spindle function in C. elegans. Genes Dev , 1225–1239. [DOI] [PMC free article] [PubMed] [Google Scholar]
- Stein KK, Davis ES, Hays T, Golden A. (2007). Components of the spindle assembly checkpoint regulate the anaphase-promoting complex during meiosis in Caenorhabditis elegans. Genetics , 107–123. [DOI] [PMC free article] [PubMed] [Google Scholar]
- Sudakin V, Chan GK, Yen TJ. (2001). Checkpoint inhibition of the APC/C in HeLa cells is mediated by a complex of BUBR1, BUB3, CDC20, and MAD2. J Cell Biol , 925–936. [DOI] [PMC free article] [PubMed] [Google Scholar]
- Teichner A, Eytan E, Sitry-Shevah D, Miniowitz-Shemtov S, Dumin E, Gromis J, Hershko A. (2011). p31comet promotes disassembly of the mitotic checkpoint complex in an ATP-dependent process. Proc Natl Acad Sci USA , 3187–3192. [DOI] [PMC free article] [PubMed] [Google Scholar]
- Tintori SC, Osborne Nishimura E, Golden P, Lieb JD, Goldstein B. (2016). A transcriptional lineage of the early C. elegans embryo. Dev Cell , 430–444. [DOI] [PMC free article] [PubMed] [Google Scholar]
- Tipton AR, Wang K, Oladimeji P, Sufi S, Gu Z, Liu ST. (2012). Identification of novel mitosis regulators through data mining with human centromere/kinetochore proteins as group queries. BMC Cell Biol , 15. [DOI] [PMC free article] [PubMed] [Google Scholar]
- Vader G. (2015). Pch2(TRIP13): controlling cell division through regulation of HORMA domains. Chromosoma , 333–339. [DOI] [PubMed] [Google Scholar]
- van Hooff JJ, Tromer E, van Wijk LM, Snel B, Kops GJ. (2017). Evolutionary dynamics of the kinetochore network in eukaryotes as revealed by comparative genomics. EMBO Rep. [DOI] [PMC free article] [PubMed] [Google Scholar]
- Vazquez-Diez C, Paim LMG, FitzHarris G. (2019). Cell-size-independent spindle checkpoint failure underlies chromosome segregation error in mouse embryos. Curr Biol , 865–873.e863. [DOI] [PubMed] [Google Scholar]
- Vleugel M, Hoogendoorn E, Snel B, Kops GJ. (2012). Evolution and function of the mitotic checkpoint. Dev Cell , 239–250. [DOI] [PubMed] [Google Scholar]
- Wang K, Sturt-Gillespie B, Hittle JC, Macdonald D, Chan GK, Yen TJ, Liu ST. (2014). Thyroid hormone receptor interacting protein 13 (TRIP13) AAA-ATPase is a novel mitotic checkpoint-silencing protein. J Biol Chem , 23928–23937. [DOI] [PMC free article] [PubMed] [Google Scholar]
- Westhorpe FG, Tighe A, Lara-Gonzalez P, Taylor SS. (2011). p31comet-mediated extraction of Mad2 from the MCC promotes efficient mitotic exit. J Cell Sci , 3905–3916. [DOI] [PMC free article] [PubMed] [Google Scholar]
- Wu HY, Burgess SM. (2006). Two distinct surveillance mechanisms monitor meiotic chromosome metabolism in budding yeast. Curr Biol , 2473–2479. [DOI] [PMC free article] [PubMed] [Google Scholar]
- Xia G, Luo X, Habu T, Rizo J, Matsumoto T, Yu H. (2004). Conformation-specific binding of p31(comet) antagonizes the function of Mad2 in the spindle checkpoint. EMBO J , 3133–3143. [DOI] [PMC free article] [PubMed] [Google Scholar]
- Ye Q, Rosenberg SC, Moeller A, Speir JA, Su TY, Corbett KD. (2015). TRIP13 is a protein-remodeling AAA+ ATPase that catalyzes MAD2 conformation switching. eLife . [DOI] [PMC free article] [PubMed] [Google Scholar]
- Yost S, de Wolf B, Hanks S, Zachariou A, Marcozzi C, Clarke M, de Voer RM, Etemad B, Uijttewaal E, Ramsay E, et al. (2017). Biallelic TRIP13 mutations predispose to Wilms tumor and chromosome missegregation. Nat Genet. [DOI] [PMC free article] [PubMed] [Google Scholar]
Associated Data
This section collects any data citations, data availability statements, or supplementary materials included in this article.