

Abstract
Objectives:
This study identified three distinct patterns of self-management groups for a sample of 239 youth (9 – 11 years) with type 1 diabetes and their maternal and paternal caregivers, and assessed their relationship to glycemic control (HbA1c).
Methods:
Youth and their maternal and paternal caregivers were administered the diabetes self-management profile (DSMP) to assess self-management. Glycemic control was based on hemoglobin A1c.
Results:
Two-step cluster analysis identified three different self-management groups based on youth, maternal, and paternal reports. Analysis of variance indicated that the pattern of less optimal diabetes self-management was associated with worse glycemic control.
Conclusion:
Our results objectively describe differences in patterns of self-management in youth with type 1 diabetes, that relate to glycemic control. Interventions based on these specific patterns of self-management may improve diabetes management and enhance glycemic control in children and adolescents with type 1 diabetes.
Keywords: adherence, cluster analysis, pediatrics, self-management, type 1 diabetes
Management of type 1 diabetes requires the close integration of a multifaceted treatment regimen. Patients and families need to manage and coordinate insulin administration and adjustments, exercise, frequent monitoring of blood glucose, management of hypoglycemia and/or hyperglycemia, and meal planning including carbohydrate counting (1, 2). Lack of successful integration of these self-management behaviors has been associated with both acute and long-term adverse health outcomes (1, 2).
Previous work has demonstrated that success in managing one domain of the diabetes treatment regimen does not ensure that other domains of the treatment regimen are managed effectively (3–5). For example, children with problems in multiple domains of diabetes management will need the most help. Others may need more help in specific areas of the treatment regimen (e.g., insulin administration), but not in others. Finally, some children demonstrate competent management styles in multiple domains of diabetes management that need to be supported with recommendations for fine tuning. For this reason, to develop targeted interventions to improve self-management skills, objective data are needed to describe individual differences in the patterns of self-management skills in key patterns of diabetes self-management behavior and relationship of these patterns to glycemic control.
To our knowledge, Schneider et al. (5) conducted the only study that identified distinct self-management styles of adolescents with type 1 diabetes and their parents. The authors employed cluster analysis to analyze data from a modified version of the diabetes self-management profile (DSMP) (6). This research identified three distinct self-management styles described as inadequate, methodical, or adaptive (5). The inadequate self-management style group described those adolescents who demonstrated low rates of self-management in multiple domains of treatment (e.g., insulin administration, meal planning, blood glucose testing, and exercise). Two other groups were identified that had more optimal diabetes management but contrasting patterns of self-management behaviors. For example, the methodical self-management group reported a focus on precise and consistent routines for insulin administration and diet but few regimen adjustments. The adaptive self-management group demonstrated an active, vigilant pattern of management, including frequent insulin adjustments based on frequent blood glucose testing together with a high level of exercise frequency. Glycemic control was higher in the inadequate group than in the other two groups. The methodical and adaptive self-management groups had equivalent metabolic control (5). Schneider et al.’s (5) analysis suggested that alternative self-management patterns that are based on individual families’ treatment preferences and lifestyles were each consistent with adequate glycemic control for adolescents with type 1 diabetes (7).
However, the study by Schneider et al. has limitations. A relatively large percentage (39%) of Schneider et al.’s (5) sample was treated with conventional or fixed insulin regimens. For this reason, the clusters of self-management behaviors that were identified may not be generalizable to the flexible treatment regimens that are currently being prescribed for the majority of children and adolescents with type 1 diabetes. Second, Schneider et al. (5) pooled maternal (85% of reporters) and paternal (15%) respondents in their analysis. However, maternal and paternal reports of their child’s diabetes management may not be equivalent and need to be described and analyzed separately (8). Finally, Schneider et al. (5) used a modified version of the DSMP (6). The modified DSMP and the original version are largely the same measure with relatively similar scales. The basic content and structure is the same. The modified version of the DSMP attempted to minimize interviewer subjectivity caused by response coding during administration by providing more structured/dichotomous items (6). Furthermore, the modified version of the DSMP has item scores ranging from 0 to 1 and obtains an overall self-management score with a range from 0 to 1 with higher scores reflecting greater adherence.
To address these limitations, this study extended the work of Schneider et al. using the DSMP (9) to examine maternal, paternal, and youth reports in a large, multisite sample of children and adolescents, a majority of whom were using flexible insulin treatment regimens. This study also tested the relationship of the specific patterns of self-management skills that were identified by cluster analysis to HbA1c.
We hypothesized that distinct subgroups would be identified by multiple family members that were comparable to those found by Schneider et al. (5) and that these groups HbA1c would differ. In particular, we hypothesized that the group that demonstrated more problematic overall self-management would demonstrate poorer glycemic control compared with groups that demonstrated alternative patterns that reflected more adaptive diabetes self-management.
Methods
Participants and procedure
Participants were 239 children with type 1 diabetes and their caregivers who were followed at pediatric diabetes clinics at three university affiliated medical centers in the United States. Demographic and diabetes treatment characteristics for youth and their caregivers are reported in Table 1. The present sample’s ethnicity was largely representative of each clinic’s sample. Institutional Review Boards at each site approved the study. Data were collected as part of an ongoing, 3-year longitudinal study aimed at investigating hypothesized psychological processes including parental support and changes in allocation of treatment responsibility that may affect treatment adherence in type 1 diabetes during early adolescence. For the purpose of the present analysis, only baseline data were considered.
Table 1.
Demographic characteristics of participants
| n (%) | Mean (SD); Range | |
|---|---|---|
| Child age* | — | 10.54 (0.94); 9.0– 12.09 |
| Duration of diabetes (years) | — | 4.41 years (2.46); 1– 11 years |
| HbA1c | — | 8.20 (1.37); 5.7– 16.8% |
| Child gender | ||
| Male | 109 (45.61) | — |
| Female | 130 (54.39) | — |
| Child ethnicity | ||
| Non-Hispanic, Caucasian | 178 (74.5) | — |
| Non-Hispanic, African-American | 11 (4.6) | — |
| Non-Hispanic, multiple races | 13 (5.4) | |
| Non-Hispanic, Other | 9 (3.8) | — |
| Hispanic, Caucasian | 27 (11.3) | — |
| Hispanic, Other | 1 (0.4) | — |
| Insulin regimen | ||
| Conventional | 3 (1.3) | — |
| Multiple daily injection | 104 (43.5) | — |
| Pump | 126 (52.7) | — |
| Pod | 6 (2.5) | — |
| Insurance type | ||
| Private | 179 (74.9) | — |
| Public (Medicare/Medicaid) | 45 (18.8) | — |
| No insurance | 1 (0.4) | — |
| Unknown | 14 (5.9) | — |
| Maternal caregiver relationship | ||
| Biological mother | Biological mother | — |
| Adoptive mother | 2 (0.9) | — |
| Grandmother | 4 (1.7) | — |
| Paternal caregiver relationship | ||
| Biological father | 133 (93.7) | — |
| Adoptive father | 4 (2.8) | — |
| Step-parent | 4 (2.8) | — |
| Other | 1 (0.7) | — |
| Annual household income | — | $49 000– 72 999 |
Four children were recruited at age 11, but were not seen for baseline visits until after they turned 12 years of age due to study visit cancellations and reschedules.
Caregivers and children were recruited during a regularly scheduled outpatient clinic visit. Inclusion criteria included diagnosis of type 1 diabetes for at least 1 year, ages 9 – 11, absence of potential secondary causes of type 1 diabetes diagnosis (e.g., glucocorticoid treatment, cystic fibrosis), English speaking, and have no known plans to move out of the area within the next 3 years. Exclusion criteria included current involvement in foster care, presence of severe psychiatric disorders, or comorbid chronic conditions (e.g., renal disease) that required burdensome ongoing treatment regimens, or diagnosis of mental retardation. Eligible participants were identified and contacted by clinic personnel to ask about their interest in the study and then were approached by research staff who explained the study procedures. Of the 361 eligible participants who were approached, 240 (66.5%) consented and participated. Reasons for not participating included being too busy (n = 54), no transportation (n = 3), and other (n = 64). Signed informed consent was obtained from a parent or legal guardian, written assent from children 11 years old, and verbal assent from children less than 11 years according to the guidelines established by the local Institutional Review Boards. After enrollment, one child was diagnosed with monogenic diabetes of the young (MODY) (10) and no longer treated with insulin and hence was removed from the study and analysis.
Measures
Diabetes self-management profile.
DSMP is a 25-item structured interview, which was administered to assess diabetes-related management behaviors during the previous 3 months (9). Questions were asked in an open-ended manner and addressed the following domains: exercise, hypoglycemia management, diet, blood glucose monitoring, and insulin administration. The DSMP is comprised of both dichotomous items (yes, no) and three- to five-point Likert scale items that were coded based on how the child or caregiver responded to the open-ended questions. Children and parents were interviewed separately by trained research staff. All research assistants had at least a Bachelor’s degree. Several had Master’s degrees, and one had a PhD. A total self-management score was calculated by summing all items, and subscale scores were obtained by summing items for each appropriate scale. Higher scores reflected better self-management behaviors. The DSMP was completed by 97.9% of maternal caregivers and 59.4% of paternal caregivers. DSMP possible scores and descriptive characteristics for the entire sample are provided in Table 2. The DSMP total score has demonstrated good internal consistency (r = 0.76), moderate cross-informant validity for both parent and child report (r = 0.26), and strong interrater agreement (r = 0.94) (9). This measure also has demonstrated good predictive validity between parent and child reported self-management behaviors and glycemic control (9). In the present sample, internal consistency was 0.60 for the youth DSMP, 0.66 for the maternal caregiver DSMP, and 0.64 for the paternal caregiver DSMP.
Table 2.
Descriptive statistics for DSMP (entire sample and self-management clusters)
| Youth Cluster 1 | Youth Cluster 2 | Youth Cluster 3 | Youth entire sample | ||
|---|---|---|---|---|---|
| M (SD) | M (SD) | M (SD) | M (SD) | Possible range | |
| Exercise | 4.24 (1.56) | 4.04 (0.96) | 8.10 (2.08) | 5.51 (2.47) | 0– 12 |
| Hypoglycemia management | 7.68 (1.49) | 8.74 (1.38) | 8.92 (1.45) | 8.54 (1.51) | 0– 11 |
| Diet | 10.85 (2.60) | 13.85 (2.00) | 12.75 (2.94) | 12.72 (2.76) | 0– 17 |
| Blood Glucose Monitoring | 18.03 (3.51) | 22.94 (3.27) | 23.96 (3.56) | 22.09 (4.16) | 0– 32 |
| Insulin Administration | 9.15 (3.22) | 13.26 (1.72) | 12.05 (2.09) | 11.82 (2.80) | 0– 16 |
| Total Score | 49.95 (4.10) | 62.83 (4.27) | 65.77 (6.38) | 60.69 (8.07) | 0– 88 |
| Maternal | Maternal | Maternal | Maternal entire | ||
| Cluster 1 | Cluster 2 | Cluster 3 | sample | ||
| M (SD) | M (SD) | M (SD) | M (SD) | Possible range | |
| Exercise | 6.80(2.93) | 5.69 (2.08) | 7.35 (2.72) | 6.84 (2.75) | 0– 12 |
| Hypoglycemia management | 7.94 (1.75) | 8.79 (1.24) | 9.57 (1.16) | 8.82 (1.60) | 0– 11 |
| Diet | 10.45 (2.54) | 12.14 (2.63) | 14.88 (1.58) | 12.72 (2.97) | 0– 17 |
| Blood Glucose Monitoring | 22.75 (3.90) | 24.24 (3.77) | 26.57 (2.96) | 24.71 (3.88) | 0– 32 |
| Insulin Administration | 12.07 (2.51) | 6.43 (2.04) | 13.71 (1.51) | 11.79 (3.31) | 0– 16 |
| Total Score | 60.01 (6.93) | 57.29 (6.38) | 72.07 (4.75) | 64.88 (8.80) | 0– 88 |
| Paternal | Paternal | Paternal | Paternal entire | ||
| Cluster 1 | Cluster 2 | Cluster 3 | sample | ||
| M (SD) | M (SD) | M (SD) | M (SD) | Possible range | |
| Exercise | 6.32 (2.82) | 4.62 (1.76) | 8.00 (3.08) | 6.32 (2.97) | 0– 12 |
| Hypoglycemia management | 9.18 (1.23) | 8.58 (1.32) | 10.10 (1.13) | 9.30 (1.38) | 0– 11 |
| Diet | 8.55 (2.39) | 14.17 (1.65) | 14.96 (1.74) | 12.96 (3.29) | 0– 17 |
| Blood glucose monitoring | 24.03 (4.06) | 21.92 (3.89) | 26.80 (2.78) | 24.25 (4.14) | 0– 32 |
| Insulin administration | 10.45 (4.03) | 13.40 (1.82) | 13.32 (1.77) | 12.58 (2.87) | 0– 16 |
| Total score | 58.53 (7.14) | 62.70 (5.64) | 73.18 (4.56) | 65.40 (8.43) | 0– 88 |
Glycemic control.
Glycated hemoglobin (HbA1c) provided an estimate of glycemic control over the previous 2 – 3 months. Blood samples were obtained by a finger stick during the study visit and samples from each study site were shipped to one central laboratory for standardization purposes. Samples were analyzed using the TOSOH-G7 method (reference range 4.0 – 6.0%).
Data analytic strategy.
The purpose of cluster analysis is to define mutually exclusive groups of individuals who had similar scores across one or more dimensions or subscales (5, 11). Authors have recommended a rigorous two-step process to identify robust and ecologically (clinically relevant) cluster patterns (11–13); thus the SPSS two-step cluster analysis (13) was used. The two-step cluster analysis first identifies ‘pre-clusters’ and then treats these ‘pre-clusters’ as single cases in hierarchical cluster analysis (13). Cluster membership was determined by the cluster distances approach, in that between groups differences were maximized and within group differences minimized to generate similar groups or patterns of individuals (5, 11, 13). The Bayesian Information Criterion (BIC) was used to determine the appropriate number of clusters, which was based on the lowest BIC and the largest BIC change between the number of clusters (11, 13). On the basis of BIC criterion, a three cluster solution was ideal for child, maternal, and paternal reporters. Standardized z scores were used as the unit of analysis because cluster analysis requires commensurability (i.e., equal scale units) (11–13). Performing a z score transformation prior to the two-step analysis ensured that commensurability was obtained. Between subjects analysis of variance (anova) was used to identify differences between the three clusters, as well as, differences among the identified cluster groups for each reporter on glycemic control (Hb1Ac). Post hoc comparisons using Tukey’s HSD were then performed to test significant differences between individual groups.
Results
Description of the clusters
Table 1 describes the demographic and diabetes treatment characteristics for youth and their caregivers. The study population was predominately non-Hispanic white, employed multiple daily injections of insulin or insulin pump therapy, had private insurance, and their primary care provider was either their mother or father.
Table 2 provides the nonstandardized subscale and total scores for youth, maternal, and paternal groups that were identified by cluster analysis. Figure. 1A–C provides the cluster profiles for the three self-management cluster groups for youth, maternal, and paternal reporters using z scores. For purposes of this report, high self-management scores were defined as z scores ≥ 0.5, average scores between −0.49 and 0.49, and low self-management scores z scores ≤ −0.5. Cluster groups were based on each individual reporter (i.e., youth, maternal, and paternal reports of self-management). Thus, it was possible for the youth to be in one cluster and his/her mother and/or father to be in one of the other two clusters.
Fig. 1. (A).
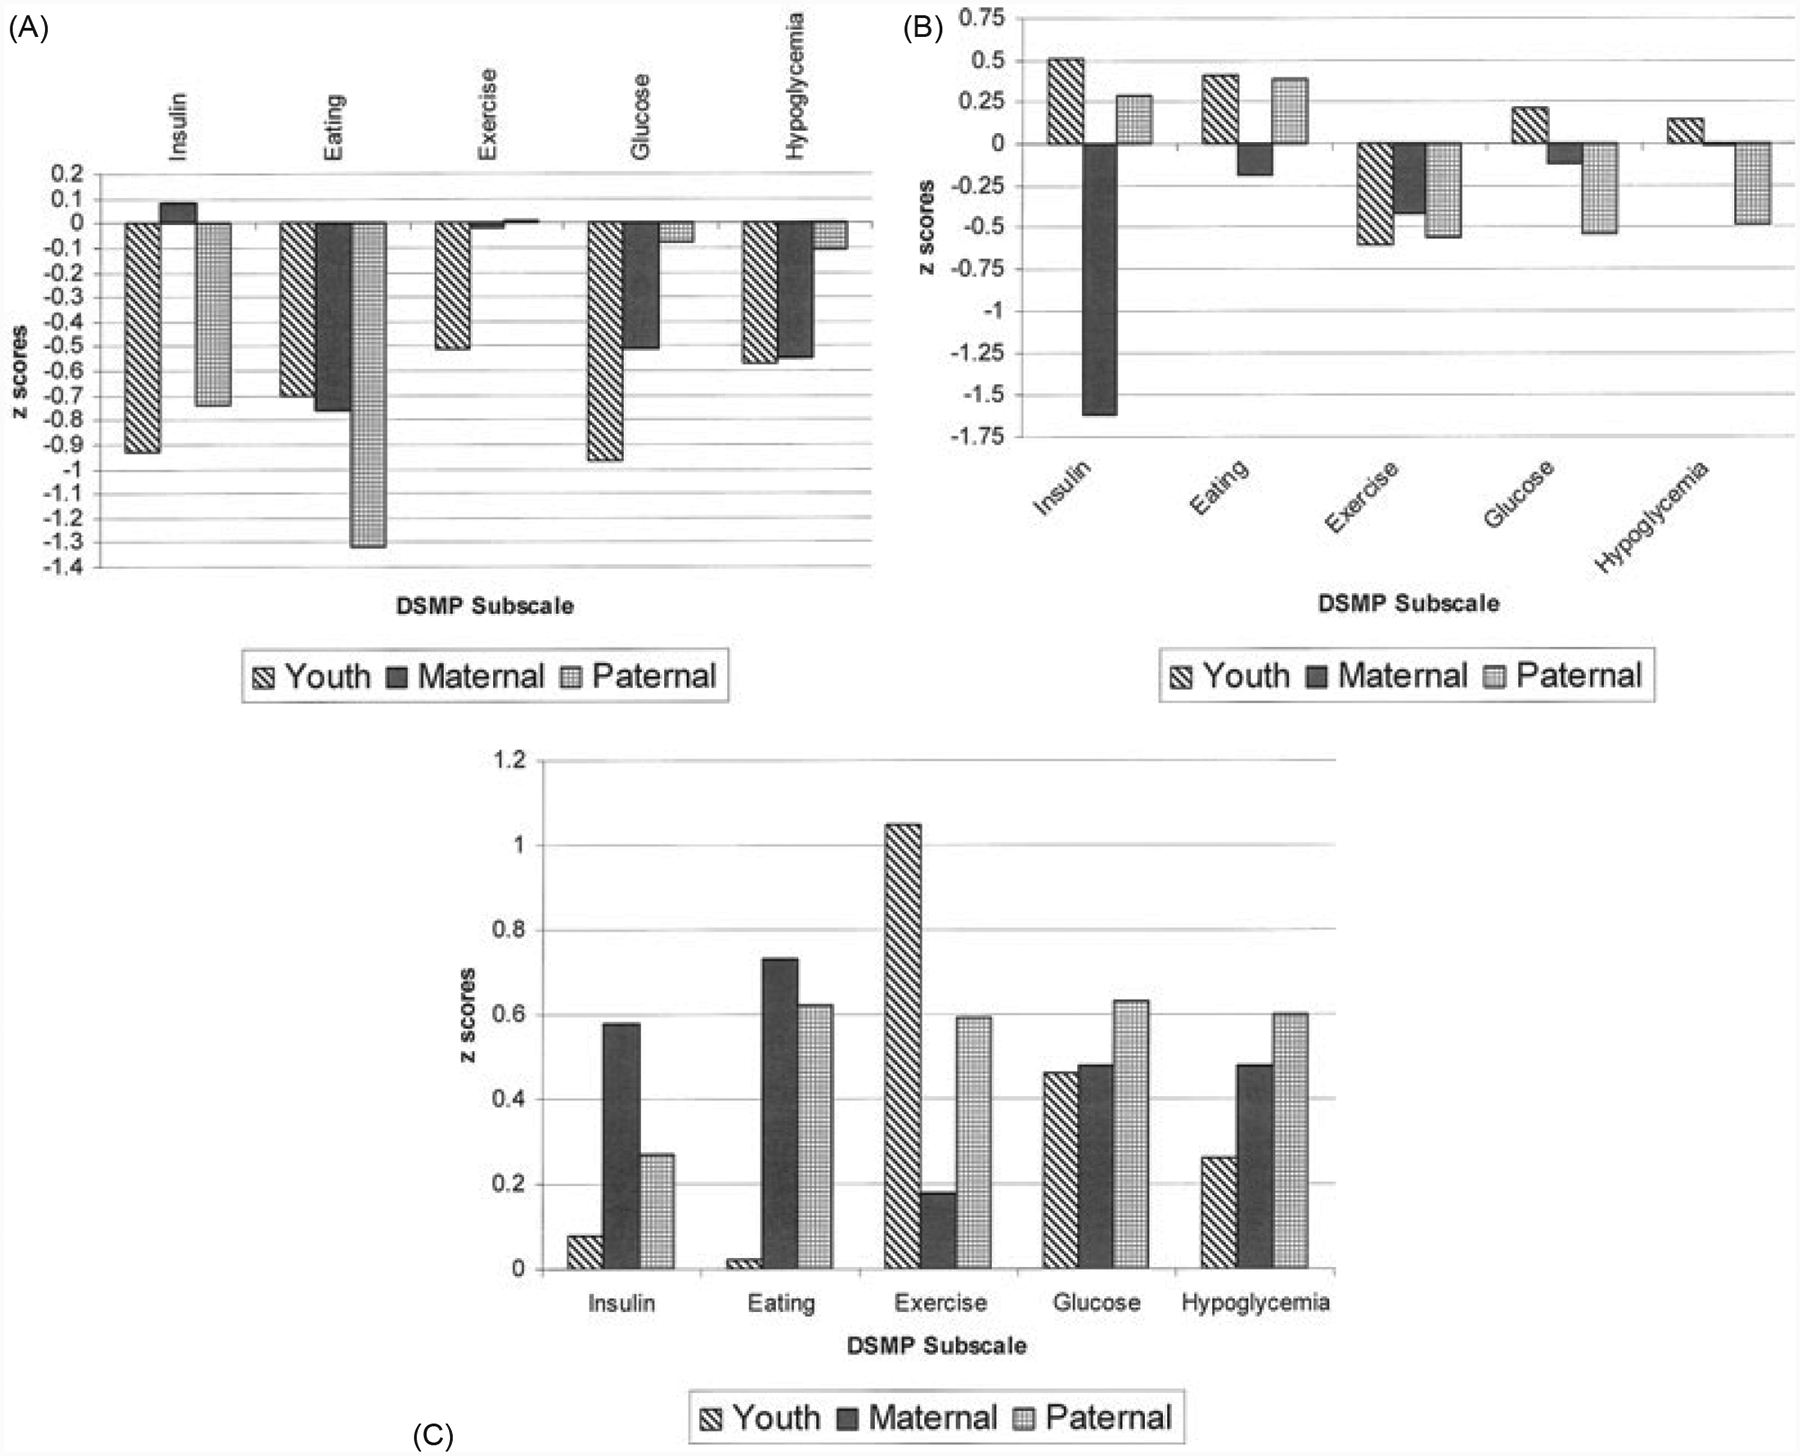
(A) Low adaptive group (Cluster 1): all reporters. (B) Moderate adaptive group (Cluster 2): all reporters. (C) High adaptive group (Cluster 3): all reporters.
We then collapsed reporters across the three clusters and examined differences in standardized total DSMP scores between clusters 1 (low adaptive group), 2 (moderate adaptive group), and 3 (high adaptive group). We found significant differences between the three cluster groups, F (2, 611) = 263.33, p ≤ 0.00. The low adaptive group (cluster 1), on average, had significantly lower standardized total DSMP scores (M = −0.84, SD = 0.79) compared to the moderate adaptive (cluster 2) (M = −0.13, SD = 0.76) and high adaptive groups (cluster 3) (M = 0.78, SD = 0.64), which indicated the low adaptive group (cluster 1) had poorer self-management compared to the other two groups. The moderate adaptive group (cluster 2) also had a significantly lower standardized total DSMP scores compared to the high adaptive group (cluster 3). Significant differences were also found in standardized total DSMP scores between the three clusters derived from youth report, F (2, 236) = 182.41, p ≤ 0.00, maternal report, F (2, 231) = 139.65, p ≤ 0.00, and paternal report, F (2, 138) = 78.86, p ≤ 0.00.
As shown in Figure. 1A, the low adaptive group (cluster 1, n = 185) had deficits in all five subscales. Children reported (n = 59) low scores on all five subscales, which reflected a generalized pattern of poor self-management. Maternal reporters in cluster (n = 88) also had low scores on all subscales, except exercise and insulin administration. Paternal reporters in cluster 1 (n = 38) had average scores on exercise, hypoglycemia management, and blood glucose monitoring subscales, and low scores on the other subscales.
The other two groups (moderate and high adaptive, clusters 2 and 3) each had better overall patterns of self-management than the low adaptive group (cluster 1). However, as a whole, the moderate adaptive group (cluster 2) demonstrated patterns of self-management that were less optimal than the high adaptive group (cluster 3).
As shown in Figure. 1B, the moderate adaptive group (cluster 2, n = 191) demonstrated some strengths in self-management, but there were still areas that could be improved. Child reporters in cluster 2 (n = 96) had high scores on insulin administration, average scores on diet, hypoglycemia management, and blood glucose monitoring, and low scores on exercise. Maternal reporters in cluster 2 (n = 42) had low scores on insulin administration, but average scores on all other subscales. Finally, paternal reporters in cluster (n = 53) had average scores on eating and insulin administration, and low scores on the other subscales.
As shown in Figure. 1C, the high adaptive group (cluster 3, n = 238) demonstrated strengths in diabetes self-management. Child reporters in cluster 3 (n = 84) had high scores on exercise and blood glucose management, and at least average scores on all other subscales. Maternal reporters in cluster 3 (n = 104) had high scores on all subscales, except exercise, which was average. Paternal reporters in cluster 3 (n = 50) had high scores on all subscales with the exception of insulin administration, which was average.
Operationally defined, children identified as having deficits in most/all areas of diabetes management would be considered ‘low adaptive’; those having deficits in some, but not all areas of diabetes management as ‘moderate adaptive’; and those having few or no deficits in diabetes management as ‘high adaptive’.
Cluster differences in HbA1c
Descriptive statistics for cluster differences in HbA1c are reported in Table 3. There were significant differences in HbA1c values, F (2, 234) = 4.12, p ≤ 0.02 for youth self-management cluster groups such that the moderate (cluster 2) and high adaptive groups (cluster had better glycemic control compared with the low adaptive group (cluster 1). There were no other significant differences. There were also significant differences in A1c values, F (2, 229) = 8.67, p ≤ 0.00 for the maternal self-management groups, such that the high adaptive group (cluster 3) had significantly better glycemic control compared to the low adaptive (cluster 1) and moderate adaptive (cluster 2) groups. There were no other significant differences. Finally, for the paternal self-management cluster groups, there also were significant differences in A1c values, F (2, 136) = 4.54, p ≤ 0.02, which was consistent with our hypotheses. The high adaptive group (cluster 3) had better glycemic control compared to the low adaptive group (cluster 1) for paternal reporters. There were no other significant differences.
Table 3.
Descriptive statistics for cluster differences in HbA1c by reporter
| M (SD), n* | M (SD), n* | M (SD), n* | |
|---|---|---|---|
| Reporter | Cluster 1 | Cluster 2 | Cluster 3 |
| Youth | 8.64 (1.76), 58 | 8.09 (1.24), 96 | 8.03 (1.12), 83 |
| Maternal | 8.49 (1.69), 86 | 8.61 (1.23), 42 | 7.80 (0.99), 104 |
| Paternal | 8.36 (1.34), 38 | 7.90 (1.08), 53 | 7.63 (0.96), 48 |
n might have differed between outcomes based on available data for each participant.
Discussion
Our study extended previous research on identification of patterns of self management in type 1 diabetes (5) by documenting three subgroups each reflecting different patterns of self-management based on child, maternal, and paternal reports in a sample of children who were using flexible insulin treatment regimens. These subgroups reflected a continuum of adaptiveness of diabetes management from low (cluster 1), moderate (cluster 2) to high (cluster 3). These contrasting patterns of self-management related to glycemic control. Patients in the low adaptive group (cluster 1), which had the least adaptive pattern of diabetes management also had the poorest glycemic control using American Diabetes Association criteria (7), and may be the most vulnerable to adverse health outcomes. Moreover, for most comparisons, the low adaptive group demonstrated significantly higher HbA1c (M = 8.51) than the moderate adaptive group (cluster 2) (M = 8.15) and high adaptive group (cluster 3) (M = 7.85) averaged across reporters. Finally, for the most part, the moderate adaptive and high adaptive groups had comparable levels of HbA1c, which was consistent with Schneider et al.’s (5) observations that there can be multiple pathways to reasonably adequate glycemic control.
The patterns of self-management that were identified in this study demonstrated both similarities and differences from that identified by Schneider et al. (5). For example, the low adaptive group demonstrated below average diabetes management in each of the five domains that were assessed by the DSMP. Average z scores for many of the self-management domains of the DSMP were less than 0.5, which were consistent with the inadequate management cluster that was identified by Schneider et al. (5).
The patients identified in the moderate adaptive and high adaptive groups had more adaptive patterns of self management than those in the low adaptive group. However, the patterns of management differed between the moderate adaptive and high adaptive groups. The moderate adaptive group demonstrated a profile that reflected a combination of average or adequate management that was consistently in the average range (±0.5 z score) with the one exception of insulin management as reported by mothers. The high adaptive group demonstrated average or above average diabetes management in all domains, this group was generally consistent with the adaptive management group identified by Schneider et al. (5), except that the high adaptive management group identified in our study had higher scores on exercise and insulin administration. In contrast to Schneider et al. (5), we did not identify a methodical group that focused on consistent routines for insulin administration and diet. On the other hand, the subtle differences between the clusters identified by Schneider and colleagues (5) and those found in the present study may have resulted from the type of DSMP administered. The combined effect of the modified version, which resulted in slightly different items, structured interviewer prompts, and a modified scoring system may have contributed to differences between the two scales and the clusters obtained.
There are two major differences in the characteristics of our sample versus that of Schneider et al. (5). First, in the present study almost every patient was prescribed a flexible insulin regimen involving variable dose and timing (43.5% multiple daily injection, 52.7% pump, 2.5% pod), while nearly two fifths of Schneider et al.’s (5) sample were prescribed a fixed or highly consistent insulin dose. One would expect that the high prevalence of flexible treatment regimens would limit the potential for routine patterns of insulin administration, diet, etc. to be identified as a pattern of self-management for a significant subgroup of patients. Second, the two studies include differences in the ages of children enrolled (our group was younger and more homogenous in age, in keeping with the focus of the study on early adolescence), which may have contributed to the differences in subgroups of self-management between the two studies. Younger children rely on their parents more for self-management tasks, whereas adolescents are more likely to manage their own treatment and self-management decisions (14)
The present study has limitations. First, the specific subgroups of self-management identified by cluster analysis would be expected to be influenced by the diabetes treatment regimens, demographic, and illness-related characteristics of specific samples. Furthermore, our sample was a homogenous subgroup of mostly two-parent, Caucasian families with moderate income. Consequently, generalizability of our findings to other samples should be established. Second, our findings were based on a cross-sectional analysis. Consequently, the present findings cannot tell us whether: 1) the patterns of self-management that were identified in this study reflect transient or more stable management patterns; and 2) whether the identified patterns of self-management predict long-term patterns of glycemic control. Consequently, examining the predictive validity of these patterns of self-management for glycemic control in prospective research is important.
In conclusion, cluster analysis provides a statistically valid method of describing individual differences in different domains of diabetes management based on a valid structured interview procedure that can be used to guide clinical care. Specifically, practitioners may use some of the information that is contained in the DSMP (e.g., insulin management, etc) to guide their management of children and adolescents with diabetes. Furthermore, the data used to derive clusters are based on a structured, valid procedure with reliable scoring. Individualized interventions could be tailored to DSMP-based profiles identified by cluster analysis in order to optimize adherence and self-management behaviors (5). For example, children whose self-management patterns fit within the low adaptive group (cluster 1) are at greater risk for poor health outcomes and could be targeted for more intensive diabetes management in multiple domains. In contrast, patients in the moderate adaptive group (cluster 2) might be expected to benefit from intervention to improve their management in a few targeted domains (e.g. exercise and blood glucose management). Finally, patients in the high adaptive group (cluster 3) could be largely supported in follow-up care with only minor adjustments. Furthermore, the value of obtaining separate profiles of self-management for youth, maternal, and paternal reporters affords interventions to be tailored to the entire family, particularly if there are different points of view regarding self-management (e.g., youth fits patterns of the low adaptive group, whereas maternal caregiver fits patterns of the high adaptive group). Evaluating the efficacy to diabetes management that is tailored on subgroups identified by cluster analysis would be an important next step in research.
Acknowledgements
The work reported in this article was funded by the National Institute of Diabetes and Digestive Disease (1R01 DK069486). The HbA1c data was analyzed by the Diabetes Diagnostic Laboratory (DDL) at the University of Missouri Columbia Health Sciences Center. The efforts of study participants who gave their time and energy to this work are gratefully acknowledged. Finally, data collection and management of this study were facilitated by a talented group of research assistants, including Claire Peterson, Michelle Eakin, Danielle Rosnov, Daniela Fernandez, and Jennifer Hernandez.
References
- 1.Diabetes Control and Complications Trial. Effect of intensive diabetes treatment on the development and progression of long-term complications in adolescents with insulin dependent diabetes mellitus: diabetes control and complications trial. J Pediatr 1994: 125: 177–188. [DOI] [PubMed] [Google Scholar]
- 2.Nansel TR, Anderson BJ, Laffel LMB et al. A multisite trial of a clinic-integrated intervention for promoting family management of pediatric type 1 diabetes: feasibility and design. Pediatrics Diabetes 2009: 10: 105–115. [DOI] [PMC free article] [PubMed] [Google Scholar]
- 3.Delamater AM. Improving patient adherence. Clin Diabetes 2006: 24: 71–77. [Google Scholar]
- 4.Johnson SB. Methodological issues in diabetes research: measuring adherence. Diabetes Care 1992: 15: 1658–1667. [DOI] [PubMed] [Google Scholar]
- 5.Schneider S, Iannotti RJ, Nansel TR et al. Identification of distinct self-management styles of adolescents with type 1 diabetes. Diabetes Care 2007: 30: 1107–1112. [DOI] [PubMed] [Google Scholar]
- 6.Iannotti RJ, Nansel TR, Schneider S et al. Assessing regimen adherence of adolescents with type 1 diabetes. Diabetes Care 2006: 29: 2263–2267. [DOI] [PubMed] [Google Scholar]
- 7.American Diabetes Association. Standards of medical care in diabetes. Diabetes Care 2010: 33: S11–S61. [DOI] [PMC free article] [PubMed] [Google Scholar]
- 8.Wysocki T, Gavin L. Paternal involvement in the management of chronic diseases: associations with adherence, quality of life, and health status. J Pediatr Psychol 2006: 31: 501–511. [DOI] [PubMed] [Google Scholar]
- 9.Harris MA, Wysocki T, Sadler M et al. Validation of a structured interview for the assessment of diabetes self-management. Diabetes Care 2000: 23: 1301–1304. [DOI] [PubMed] [Google Scholar]
- 10.Hattersley A, Bruining J, Shield J, Njolstad P, Donaghue K. International society for pediatric and adolescent diabetes. ISPAD clinical practice consensus guidelines 2006 – 2007: the diagnosis and management of monogenic diabetes in children. Pediatris Diabetes 2006: 7: 352–360. [DOI] [PubMed] [Google Scholar]
- 11.Aldenderfer MS, Blashfield RK. Cluster Analysis. Beverly Hills: Sage Publications, Inc, 1984. [Google Scholar]
- 12.Steele RG, Aylward BS. The use of cluster analytic techniques in developmental and behavioral pediatric research. J Dev Behav Pediatr 2007: 28: 327–329. [DOI] [PubMed] [Google Scholar]
- 13.Garson GD. Cluster Analysis Statnotes: Topics in Multivariate Analysis, 2010. Retrieved January 29, 2010 from http://faculty.chass.ncsu.edu/garson/pa765/statnote.htm.
- 14.Drotar D, Ievers C. Preliminary report: age differences in parent-child responsibilties for management of cystic fibrosis and insulin-dependent diabetes mellitus. J Dev Behav Pediatr 1994: 15: 367–374. [PubMed] [Google Scholar]