

Abstract
The COVID-19 virus has infected more than 38 million people and resulted in more than one million deaths worldwide as of October 14, 2020. By using the logistic regression model, we identified novel critical factors associated with COVID19 cases, death, and case fatality rates in 154 countries and in the 50 U.S. states. Among numerous factors associated with COVID-19 risk, economic inequality enhanced the risk of COVID-19 transmission. The per capita hospital beds correlated negatively with COVID-19 deaths. Blood types B and AB were protective factors for COVID-19 risk, while blood type A was a risk factor. The prevalence of HIV and influenza and pneumonia was associated with reduced COVID-19 risk. Increased intake of vegetables, edible oil, protein, vitamin D, and vitamin K was associated with reduced COVID-19 risk, while increased intake of alcohol was associated with increased COVID-19 risk. Other factors included age, sex, temperature, humidity, social distancing, smoking, health investment, urbanization level, and race. High temperature is a more compelling factor mitigating COVID-19 transmission than low temperature. Our comprehensive identification of the factors affecting COVID-19 transmission and fatality may provide new insights into the COVID-19 pandemic and advise effective strategies for preventing and migrating COVID-19 spread.
Keywords: COVID-19 transmission, COVID-19 fatality, Risk factor, Protective factor, Machine learning
Graphical abstract
1. Introduction
Since its first report in December 2019, COVID-19 caused by the 2019 novel coronavirus (SARS-CoV-2) has spread across 215 countries and territories (COVID-19 Dashboard: Johns Hopkins University, 2020). As of October 14, 2020, more than 38 million COVID-19 cases and one million deaths were reported (COVID-19 Dashboard: Johns Hopkins University, 2020). Compared to other coronaviruses, such as SARS-CoV and MERS-CoV, SARS-CoV-2 has a significantly higher infectivity potential that makes it spread across the world rapidly and has caused a global pandemic (Chen, 2020). Meanwhile, the fatality rate for COVID-19 is not low, making SARS-CoV-2 more destructive than the previously emerging coronaviruses (Mahase, 2020). The COVID-19 pandemic has established the most critical global health and economic crisis in recent years (McKee and Stuckler, 2020). But even worse, its development is difficult to forecast (Roda et al., 2020). Previous studies have identified individual factors associated with the spread of COVID-19. For example, temperature and humidity may impact the transmission of COVID-19 (Prata et al., 2020; Qi et al., 2020). Social distancing can significantly reduce COVID-19 transmission (Koo et al., 2020; Lewnard and Lo, 2020). Besides, some factors associated with the COVID-19 death risk have been identified, such as age, sex, and comorbidities (Zhou et al., 2020; Onder et al., 2020). Some factors, such as diet and nutrition (Lau et al., 2020; Grant et al., 2020), have been associated with both COVID-19 infection and mortality. Nevertheless, one standard limitation of these studies is that they ignored the interdependence between different factors. As a result, they might not accurately describe the relationships between some factors and COVID-19.
To simultaneously identify different factors affecting COVID-19 transmission and fatality, we used logistic models to predict population-adjusted confirmed cases (per one million) and deaths (per one million) and case fatality rates (CFRs) of COVID-19 in different countries and in the 50 U.S. states. We collected data related to politics, economy, culture, demographics, geography, education, medical resources, scientific development, environment, diseases, diet, and nutrition. Based on these data, we defined tens of factors (variables) that could affect COVID-19 transmission and fatality. We used least absolute shrinkage and selection operator (LASSO) (Tibshirani, 1996) to select the factors associated with COVID-19 risk. We identified novel factors associated with COVID-19 risk. We also confirmed some controversial factors and most of the well-recognized factors associated with COVID-19 risk.
2. Methods
2.1. Materials
We defined 77 variables that could affect COVID-19 transmission and fatality in different countries. These variables included population density, life expectancy, sex ratio (number of males per 100 females), percentage of population aged < 10 years, percentage of population aged ≥ 70 years, percentage of urban population, percentages of population with body mass index (BMI) > 30 and BMI < 18, PM2.5 value (particles less than 2.5 μm in diameter), percentage of population using unimproved water sources, prevalence of tuberculosis, prevalence of diabetes, prevalence of HIV, smoking rate among people aged > 15 years, two immunization (DPT and measles) coverages among children ages 12–23 months, average age of childbirth, three types of geographic location (inland, island, and other), three temperature types (high (>12 °C), medium ([5, 12] °C), low (<5 °C)), humidity, latitude, longitude, five climate types (tropical, arid, temperate, cold, and other), four religions (Islam, Christianism, Buddhism, and other), governing system (unitary state or federation), Gini index, per capita income, universal health coverage index, government expenditure on health (% of GDP), hospital beds per 1000 people, government expenditure on education (% of GDP), number of live audiences in major sports events, number of participants in large-scale religious activities, number of participants in large-scale cultural events, birthrate, natimortality, prevalence of malnutrition, number of scientific papers published, human development index, international tourism expenditure, international tourism revenue, domestic tourism expenditure, air passenger traffic, railway length, vehicle usage, percentage of population using the internet, 16 classes of food and nutrient intake (vegetables, fruits, grain, dairy products, edible oil, fat, sugar, alcohol, trace elements, protein, vitamin A, B, C, D, E, and K), and four races (White, Black, Asian, and Arab). We downloaded the latest version of these data from major repositories of authoritative statistics (Supplementary Table S1) and searched for the Coronavirus Resource Bank database (http://cov.cpu.edu.cn/). The major sports events, religious activities, and cultural events were the records from January to March 2020. A description of these variables is shown in Supplementary Table S1. Besides, we defined 55 variables that could affect COVID-19 transmission and fatality in different states of the United States. A description of these variables is shown in Supplementary Table S2. We collected confirmed COVID-19 cases, deaths, and case fatality rates (CFRs) in different countries and in the 50 U.S. states as of September 24, 2020, from the COVID-19 Dashboard of Johns Hopkins University (COVID-19 Dashboard: Johns Hopkins University, 2020). As suggested in a recent publication (Baud et al., 2020), we calculated the CFRs on a given day by dividing the number of COVID-19 deaths that day by the number of cases 14 days before.
2.2. Machine learning model
We defined the countries as having low or high COVID-19 cases, deaths, or CFRs using the 40th and 60th percentiles. We separated the data set into a training set and a test set, which contained three quarters and the remaining one quarter of the samples, respectively. We used the LASSO (Tibshirani, 1996; Breiman, 1995; Tibshirani, 1997) on the training set with 5-fold cross validation (CV) and selected the variables with a nonzero β-coefficient in the LASSO. Using the selected variables, we built a ridge logistic model on the training set and applied it to the test set. We estimated the sensitivity and specificity of the predictive model using the area under the receiver operating characteristic curve (AUC).
2.3. Ranking variables by importance
For continuous variables, we discretized them using the top-down discretization method (A top-down and greedy method for discretization of continuous attributes, 2007). We ranked the importance of all variables based on the chi-squared statistics. We performed data discretization using the R function “disc.Topdown” (Gonzalez-Abril et al., 2009; Kurgan and Cios, 2004; Tsai et al., 2008) in the R package “discretization” and feature ranking using the R function “chi.squared” in the R package “mlr.” (Bischl et al., 2016)
2.4. Statistical analysis
We performed comparisons of two groups using the one-sided Mann–Whitney U test. We evaluated the correlations of COVID-19 cases, deaths, and CFRs with other variables using the Spearman's correlation test. The correlation test P-value and correlation coefficient (ρ) were reported.
3. Results
3.1. Identifying factors affecting COVID-19 transmission and fatality in different countries
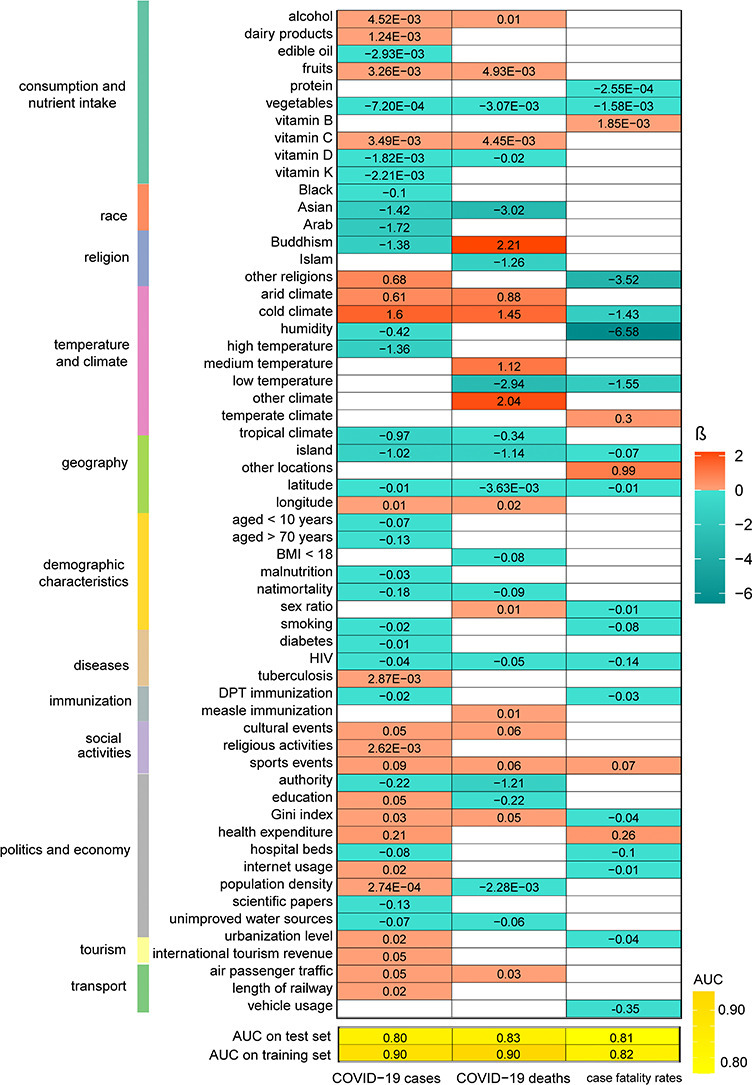
We first used the LASSO to evaluate the contribution of the 77 variables to COVID-19 cases, deaths, or CFRs. The LASSO selected 57 variables with a nonzero β-coefficient in at least one of the three predictive models for COVID-19 cases, deaths, and CFRs (Fig. 1 ). As expected, the three social distancing-associated factors (large-scale sports, religious, and cultural events) represented positive predictors of COVID-19 deaths and/or CFRs. The LASSO selected two temperature types (medium and low) in at least one predictive model. The medium temperature was a positive predictor of COVID-19 deaths, while the low temperature was a negative predictor of COVID-19 deaths and CFRs. These data, together with the findings from previous studies (Prata et al., 2020; Qi et al., 2020), suggest that the risk of COVID-19 transmission is high in a preferential temperature range, but it will decline with the temperature rising or falling outside the range. The humidity was a negative predictor of COVID-19 cases and CFRs, consistent with the finding from a previous study (Qi et al., 2020). The negative association between humidity and COVID-19 risk was following two other findings: i) the island country was a negative predictor of COVID-19 cases, deaths, and CFRs (the weather is humid in island countries), and ii) the arid climate was a positive predictor of COVID-19 cases and deaths. Besides, we found that the temperate climate was a positive predictor of COVID-19 CFRs, while the cold climate was a negative predictor of COVID-19 CFRs. Again, these results suggest that temperature has a prominent association with COVID-19 risk. Surprisingly, the cold climate was a positive predictor of COVID-19 cases and deaths, in contrast with its negative association with CFRs. The latitude was a negative predictor of COVID-19 cases, deaths, and CFRs, mainly because it is one of the main factors affecting temperature, which has an essential association with COVID-19 risk. In contrast, the longitude was a positive predictor of COVID-19 cases and deaths. The sex ratio (male/female) was a positive predictor of COVID-19 deaths, while the percentage of the population aged < 10 years was a negative predictor of COVID-19 cases. It is in agreement with previous findings that sex and age were significantly associated with COVID-19 risk (Zhou et al., 2020; Onder et al., 2020). Among the four races, the Black, Asian, and Arab were negative predictors of COVID-19 cases. Interestingly, we found that particular food or nutrition intake was associated with COVID-19 risk. For example, increased intake of vegetables, edible oil, protein, vitamin D, and vitamin K was associated with reduced COVID-19 cases, deaths, and/or CFRs. In contrast, increased intake of fruits, dairy products, alcohol, vitamin B, and vitamin C was associated with increased COVID-19 cases, deaths, and/or CFRs. The negative association between vitamin D intake and COVID-19 risk is consistent with previous reports (Lau et al., 2020; Grant et al., 2020). The condition of unimproved water sources was a negative predictor of COVID-19 cases and deaths, suggesting that water is not a primary transmission route of COVID-19. The air passenger traffic and railway length were positive predictors of COVID-19 cases and/or deaths, and the vehicle usage was a negative predictor of COVID-19 CFRs. It is reasonable since small closed spaces on airplanes and trains are prone to virus transmission. Again, these results indicate the importance of social distancing in containing the transmission of COVID-19. The percentage of urban population was a positive and negative predictor of COVID-19 cases and CFRs, respectively. A possible explanation is that dense urban population is conducive to COVID-19 transmission, while excellent urban medical conditions are conducive to the treatment of COVID-19 patients. The Gini index was a positive predictor of COVID-19 cases and deaths suggesting that economic inequality may increase the risk of COVID-19 transmission. The hospital beds per 1000 people was a negative predictor of COVID-19 deaths, suggesting that intensive medical treatment is crucial for reducing the risk of COVID-19 deaths.
Fig. 1.

57 variables selected by the LASSO in predicting COVID-19 cases, deaths, and/or case fatality rates in 154 countries. The β-coefficients and AUCs in the ridge logistic models are shown. AUC: the area under the receiver operating characteristic curve; aged <10 years: percentage of population aged <10 years; Arab: percentage of the Arab population; Asian: percentage of the Asian population; authority: governing system (unitary state or federation); average age of childbirth: average age of childbirth; BMI < 18: percentage of population with body mass index (BMI) < 18; BMI > 30: percentage of population with body mass index (BMI) > 30; Buddhism: Buddhism as the primary religion; Christianism: Christianism as the primary religion; cold climate: cold (continental) climate; cultural events: number of participants in large-scale cultural events; dairy products: dairy product intake (kcal/capita/day); diabetes: prevalence of diabetes; domestic tourism: domestic tourism expenditure (billion dollars); DPT: DPT (Diphtheria, pertussis, tetanus) immunization coverages among children <2 years; fat: fat intake (kcal/capita/day); fruits: fruit intake (kcal/capita/day); grain: grain intake (kcal/capita/day); health expenditure: government expenditure on health per capita; HIV: prevalence of HIV; hospital beds: hospital beds per 1000 people; humidity: relative humidity; internet usage: percentage of population using the internet; Islam: Islam as the primary religion; island: geographic location-island country; malnutrition: percentage of population of malnutrition; measle: measle immunization coverages among children <2 years; other locations: geographic location - other country; other religions: other as the primary religion or without religion; protein: protein intake (kcal/capita/day); religious activities: number of participants in large-scale religious activities; sex ratio: sex ratio (number of males per 100 females); smoking: smoking rate among people aged >15 years; sports events: number of participants in major sports events; sugar: sugar intake (kcal/capita/day); tuberculosis: prevalence of tuberculosis; unimproved water sources: percentage of population using unimproved water sources; urbanization level: percentage of urban population; vegetables: vegetable intake (kcal/capita/day); vehicle usage: number of vehicles; vitamin B: vitamin B (B6 + B9 + B12) intake (kcal/capita/day); vitamin C: vitamin C intake (kcal/capita/day); vitamin D: vitamin D intake (kcal/capita/day); vitamin K: vitamin K intake (kcal/capita/day); White: percentage of the White population.
We also obtained some unexpected findings. For example, the smoking rate was a negative predictor of COVID-19 cases and CFRs, consistent with the recent finding that smoking was a protective factor for COVID-19 infection (Gaibazzi et al., 2020). Nevertheless, an association between smoking and COVID-19 deaths was not observed in our model, suggesting that smoking is unlikely to reduce the overall COVID-19 deaths. The prevalence of some diseases, such as HIV, were inversely associated with COVID-19 risk. Surprisingly, the prevalence of malnutrition and the percentages of the population with BMI < 18 were inversely associated with COVID-19 cases or deaths. A possible explanation could be that obesity increases the risk of COVID-19 (Scheen, 2020).
3.2. Identifying factors affecting COVID-19 transmission and fatality in the 50 U.S. states
To uncover the critical factors for COVID-19 risk within a single country, we used logistic models to predict COVID-19 cases, deaths, and CFRs in the 50 U.S. states. We used 55 variables in the predictive models, most of which were in the list of variables mentioned earlier. Likewise, we first used the LASSO to determine the contribution of the 55 variables to COVID-19 cases, deaths, or CFRs. We defined the states as having low or high COVID-19 cases, deaths, or CFRs based on their median values. The next steps followed the previous method. The LASSO selected 27 variables with a nonzero β-coefficient in at least one of the three predictive models for COVID-19 cases, deaths, and CFRs (Fig. 2 ). Consistent with the previous results, temperate climate, social distancing (major sports events), per capita income, the prevalence of tuberculosis, and longitude were positive predictors of COVID-19 cases, deaths, and/or CFRs, and humidity was a negative predictor. The urbanization level was a negative predictor of COVID-19 deaths. We have also obtained some findings that were special in the U.S. setting. For example, the death rate of influenza and pneumonia was a negative predictor of COVID-19 CFRs. A potential explanation of the negative association between the prevalence of influenza and pneumonia and COVID-19 risk is that there is cross-reactive immunity between other types of viruses and SARS-CoV-2 (Grifoni et al., 2020). The Black was a positive predictor of COVID-19 cases, deaths, and CRFs, consistent with previous reports (Millett et al., 2020). The White and American Indians and Alaska Natives were negative predictors of COVID-19 cases, deaths, and/or CRFs. The geographic location had an association with COVID-19 risk, where landlocked countries and and great lakes regions had lower and higher risk, respectively. Besides, the usage of private transport in urban might reduce COVID-19 risk.
Fig. 2.

31 variables selected by the LASSO in predicting COVID-19 cases, deaths, and/or case fatality rates in the U.S. 50 states. The β-coefficients and AUCs in the ridge logistic models are shown. Adolescent: percentage of adolescents 11–17 years with 2+ adolescent immunizations; American Indians and Alaska Natives: percentage of the American Indians and Alaska Natives population; average age of childbirth: average age of mothers at first birth; Black: percentage of the Black population; children: percentage of children <6 years with 2+ Immunizations; chronic lower respiratory diseases (death rate): deaths from chronic lower respiratory diseases per 100,000 population; coastal region: geographic location-coastal region; diabetes: prevalence of diabetes; diabetes (death rate): deaths from diabetes mellitus per 100,000 population; domestic tourism: mean census estimate of vehicle trips in urban; great lakes region: geographic location-great lakes region; health insurance coverage: percentage of health insurance coverage; humidity: relative humidity; influenza and pneumonia (death rate): deaths from influenza and pneumonia per 100,000 population; influenza B: number of positive influenza B (Victoria and Yamagata Lineage); influenza-like illness: number of patients with influenza-like illness; inland: geographic location - landlocked country; international tourism revenue: travel spending by international visitors in the U.S. (billion); Native Hawaiian and other Pacific Islander: percentage of the White population; per capita income: per capita real income; private transport in urban: mean census estimate of vehicle miles traveled in urban; smoking: percentage of smoking population; sports events: number of live audiences in major sports events; urbanization level: percentage of urban population; vehicle usage: proportion of households with cars.
3.3. Ranking variables based on their importance in distinguishing between low and high COVID-19 cases, deaths, and CFRs
In predicting COVID-19 cases, deaths, and CFRs, we achieved the AUC values of 0.80, 0.83, and 0.81, respectively, on the training set, and 0.90, 0.90, and 0.82, respectively, on the test set in countries, and all AUC values >0.8 in the 50 U.S. states (Fig. 1, Fig. 2). These results demonstrate that the variables selected by the LASSO represent important factors affecting COVID-19 risk. We ranked the importance of variables in distinguishing between low and high COVID-19 cases, deaths, and CFRs based on the chi-square statistic. In the world setting, unimproved water sources, internet usage, urbanization level, dairy products intake, aged <10 years, the prevalence of tuberculosis, malnutrition, air passenger traffic, vitamin C intake, and longitude were the ten most essential variables in distinguishing between low and high COVID-19 cases (Fig. 3A). The ten most important variables in distinguishing between low and high COVID-19 deaths were BMI < 18, unimproved water sources, the prevalence of HIV, alcohol intake, longitude, vitamin C intake, sports events, tropical climate, measle immunization, and fruits intake (Fig. 3A). Health expenditure, latitude, vehicle usage, sex ratio, vitamin B intake, sports events, DPT immunization, urbanization level, humidity, and other religions were the ten most important variables in distinguishing between low and high COVID-19 CFRs (Fig. 3A). These results collectively demonstrate that age, climate, social distancing, economic development, health investment, weight, and nutrient intake are mostly associated with COVID-19 risk. We obtained similar results in the U.S. setting except influenza and race being two prominent factors for COVID-19 risk (Fig. 3B).
Fig. 3.

Ranking the importance of variables in distinguishing between low and high COVID-19 cases, deaths, and CFRs based on the chi-square statistic. The importance of variables in the world (A) and the U.S. (B) settings. These variables were selected by the LASSO. The chi-square values are shown.
3.4. Associations of blood type, social distancing, and temperature with COVID-19 transmission and fatality
To investigate the association between the ABO blood type and COVID-19 vulnerability, we also collected ABO blood type distribution (population proportion) by country. We obtained the complete ABO blood type distribution data in 94 countries. We found that blood type A had positive correlations with COVID-19 cases (Spearman's correlation test, ρ = 0.19, P = 0.07), deaths (ρ = 0.29, P = 0.01), and CFRs (ρ = 0.18, P = 0.08) (Fig. 4A). Overall, these results indicate that blood type A is associated with an increased risk of COVID-19, consistent with a recent report (Zhao et al., 2020). In contrast, blood type B and blood type AB displayed significant inverse correlations with COVID-19 cases (blood type B: ρ = −0.40, P = 6.85 × 10⁻⁵; blood type AB: ρ = −0.27, P = 0.01), deaths (blood type B: ρ = −0.55, P = 1.97 × 10⁻⁸; blood type AB: ρ = −0.29, P = 0.004), and CFRs (blood type B: ρ = −0.39, P = 1.17 × 10⁻⁴; blood type AB: ρ = −0.21, P = 0.05) (Fig. 4A). These results indicate that blood types B and AB are associated with a reduced risk of COVID-19.
Fig. 4.

Associations of the ABO blood type, major sports events, and temperature with COVID-19. (A) Blood type A is a risk factor for COVID-19, and blood type B is a protective factor. (B) The positive association between major sports events and COVID-19 risk in European countries. (C) High temperature has a significantly stronger power than low temperature in predicting COVID-19 cases and deaths. The β-coefficients in logistic regression models are shown.
To investigate the association between social distancing and COVID-19 spread, we analyzed the correlations between major sports events from January 2020 to March 2020 and COVID-19 cases, deaths, and CFRs in 38 European countries. We focused on European countries because sports, particularly football, are highly popular in most countries in Europe. We classified 38 European countries into two groups. The first group contained 20 countries hosting major sports events, including Six Nations Championship, UEFA Europa League, and domestic football matches from January 2020 to March 2020, and the second group contained 18 countries hosting no major sports events during this period. We found that COVID-19 cases, deaths, and CFRs were significantly higher in the first group than in the second group (one-sided Mann–Whitney U test, P < 0.1) (Fig. 4B). The mean COVID-19 cases, deaths, and CFRs were 1.27, 3.80, and 2.47 times higher in the first group than in the second group, respectively. Moreover, within the 20 countries hosting major sports events, the total numbers of participants in the major sports events had significant positive correlations with COVID-19 cases (ρ = 0.30, P = 0.07), deaths (ρ = 0.70, P = 1.66 × 10⁻⁶), and CFRs (ρ = 0.70, P = 1.75 × 10⁻⁶) (Fig. 4B). Football is the most popular sport in almost all European countries, and the top five European leagues were subject to a large number of live audiences. As expected, the five countries with the top five European leagues, including UK, Spain, Italy, France, and Germany, had significantly higher COVID-19 cases, deaths, and CFRs than the other European countries (one-sided Mann–Whitney U test, P < 0.1, fold change >1.5) (Fig. 4B). Altogether, these results suggest that major sports events can boost COVID-19 transmission and highlight the importance of social distancing in mitigating COVID-19 spread.
The association between temperature and COVID-19 transmission has been well recognized (Prata et al., 2020; Qi et al., 2020; Baker et al., 2020). To compare the relative contribution of high and low temperature in predicting COVID-19 risk, we built logistic models with both variables to predict COVID-19 cases, deaths, and CFRs in the 154 countries. As expected, both high and low temperatures were negative predictors of COVID-19 cases and deaths. However, the high temperature displayed a significantly stronger power than the low temperature in predicting COVID-19 cases and deaths (Fig. 4C). This indicates that high temperature is a more compelling factor mitigating COVID-19 transmission than low temperature.
4. Discussion
We comprehensively described the most associated factors affecting COVID-19 transmission and fatality. Among numerous factors associated with COVID-19 risk, blood types B and AB were protective factors for COVID-19 risk, while blood type A was a risk factor. The prevalence of HIV and influenza and pneumonia was associated with reduced COVID-19 risk. Other factors included temperature, humidity, social distancing, smoking, and vitamin D intake. The factors most associated with COVID-19 risk included climate, social distancing, economic development, health investment, weight, and nutrient intake.
This study is interesting for several reasons. Firstly, we used the LASSO to evaluate the contribution of different variables to COVID-19 cases, deaths, or case fatality rates (CFRs) and identified the most critical factors associated with COVID-19 based on data related to politics, economy, culture, demographic, geography, education, medical resource, scientific development, environment, diseases, diet, and nutrition. This method overcame the limitation of previous univariate analyses that ignored the interdependence between different factors. Second, we identified novel factors associated with COVID19, including blood types B and AB as protective factors for COVID-19 risk, the negative associations between the prevalence of HIV and influenza and pneumonia and COVID-19 risk, and the positive association between economic inequality and COVID-19 risk. Third, we confirmed some controversial factors associated with COVID-19, including smoking and vitamin D intake as protective factors and blood type A as a risk factor for COVID-19. Finally, this study demonstrates that age, climate, social distancing, economic development, health investment, weight, nutrient intake, influenza, and race are the most prominent factors for COVID-19.
To test the method's robustness of the results' reproducibility, we randomly re-separated the data set into a training set and a test set, with 80% training versus 20% test, 70% training versus 30% test, and 60% training versus 40% test, respectively. For each of the three different separations, we re-built regression models to predict COVID-19 cases, deaths, and CFRs in different countries and in the 50 U.S. states. The new models generally yielded consistent results (Supplementary Tables S3&S4), confirming the reproducibility of our results.
It should be noted that the identified associations between some factors and COVID-19 risk, such as blood types B and AB, HIV, influenza and pneumonia, smoking, and nutrient intake, need to be validated in large-scale clinical data. Besides, why there exist associations between these factors and COVID-19 risk is worthy of further investigations. In particular, the discovery of molecular and genetic mechanisms underlying these associations is vital.
This study has several limitations. First, because the capacity for testing for COVID-19 patients varies among different countries, the reported COVID-19 cases may not fully represent the actual situation of COVID-19 outbreaks in some countries that could affect the accuracy of our predictive models. Second, the sample size is not sufficiently large in terms of the number of predictors we used. As a result, the β-coefficients of some variables were small, so that their associations with COVID-19 risk were ambiguous.
5. Conclusions
Numerous factors may affect COVID-19 transmission and fatality, of which age, climate, social distancing, economic development, health investment, weight, and nutrient intake are most significant. Economic inequality promotes the risk of COVID-19 transmission. The prevalence of HIV and influenza and pneumonia correlates inversely with COVID-19 risk. Blood types B and AB are protective factors for COVID-19, and blood type A is a risk factor. High temperature is a more compelling factor mitigating COVID-19 transmission than low temperature. Major sports events facilitate COVID-19 transmission in European countries. Our comprehensive identification of the factors affecting COVID-19 transmission and fatality may provide new insights into the COVID-19 pandemic and advise effective strategies for preventing and migrating COVID-19 spread.
List of abbreviations
Funding statement
This work was supported by the China Pharmaceutical University (grant number 3150120001 to XW) and the Jiangsu Province Graduate Research and Innovation Program Project (grant number KYCX20_0658 to ML).
CRediT authorship contribution statement
Mengyuan Li: Software, Validation, Formal analysis, Investigation, Data curation, Visualization, Writing - review & editing. Zhilan Zhang: Data curation. Wenxiu Cao: Data curation. Yijing Liu: Data curation. Beibei Du: Data curation. Canping Chen: Data curation. Qian Liu: Data curation. Md. Nazim Uddin: Data curation. Shanmei Jiang: Data curation. Cai Chen: Data curation. Yue Zhang: Investigation. Xiaosheng Wang: Conceptualization, Methodology, Investigation, Resources, Writing - original draft, Writing - review & editing, Supervision, Project administration, Funding acquisition.
Declaration of competing interest
The authors declare that they have no competing interests.
Acknowledgments
Not applicable.
Editor: Jay Gan
Footnotes
Supplementary data to this article can be found online at https://doi.org/10.1016/j.scitotenv.2020.142810.
Appendix A. Supplementary data
Supplementary Table S1. 77 factors (variables) that could affect COVID-19 transmission and fatality in 154 countries.
Supplementary Table S2. 55 factors (variables) that could affect COVID-19 transmission and fatality in the 50 U.S. states.
Supplementary Table S3. Supplementary Table S3. The variables selected by the LASSO in predicting COVID-19 cases, deaths, and/or case fatality rates in 154 countries with 80% training versus 20% test, 70% training versus 30% test, and 60% training versus 40% test, respectively.
Supplementary Table S4. The variables selected by the LASSO in predicting COVID-19 cases, deaths, and/or case fatality rates in the 50 U.S. states with 80% training versus 20% test, 70% training versus 30% test, and 60% training versus 40% test, respectively.
References
- Fourth International Conference on Fuzzy Systems and Knowledge Discovery (FSKD 2007) IEEE; 2007. A top-down and greedy method for discretization of continuous attributes. [Google Scholar]
- Baker R.E., Yang W., Vecchi G.A. Susceptible supply limits the role of climate in the early SARS-CoV-2 pandemic. Science. 2020 doi: 10.1126/science.abc2535. [DOI] [PMC free article] [PubMed] [Google Scholar]
- Baud D., Qi X., Nielsen-Saines K. Real estimates of mortality following COVID-19 infection. Lancet Infect. Dis. 2020;20(7):773. doi: 10.1016/S1473-3099(20)30195-X. [DOI] [PMC free article] [PubMed] [Google Scholar]
- Bischl B., Lang M., Kotthoff L. mlr: machine learning in R. J. Mach. Learn. Res. 2016;17(1):5938–5942. [Google Scholar]
- Breiman L. Better subset regression using the nonnegative garrote. Technometrics. 1995;37(4):373–384. doi: 10.2307/1269730. [DOI] [Google Scholar]
- Chen J. Pathogenicity and transmissibility of 2019-nCoV—a quick overview and comparison with other emerging viruses. Microbes Infect. 2020;22(2):69–71. doi: 10.1016/j.micinf.2020.01.004. [DOI] [PMC free article] [PubMed] [Google Scholar]
- COVID-19 Dashboard: Johns Hopkins University; 2020 [updated 3 May 2020]. Available from: https://coronavirus.jhu.edu/map.html.
- Gaibazzi N., Tuttolomondo D., Guidorossi A. Smoking prevalence is low in symptomatic patients admitted for COVID-19. medRxiv. 2020 doi: 10.1101/2020.05.05.20092015. [DOI] [Google Scholar]
- Gonzalez-Abril L., Cuberos F.J., Velasco F. Ameva: an autonomous discretization algorithm. Expert Systems with Applications. 2009;36(3, Part 1):5327–5332. doi: 10.1016/j.eswa.2008.06.063. [DOI] [Google Scholar]
- Grant W.B., Lahore H., McDonnell S.L. Evidence that vitamin D supplementation could reduce risk of influenza and COVID-19 infections and deaths. Nutrients. 2020;12(4):988. doi: 10.3390/nu12040988. [DOI] [PMC free article] [PubMed] [Google Scholar]
- Grifoni A., Weiskopf D., Ramirez S.I. Targets of T cell responses to SARS-CoV-2 coronavirus in humans with COVID-19disease and unexposed individuals. Cell. 2020 doi: 10.1016/j.cell.2020.05.015. [DOI] [PMC free article] [PubMed] [Google Scholar]
- Koo J.R., Cook A.R., Park M. Interventions to mitigate early spread of SARS-CoV-2 in Singapore: a modelling study. Lancet Infect. Dis. 2020 doi: 10.1016/S1473-3099(20)30162-6. [DOI] [PMC free article] [PubMed] [Google Scholar]
- Kurgan L.A., Cios K.J. CAIM discretization algorithm. IEEE Trans. Knowl. Data Eng. 2004;16(2):145–153. doi: 10.1109/TKDE.2004.1269594. [DOI] [Google Scholar]
- Lau FH, Majumder R, Torabi R, et al. Vitamin D insufficiency is prevalent in severe COVID-19. medRxiv 2020 doi: 10.1101/2020.04.24.20075838. [DOI]
- Lewnard JA, Lo, NC. Scientific and ethical basis for social-distancing interventions against COVID-19. The Lancet Infectious Diseases 2020 doi: 10.1016/S1473-3099(20)30190-0. [DOI] [PMC free article] [PubMed]
- Mahase E. Coronavirus: covid-19 has killed more people than SARS and MERS combined, despite lower case fatality rate. Bmj. 2020;368:m641. doi: 10.1136/bmj.m641. [DOI] [PubMed] [Google Scholar]
- McKee M., Stuckler D. If the world fails to protect the economy, COVID-19 will damage health not just now but also in the future. Nat. Med. 2020 doi: 10.1038/s41591-020-0863-y. [DOI] [PubMed] [Google Scholar]
- Millett G.A., Jones A.T., Benkeser D. Assessing differential impacts of COVID-19 on black communities. Ann. Epidemiol. 2020;47:37–44. doi: 10.1016/j.annepidem.2020.05.003. [DOI] [PMC free article] [PubMed] [Google Scholar]
- Onder G., Rezza G., Brusaferro S. Case-fatality rate and characteristics of patients dying in relation to COVID-19 in Italy. JAMA. 2020 doi: 10.1001/jama.2020.4683. [DOI] [PubMed] [Google Scholar]
- Prata D.N., Rodrigues W., Bermejo P.H. Temperature significantly changes COVID-19 transmission in (sub)tropical cities of Brazil. Sci. Total Environ. 2020;729:138862. doi: 10.1016/j.scitotenv.2020.138862. [DOI] [PMC free article] [PubMed] [Google Scholar]
- Qi H., Xiao S., Shi R. COVID-19 transmission in Mainland China is associated with temperature and humidity: a time-series analysis. Sci. Total Environ. 2020;728:138778. doi: 10.1016/j.scitotenv.2020.138778. [DOI] [PMC free article] [PubMed] [Google Scholar]
- Roda W.C., Varughese M.B., Han D. Why is it difficult to accurately predict the COVID-19 epidemic? Infectious Disease Modelling. 2020;5:271–281. doi: 10.1016/j.idm.2020.03.001. [DOI] [PMC free article] [PubMed] [Google Scholar]
- Scheen AJ. [Obesity and risk of severe COVID-19]. Revue Medicale Suisse 2020;16(695):1115–19. [published Online First: 2020/05/29]. [PubMed]
- Tibshirani R. Regression selection and shrinkage via the lasso. Journal of the Royal Statistical Society B. 1996;58(1):267–288. [Google Scholar]
- Tibshirani R. The lasso method for variable selection in the Cox model. Statistics in Medicine 1997;16(4):385–95. doi: 10.1002/(sici)1097-0258(19970228)16:4<385::aid-sim380>3.0.co;2-3 [published Online First: 1997/02/28]. [DOI] [PubMed]
- Tsai C.-J., Lee C.-I., Yang W.-P. A discretization algorithm based on class-attribute contingency coefficient. Inf. Sci. 2008;178(3):714–731. doi: 10.1016/j.ins.2007.09.004. [DOI] [Google Scholar]
- Zhao J, Yang Y, Huang H, et al. Relationship between the ABO blood group and the COVID-19 susceptibility. medRxiv 2020 doi: 10.1101/2020.03.11.20031096. [DOI]
- Zhou F., Yu T., Du R. Clinical course and risk factors for mortality of adult inpatients with COVID-19 in Wuhan, China: a retrospective cohort study. Lancet. 2020;395(10229):1054–1062. doi: 10.1016/S0140-6736(20)30566-3. [DOI] [PMC free article] [PubMed] [Google Scholar]
Associated Data
This section collects any data citations, data availability statements, or supplementary materials included in this article.
Supplementary Materials
Supplementary Table S1. 77 factors (variables) that could affect COVID-19 transmission and fatality in 154 countries.
Supplementary Table S2. 55 factors (variables) that could affect COVID-19 transmission and fatality in the 50 U.S. states.
Supplementary Table S3. Supplementary Table S3. The variables selected by the LASSO in predicting COVID-19 cases, deaths, and/or case fatality rates in 154 countries with 80% training versus 20% test, 70% training versus 30% test, and 60% training versus 40% test, respectively.
Supplementary Table S4. The variables selected by the LASSO in predicting COVID-19 cases, deaths, and/or case fatality rates in the 50 U.S. states with 80% training versus 20% test, 70% training versus 30% test, and 60% training versus 40% test, respectively.