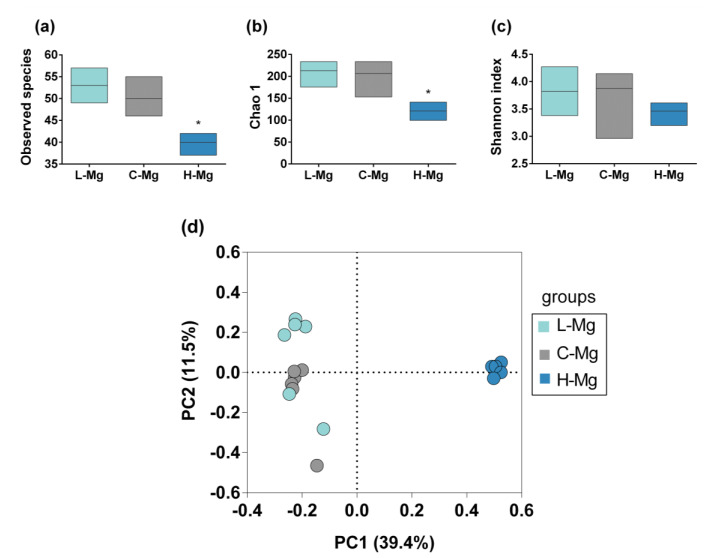
Figure 1.
Alpha and beta diversity among the groups. (a) Observed species among the study groups. (b) Comparison of species richness among the groups. (c) Comparison of species diversity among the groups. (d) Beta diversity. Principal Coordinates Analysis (PCoA) plot based on generalized UniFrac distances among the groups. Low magnesium diet (L-Mg) (light blue circles), control diet (C-Mg) (gray circles), and high magnesium diet (H-Mg) (dark blue circles). * p < 0.05 compared to the C-Mg group. Boxes represent the minimum value to the maximum value, with the internal horizontal line representing the median.

