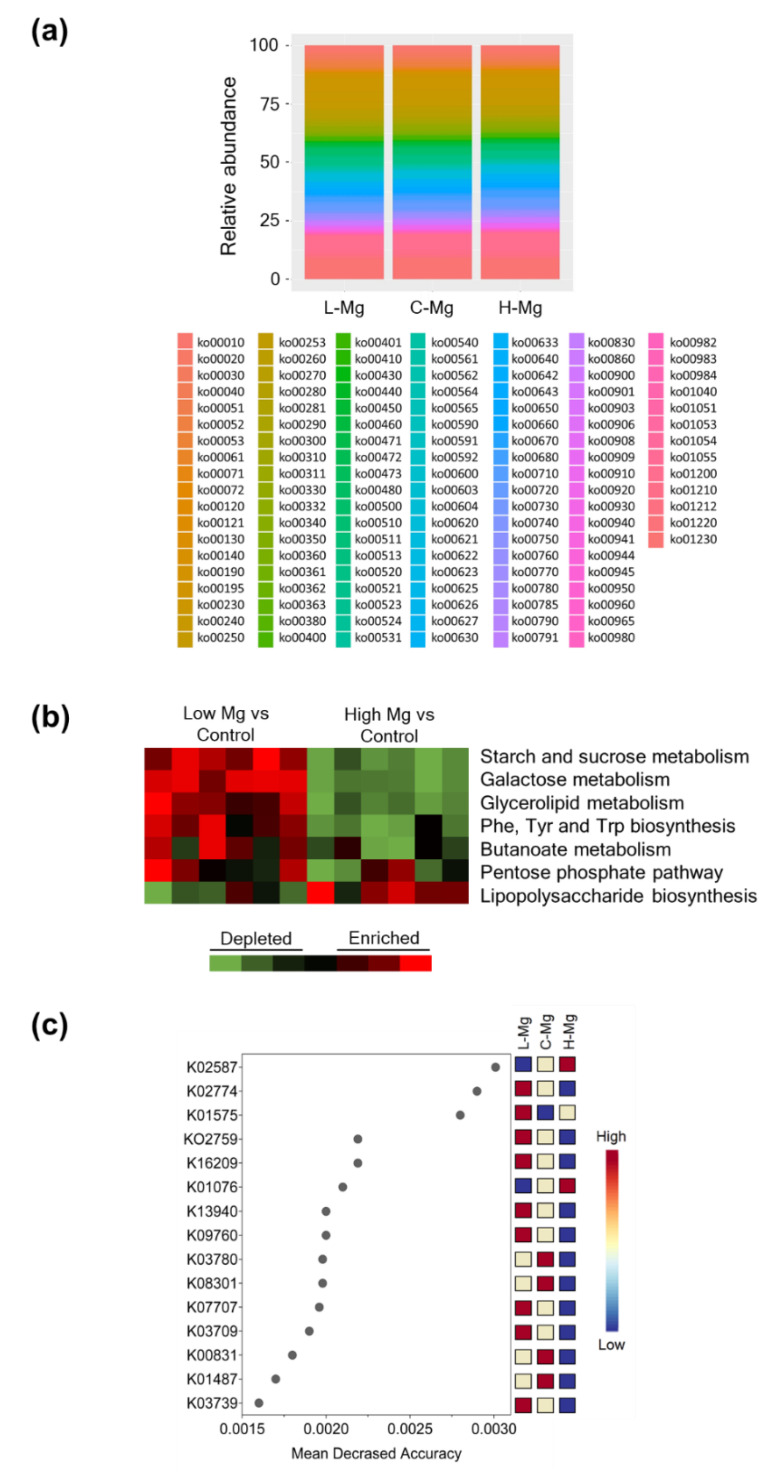
Figure 4.
Inferred metagenomic analyses from the fecal microbiomes of the L-Mg, C-Mg, and H-Mg groups. (a) The relative contribution of KEGG (Kyoto Encyclopedia of Genes and Genomes) pathways encoded in the gut microbiota of the L-Mg, C-Mg, and H-Mg groups. (b) KEGG pathways consistently enriched or depleted in the fecal microbiomes of the L-Mg or H-Mg groups compared with the C-Mg group. Red denotes enrichment and green indicates depletion. Black indicates pathways whose representation is not significantly different. (c) Plot of the most significant KEGG Orthology (KO) identified by random forest. The features are ranked by the mean decrease in classification accuracy (500 permutations). Red denotes the most important feature and blue indicates the least important feature.

