

Abstract
Ivacaftor–tezacaftor and ivacaftor–tezacaftor–elexacaftor are new breakthrough cystic fibrosis (CF) drug combinations that directly modulate the activity and trafficking of the defective CF transmembrane conductance regulator protein (CFTR) underlying the CF disease state. Currently, in the hospital setting, there are no therapeutic drug monitoring assays for these very expensive, albeit, life-saving drugs. A rapid and precise novel method for the quantification of ivacaftor, its metabolites, tezacaftor, and elexacaftor, in human plasma was developed and validated using multiple reaction monitoring mass spectrometry (MRM/MS). The MRM/MS analytical method was validated at a concentration range of 0.0025–1 μg/mL for ivacaftor, ivacaftor-M1, ivacaftor-M6, tezacaftor, and elexacaftor in human plasma. The method displayed good accuracy (90.62–94.51%) and reproducibility (99.91–100%) including at low concentrations 0.01 μg/mL. With a mobile phase consisting of [acetonitrile/water]/0.1% formic acid (70:30 v/v) at a flow rate of 0.5 mL/min, a linear correlation was observed over a concentration range of 0.0025–1 μg/mL in human plasma for ivacaftor (R2 = 0.9865105), ivacaftor-M1 (R2 = 0.9852684), ivacaftor-M6 (R2 = 0.9911764), tezacaftor (R2 = 0.98742470), and elexacaftor (R2 = 0.9897608). The reported method can accurately quantify ivacaftor, ivacaftor-M1, ivacaftor-M6, tezacaftor, and elexacaftor at low concentrations in human plasma. We have established a cost-efficient and timely method for measuring ivacaftor, its metabolites, and tezacaftor with or without elexacaftor in human plasma suitable for high-throughput applications in the hospital settings or clinical trials.
Keywords: biomarkers, cystic fibrosis, CFTR modulators, treatment response
Ivacaftor–tezacaftor and ivacaftor–tezacaftor–elexacaftor combinations are the novel breakthrough cystic fibrosis (CF) treatments directly modulating the activity and trafficking of the defective CF transmembrane conductance regulator protein (CFTR).1 CF is the most common autosomal recessive disease in Caucasian populations with serious, chronically debilitating morbidities, and high premature mortality, and at present, there is no cure.2 Current treatment guidelines for CF recommend a regime of CFTR modulators with nonmodulator medications (e.g., anti-inflammatories or pancreatic enzymes) concomitantly administered to maintain and improve lung function, reduce the risk of infections and exacerbations, and improve quality of life. Tezacaftor and elexacaftor are second- and third-generation CFTR correctors facilitating cellular processing and trafficking of CFTR (including F508del-CFTR) to the cell surface, resulting in increase of functional CFTR protein delivered, subsequently increasing chloride transport.3,4 Ivacaftor is a CFTR potentiator increasing the channel-open probability (or gating) of CFTR at the cell surface to increase chloride transport. Ivacaftor–tezacaftor combination was shown to be efficacious in F508del heterozygous patients carrying a CFTR residual function allele as well as displaying comparable clinical efficacy outcomes in terms of lung function [forced expiratory volume in 1 s (FEV1)] and fewer side effects and drug–drug interactions than its predecessor lumacaftor.1,5−8 Elexacaftor (VX-445) (FDA approved as of 2019, European Medicines Agency (EMA) approved as of 2020) and bamocaftor (VX-659) are next-generation CFTR correctors designed to restore F508del-CFTR protein function in patients with CF when administered with tezacaftor and ivacaftor.9−11 Together, approximately 90% of CF patients in the United State are eligible for CFTR modulator therapies of either ivacaftor, N-(2,4-ditert-butyl-5-hydroxyphenyl)-4-oxo-1,4-dihydroquinoline-3-carboxamide (C24H28N2O3), with tezacaftor, 1-(2,2-difluoro-1,3-benzodioxol-5-yl)-N-[1-[(2R)-2,3-dihydroxypropyl]-6-fluoro-2-(1-hydroxy-2-methylpropan-2-yl)indol-5-yl]cyclopropane-1-carboxamide (C26H27F3N2O6), or ivacaftor–tezacaftor with elexacaftor, (S)-N-((1,3-dimethyl-1H-pyrazol-4-yl)sulfonyl)-6-(3-(3,3,3-trifluoro-2,2-dimethylpropoxy)-1H-pyrazol-1-yl)-2-(2,2,4-trimethylpyrrolidin-1-yl)nicotinamide (C26H34F3N7O4S) combination (Table 1).12
Table 1. CFTR Modulators Developed for Cystic Fibrosis.

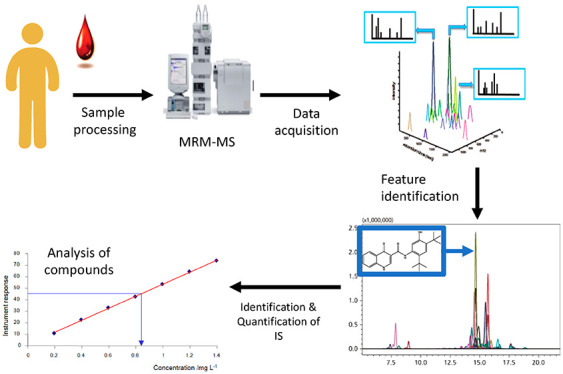
Ivacaftor–tezacaftor is administered orally with the recommended dose being one tablet (100 mg of tezacaftor+150 mg of ivacaftor) taken in the morning and one tablet of ivacaftor (150 mg only), taken in the evening, approximately 12 h apart.1 Ivacaftor–tezacaftor–elexacaftor combination is given orally with the recommended dose is one tablet (200 mg of elexacaftor+100 mg of tezacaftor+150 mg of ivacaftor) taken in the morning and one tablet of ivacaftor (150 mg) only, taken in the evening. Similar to ivacaftor monotherapy and ivacaftor–lumacaftor (first-generation CFTR potentiator), ivacaftor–tezacaftor are taken with high-fat-containing food to increase bioavailability. Following its oral administration, both ivacaftor, tezacaftor, and elexacaftor are readily absorbed from the gut; however, they have low solubility in water (<0.05 μg/mL). Tezacaftor and ivacaftor exhibit a Tmax of ∼4 and ∼6 h, respectively.13 For the triple combination Tmax is as follows: 6 h (4–12) elexacaftor, 3 h (2–4) tezacaftor, and 4 h (3–6) ivacaftor. If given alone, then the half-life of ivacaftor is 12–14 h, while the half-life of tezacaftor is 111 h (Table 2). The half-life of the combination is changed to 9.3 h for ivacaftor and 156 h for tezacaftor.14 The annual cost per patient for both drugs is high, and presently, their manufacturer has a market monopoly as these are the only drugs on the market available for their indication. Presently, very little information is available concerning the steady-state plasma concentrations of ivacaftor–tezacaftor and ivacaftor–tezacaftor–elexacaftor combinations achievable in patients under the current recommended dosage regimen; no methods for therapeutic drug monitoring have been reported so far. We have previously reported an analytical method for the quantification of ivacaftor–lumacaftor treatment.15,16 The application of the ivacaftor–lumacaftor analytical assay was implemented in the hospital setting and utilized for a number of clinical studies.18−21 With the clinical shift from ivacaftor–lumacaftor to ivacaftor–tezacaftor and ivacaftor–tezacaftor–elexacaftor therapy, we sought to adapt and optimize our previous HPLC/LC-MS to the changing landscape in CF standard care.10,15,16 The objective of this study was to develop a reliable and simple multiple reaction monitoring mass spectrometry (MRM-MS) method for the quantification of ivacaftor, its major metabolites ivacaftor-M1 and ivacaftor-M6, tezacaftor, and elexacaftor in plasma for therapeutic drug monitoring of CF patients receiving ivacaftor–tezacaftor therapy. MRM assays are directed tandem mass spectrometric techniques performed onto triple quadrupole mass spectrometers for the sensitive and specific analysis of compounds and their metabolites in biological samples.22−25 The implementation of the assay is of great clinical utility for pharmacokinetic monitoring and developing exposure–response relationships to maximize drug efficacy.
Table 2. ADME Profile of Ivacaftor and Ivacaftor–Tezacaftor and Ivacaftor–Tezacaftor–Elexacaftor Standard Therapya.
| ivacaftor | tezacaftor | elexacaftor | ivacaftor+tezacaftor | ivacaftor+tezacaftor+elexacaftor | |
|---|---|---|---|---|---|
| Pharmacokinetics | |||||
| description | film-coated tablet: 150 mg | 100 mg once daily (clinical trial) | elexacaftor, 200 mg once daily | tezacaftor, 100 mg once daily + ivacaftor, 150 mg every 12 h | elexacaftor, 200 mg, and tezacaftor, 100 mg, once daily + ivacaftor 150 mg, every 12 h |
| mean AUC | 5260 ng·hr/mL | 57400 ng·hr/mL | 82.7 μg·h/mL tezacaftor | 162 (48.1) μg·h/mL elexacaftor | |
| 10.9 μg·h/mL ivacaftor | 94.5 (24.0) μg·h/mL tezacaftor | ||||
| 11.7 (4.01) μg·h/mL ivacaftor | |||||
| mean Cmax | 233 ng/mL | 5530 ng·hr/mL | 6.52 μg/mL tezacaftor and 1.28 μg/mL ivacaftor | 8.7 (2.1) μg/mL elexacaftor | |
| 6.8 (1.5) μg/mL tezacaftor | |||||
| 1.2 (0.3) μg/mL ivacaftor | |||||
| steady state reached | 3–5 days with accumulation ratio of 2.2–2.9 | within 8 days with accumulation ratio of 1.5 | within 14 days with accumulation ratio of 2.3 | at steady state: accumulation ratio = 2.3 for tezacaftor and 3.0 for ivacaftor | at steady state: accumulation ratio = 3.6 for elexacaftor, 2.8 for tezacaftor, and 4.7 for ivacaftor |
| half-life | 12–14 h | 111 h | 156 (52.7) h tezacaftor | 6 h (4–12) elexacaftor, 3 h (2–4) tezacaftor, 4 h (3–6) ivacaftor | |
| 9.3 (1.7) h ivacaftor | |||||
| Absorption | |||||
| increase in exposure | from 25 mg every 12 h to 450 mg every 12 h | Tezacaftor exposure increased from 10 mg to 300 mg once daily when administered alone or in combination with ivacaftor. | 20% increase in ivacaftor exposure in the presence of tezacaftor | ||
| Tezacaftor exposure increased from 10 mg to 300 mg once daily when administered alone or in combination with ivacaftor. | |||||
| increase in exposure due to food effect | increased 2–4 fold if given with fat containing food | No relevant food effect on exposure to tezacaftor | AUC increases 1.9–2.5 fold with moderate-fat meal | ||
| median (range) tmax | 4.0 (3.0–6.0) h | 3.0 (2.0–4.0) h | 6.0 (4.0–12.0) h | 4.0 (2.0–8.0) h tezacaftor | 6 (4–12) h elexacaftor |
| 6.0 (3.0–10.0) h ivacaftor | 3 (2–4) h tezacaftor | ||||
| 4 (3–6) h ivacaftor | |||||
| Distribution | |||||
| plasma proteins | 99% bound to HSA and AGP | 99% bound to HSA | >99% bound to HSA | ||
| volume of distribution | 293 (89.8) L | 82.0 (22.3) L | 53.7 (17.7) L | 271 ± 157 L tezacaftor | 53.7 (17.7) L elexacaftor |
| 206 ± 82.9 L ivacaftor | 82.0 (22.3) L tezacaftor | ||||
| 293 (89.8) L ivacaftor | |||||
| Metabolism | |||||
| cytochrome metabolism | CYP3A4 | CYP3A4/5 | CYP3A4/5 | ||
| metabolites | ivacaftor-M1 (partially active), ivacaftor-M6 (inactive) | tezacaftor-M1 (active), tezacaftor-M2 (partially active), tezacaftor-M5 (inactive) | M23-ELX (active) | ||
| Excretion | |||||
| elimination in faeces | 88% (22% as M1 and 43% as M6) | 72% (unchanged or as tezacaftor-M2) | 87.3% (primarily as metabolites) | ||
| urinary elimination | 6.6% (ivacaftor, M1 and M6) | 14% mostly tezacaftor-M2 | 0.23% | ||
| terminal half-life | elimination half-life: 9.3 (1.72) h | elimination half-life: 109–122 h | 24.7 (4.87) h elexacaftor | ||
| 60.3 (15.7) h tezacaftor | |||||
| 13.1 (2.98) h ivacaftor | |||||
| apparent clearance (CL/F) | 17.3 (±8.4) L/h at steady state | total systemic clearance 1.34 L/h | 1.31 (±0.41) L/h tezacaftor | 1.18 (0.29) L/h elexacaftor | |
| 15.7 (±6.38) L/h ivacaftor | 0.79 (0.10) L/h tezacaftor | ||||
| 10.2 (3.13) L/h ivacaftor | |||||
Materials and Methods
Materials
Ivacaftor, tezacaftor, and elexacaftor were purchased from SelleckChem, USA. Ivacaftor–carboxylate/ivacaftor-M6 metabolite (catalog number 510242247CS) and hydroxymethyl–ivacaftor/ivacaftor-M1 metabolite (catalog number 510240849CS) were purchased from Clearsynth (Canada) and were used as internal standards (IS) in methanol at 10 μg/mL. Methanol (MeOH, ≥99.9% HPLC LC-MS grade), acetonitrile (≥99.9% HPLC LC-MS grade), and LC-MS-grade formic acid were purchased from Sigma-Aldrich (Australia). Experiments were performed on a triple-quadrupole Shimadzu 8030 LC-MS using a C8 column (Phenomenex; 2.6 μm, 100 Å; 50 × 2.1 mm) with the guard column C8 (Phenomenex; 2.1 mm ID Columns, 3/Pk). Plasma was obtained from the Australian Red Cross.
Standards Preparation
Independent stock solutions of internal standard of each analyte (ivacaftor, ivacaftor-M1, ivacaftor-M6, tezacaftor, and elexacaftor) were freshly prepared in methanol for each analytical run at 100 μg/mL and by further dilutions working stock solutions of 0.8 μg/mL were prepared. Ten calibration standards stock solutions of each analyte at 0.001, 0.0025, 0.005, 0.01, 0.025, 0.05, 0.1, 0.025, 0.5, and 1 μg/mL were prepared in methanol by serial dilution of the 100 or 0.8 μg/mL stock solutions.
Plasma Sample Processing
Blank plasma samples are spiked with international standards at the concentration range described above and vortex-mixed before sampling, and an aliquot of 200 μL was transferred into a 1.5 mL polypropylene microcentrifuge tube. Protein precipitation was achieved through a 1:2 precipitation using a mixture of acetonitrile/0.1% formic acid. The mixture was set at room temperature for 10 min, then vortexed vigorously, then centrifuged at 10 000 × g for another 10 min (Eppendorf Centrifuge 5430). A 200 μL aliquot of the clear supernatant was filtered through a 13 mm syringe filter (0.45 μm nylon, GRACE, USA) into a 1.5 mL HPLC vial [Phenomenex VEREX, 9 mm, PP, 300 μL, PTFE/Silicone septa]. An aliquot of 5 μL was injected onto the column.
MRM Method Development
In an MRM assay, the sensitivity of an MRM ion pair is directly related to the signal intensity of the fragment ion that is transmitted through quadrupole 3 (Q3) and allowed to strike the detector.22 Briefly, all analytes (0.8 μg/mL in methanol and the corresponding diluted standards) alone were injected in positive and negative mode to determine which Q3 mode generates the highest signal. In a second step, the collision energy voltage ranging from in the mass spectrometer were varied (−10 to −40 V), which affects the fragmentation pattern of analytes and the relative intensities of the fragment ions. Third, fragment precursors were calculated based on predicted m/z values and identified for each analyte. For each MRM ion pair, the extracted ion chromatograms are generated, and the five highest intensity peaks identified based on their corresponding collision energy (CE). Finally, the optimized MRM acquisition method is generated. Details are found in Table 3.
Table 3. Analyte Parameters for Ivacaftor, Ivacaftor-M1, Ivacaftor-M6, Tezacaftor, and Elexacaftor.
| compound | precursor m/z | product m/z | +/– | dwell time (msec) | Q1 preBias (V) | CE | Q3 preBias (V) |
|---|---|---|---|---|---|---|---|
| ivacaftor | 393.1 | 337.0 | + | 10.00 | –19.0 | –15.0 | –17.0 |
| 172.0 | + | 10.00 | –11.0 | –50.0 | –21.0 | ||
| 319.0 | + | 10.00 | –11.0 | –49.0 | –29.0 | ||
| ivacaftor-M1 | 408.5 | 353.0 | + | 10.00 | –30.0 | –17.0 | –28.0 |
| 172.0 | + | 10.00 | –10.0 | –55.0 | –20.0 | ||
| 335.1 | + | 10.00 | –12.0 | –55.0 | –30.0 | ||
| ivacaftor-M6 | 423.1 | 367.0 | + | 10.00 | –17.0 | –14.0 | –28.0 |
| 346 | + | 10.00 | –15.0 | –35.0 | –15.0 | ||
| tezacaftor | 521.1 | 440.0 | + | 10.00 | –26.0 | –19.0 | –24.0 |
| 130.9 | + | 10.00 | –24.0 | –53.0 | –15.0 | ||
| 222.9 | + | 10.00 | –22.0 | –42.0 | –22.0 | ||
| elexacaftor | 598 | 422 | + | 10.00 | –26.0 | –55.0 | –18.0 |
| 205 | + | 10.00 | –36.0 | –55.0 | –29.0 | ||
| 329 | + | 10.00 | –26.0 | –54.0 | –20.0 |
MRM-MS Analytics
The analysis of plasma samples was performed on a Shimadzu 8030 LCMS system coupled with the 8030 triple quadrupole mass spectrometers. Details on the MRM-MS conditions are summarized in Table 4. The mobile phase flow was split before entering the mass spectrometer in ratio 2:1 (waste/MS inlet). Analytes were detected using multiple reaction monitoring (MRM). The ion transitions of ivacaftor 393.1 → 337.0 m/z, ivacaftor-M1 408.5 → 353.0 m/z, ivacaftor-M6 423.1 → 367.0 m/z, tezacaftor 521.1 → 440.0 m/z, and elexacaftor 597.7 → 598 m/z. Chromatographic separation was achieved using a C8 column (2.6 μm; 100 Å; 50 × 2.1 mm) equipped with a guard column C8 (2.1 mm ID Columns, 3/Pk). The mobile phase consisted of 0.1% formic acid in water (A) and acetonitrile (B). Injection volume was 2 μL. The gradient started at 30% B at time 0 and increased to 90% B by 4.00 min, kept at 90% B until 4.5 min, and then reduced to 20% B by 5.50 min. After each injection, the needle was washed with 300 μL of 80% methanol, 20% water, and gradient then returned to 30% B.
Table 4. Details of the LC-MS/MS Conditions.
| HPLC Conditions | |
| column | C8; 2.6 μm; 100 Å; 50 × 2.1 mm |
| guard column | C8 for 2.1 mm I.D. columns, 3/Pk |
| oven temperature | 35 °C |
| mobile phase A | 0.1% FA in water |
| mobile phase B | 100% acetonitrile |
| mode | binary gradient |
| mobile phase composition at starting point | 70/30 (v/v) |
| sample temperature | 4 °C |
| injection volume | 2 μL |
| needle wash | 80% methanol, 20% water 300 μL |
| flow rate | 0.5 mL/min |
| gradient | time 0: 30% B |
| from 0 to 4.00 min: kept at 30% B | |
| by 4.00 min: 90% B | |
| from 4.00 to 4.50 min: kept at 90% B | |
| from 5.00 min: 30% B | |
| from 5.00 to 5.50 min: kept at 30% B | |
| total run | 5.5 min |
| retention times | retention time for ivacaftor: 2.248 min |
| retention time for ivacaftor-M1: 1.136 min | |
| retention time for ivacaftor-M6: 0.981 min | |
| retention time for tezacaftor: 1.719 min | |
| retention time for elexacaftor: 3.306 min | |
| MS Conditions | |
| detection mode | electrospray positive ESI |
| interface voltage | 4.5 kV |
| interface current | 1.9 uA |
| collision energy | 295.9 V |
| nebulizing gas (nitrogen) | 3 L/min |
| drying gas (nitrogen) flow | 15 L/min |
| desolvation temperature | 250 °C |
| heat block temperature | 400 °C |
| conversion dyno | 6.0 kV |
| detector voltage | 2.18 kV |
| IG vacuum | 1.9 × 1003 Pa |
| PG vacuum | 1.1 × 10+02 Pa |
| CID gas | 230 kPa |
Method Validation
The method validation procedure for ivacaftor–tezacaftor and ivacaftor–tezacaftor–elexacaftor were based on the FDA guidelines for bioanalytical method validation.26 Partially method validation was performed including parameters listed in Table 5 as the aim was to develop a method that is easily accessible for diagnostic laboratories in a clinical setting measuring all four compounds in one single assay.
Table 5. Ivacaftor, Ivacaftor Metabolites, Tezacaftor and Elexacaftor Analytical Parameters Including LOD, LOQ, Recovery, and Inter- and Intraday Precision and Accuracy.
| ivacaftor [μg/mL] | ivacaftor-M1 [μg/mL] | ivacaftor-M6 [μg/mL] | tezacaftor [μg/mL] | elexacaftor [μg/mL] | ||
|---|---|---|---|---|---|---|
| LOD | 8.46 × 10–03 | 2.54 × 10–02 | 2.27 × 10–02 | 1.80 × 10–02 | 7.40 × 10–03 | |
| LOQ | 2.82 × 10–02 | 8.46 × 10–02 | 7.58 × 10–02 | 6.00 × 10–02 | 2.47 × 10–02 | |
| accuracy (%) | 91.87 ± 0.007 | 94.51 ± 0.04 | 92.97 ± 0.03 | 90.62 ± 0.04 | 92.27 ± 0.09 | |
| interday | 0.1 μg/mL | 100.0 ± 0.16 | 96.22 ± 5.28 | 91.95 ± 9.98 | 94.36 ± 6.61 | 96.55 ± 4.89 |
| 1.0 μg/mL | 99.91 ± 0.11 | 100.45 ± 0.62 | 100.48 ± 0.67 | 100.46 ± 0.67 | 100.44 ± 0.61 | |
| intraday | 0.1 μg/mL | 98.00 ± 0.36 | 80.00 ± 0.38 | 92.50 ± 0.44 | 95.50 ± 0.46 | 95.33 ± 0.17 |
| 1.0 μg/mL | 95.45 ± 0.06 | 93.90 ± 0.03 | 97.90 ± 0.01 | 95.20 ± 0.06 | 98.05 ± 0.01 | |
| recovery from plasma (%) | 78.21 ± 5.44 | 84.2 ± 18.215 | 101.52 ± 2.14 | 94.22 ± 1.46 | 111.93 ± 8.80 |
Abbreviations: lower limit of detection (LOD), lower limit of quantification (LOQ)
For the level 1 analysis, MRM data processing and analyte peak recognition was achieved using integration software postrun (Shimazu). Default peak integration settings were set to detect peaks using a 1 min retention window around the analytes’ retention time. Default values were subtracted for noise and baseline. All integrated chromatograms were manually inspected (level 2 analysis) to ensure the software recognized and integrated the correct peak for each MRM ion pair. The calibration curves for ivacaftor, ivacaftor-M1, ivacaftor-M6, tezacaftor, and elexacaftor were constructed before each analytical run using the relationship between the peak area ratios of analyte/fragment to international standards and the calibration standard nominal concentrations of ivacaftor, ivacaftor-M1, ivacaftor-M6, tezacaftor, and elexacaftor (Figure 1). Linear least-squares regression analysis with weighting 1/C^2 was performed according to the reciprocal of concentrations (Shimadzu).
Figure 1.

Calibration curves of ivacaftor, ivacaftor-M1, ivacaftor-M6, and tezacaftor.
Results
Method Development
We have previously reported reliable HPLC/LC-MS methods for the detection and quantification of ivacaftor and lumacaftor.15,16 The MRM-MS method herein was based on the chromatographic separation and peak shape of blank plasma spiked with standards ivacaftor, ivacaftor-M1, ivacaftor-M6, tezacaftor, and elexacaftor. Analyte specific transition settings such as precursor m/z, Q1 pre-rod bias voltage, product m/z, collision energy, and Q3 pre-rod bias (Tables 3 and 4) were optimized using LabSolutions software (Shimadzu, Japan 2019) protocols from flow injections analysis of mixed pure standards containing all four analytes at a concentration of 0.1 μg/mL. HESI source parameters were manually optimized. Baseline peak separation for ivacaftor, ivacaftor-M1, ivacaftor-M6, tezacaftor, and elexacaftor was achieved using reverse-phase chromatography. As shown in Table 3, in source fragmentation of analytes resulted in the following specific transitions ranging from highest to lowest intensity, ivacaftor 393 > 337 > 172 > 319 m/z, ivacaftor-M1 408.5 > 353 > 172 > 335.1 m/z, ivacaftor-M6 423 > 367 > 349 m/z, tezacaftor 521.1 > 440 > 130.9 > 222.9 m/z, and elexacaftor 597.7 > 422 > 205 > 329 m/z, being produced at the following retention times, ivacaftor 2.25 min, ivacaftor-M1 1.14 min, ivacaftor-M6 0.98 min, tezacaftor 1.72 min, and elexacaftor 3.31 min. Furthermore, the following unspecific transitions were detected; however due to their nonspecificity not used for peak quantifications: ivacaftor 302 > 209 > 57 m/z, ivacaftor-M1 281 > 164 m/z, ivacaftor-M6 311 > 291 > 209 > 126 > 11 m/z, tezacaftor 449 > 420 > 291 > 131 m/z, and elexacaftor 502 m/z (Figure 2). Thus, good peak separation is essential to avoid signal contamination. In all spiked plasma samples, no interference with the retention time of either of the analytes was observed, nor was interference detected from the combination of ivacaftor, ivacaftor-M1, ivacaftor-M6, tezacaftor, and elexacaftor. After each injection the LC column was washed for another 2.5 min with 90% acetonitrile and the equilibrated to starting conditions (20% acetonitrile). The total running time per sample is 5.5 min, which is of great interest for diagnostic centers analyzing large amounts of samples.
Figure 2.

MRM spectra of fragmentation behavior of (A) ivacaftor, (B) ivacaftor-M1, (C) ivacaftor-M6, (D) tezacaftor, and (E) elexacaftor.
Sample Preparation
In our previous HPLC/LC-MS techniques we have reported a 1:1 preparation involving protein precipitation sample/[mixture of acetonitrile/0.1% formic acid].15 Given the large number of samples used in our studies, we observed protein precipitation after sample injection (data not shown). We aimed to eliminate unnecessary and time-consuming clean up steps by first precipitating proteins at a 1:2 ratio (sample/[mixture of acetonitrile/0.1% formic acid]) and second by starting the gradient at 70% acetonitrile (rather than 60% as per our previous method).
Accuracy and Linearity
As shown in Table 5 good accuracy (90.62–94.51%) was observed within the linear range of 0.0025–1 μg/mL for ivacaftor, ivacaftor-M1, ivacaftor-M6, tezacaftor, and elexacaftor and using area ratio in the respective calibration curves (Figure 2). Linear fit with 1/A2 weighting factor was employed for all four target components. Good fit to these four models were observed as represented by the correlation coefficients (R2 = 0.98–0.99). As shown in Figure 2 and Table 5, good reproducibility (interday 99.91–100%) was observed within the linear range of 0.0025–1 μg/mL for ivacaftor, ivacaftor-M1, ivacaftor-M6, tezacaftor, and elexacaftor. Accuracy and precision were calculated via relative standard deviation (RSD). For each quality control, the RSD values should be less than 15%.27 For this analytical method, a 1/C2 linear equation as the weighing factor was chosen to achieve a linear regression; the linear equations were as follows: ivacaftor (y = 5.82353 × 10+006X – 121 332; R2 = 0.9865105; r = 0.9932323), ivacaftor-M1 (y = 53 247.6X – 1852.08; R2 = 0.9852684; r = 0.9926069), ivacaftor-M6 (y = 1.56849 × 10+006 – 9 478.85; R2 = 0.9911764; r = 0.9955784), tezacaftor (y = 1.63653 × 10006x – 53 488.3; R2 = 0.98742470; r = 0.9936936), and elexacaftor (y = 922 226X – 7193.9; R2 = 0.9962137; r = 0.9981051). Good fit to this model was observed as represented by the correlation coefficient R2 > 0.98–0.99.
Limit of Quantification
In all blank plasma samples, no interference with the retention time of either of the analytes was observed, nor was interference detected from the combination of ivacaftor with tezacaftor with or without elexacaftor. The method used to determine the endogenous interferences was the percentage of the area of the lower limit of detection (LOD) for each analyte. The LOD and quantification (LOQ) were established: for ivacaftor, LOD 8.46 × 10–03 μg/mL and LOQ 2.82 × 10–02 μg/mL; for ivacaftor-M1, LOD 2.54 × 10–02 μg/mL and LOQ 8.46 × 10–02 μg/mL; for ivacaftor-M6, LOD 2.27 × 10–02 μg/mL and LOQ 7.58 × 10–02 μg/mL; for tezacaftor, LOD 1.80 × 10–02 μg/mL and LOQ 6.00 × 10–02 μg/mL; and for elexacaftor, LOD 7.40 × 10–03 μg/mL and LOQ 2.47 × 10–02 μg/mL (Table 5).
Precision
In this study, the precision of our analytical procedure was expressed as RSD or coefficient of variation of a series of measurements. The relative standard deviation was calculated by taking the standard deviation of the sample set multiplied by 100% and dividing it by the sample set average. The relative standard deviation is expressed as percent:
with s being the standard deviation and x the average of the three independent measurements.
To confirm the precision, the predicted %RSD has to be compared with the experimental %RSD, as follows:
% RSD theoretical = 2 exp (1–0.5 log C), with C being the real concentration of the sample
Good interday precision: %RSD exp ≤ %RSD theoretical
Good intraday precision: %RSD exp ≤ %RSD theoretical/2
Intraday repeatability was below 1% RSD for all four compounds ivacaftor, ivacaftor-M1, ivacaftor-M6, and tezacaftor at 1 μg/mL (quality control level, n = 6). Interday variability was determined on 3 different days and was below 8.16%RSD for ivacaftor and tezacaftor at low concentrations (0.1 μg/mL) and below 5.4%RSD at 1 μg/mL (Table 5), indicating good precision.
Recovery from Plasma
The combination of acetonitrile/0.1% formic acid provided optimal protein precipitation and excellent recovery of all five analytes from the plasma matrix. Recovery was 78.21% for ivacaftor, 84.20% for ivacaftor-M1, 101.52% for ivacaftor-M6, 94.22% for tezacaftor, and 111.93% for elexacaftor, respectively, indicating that all five analytes could be quantitatively recovered from plasma. The relative recovery of ivacaftor, ivacaftor-M1, ivacaftor-M6, and tezacaftor was calculated by comparing the peak areas of the samples prepared in human plasma with those obtained from a set of quality control samples prepared in methanol. High recoveries of all five analytes were observed and are in line with our previously reported recoveries for ivacaftor and its metabolites (Table 5).
Discussion
Herein, we describe a rapid, simple, and sensitive methodology to allow the high-throughput MRM-MS analysis of plasma samples measuring ivacaftor, ivacaftor-M1, ivacaftor-M6, tezacaftor, and elexacaftor concentrations in CF patients receiving ivacaftor–tezacaftor or ivacaftor–tezacaftor–elexacaftor combination therapy. The analysis time is reduced to 5.5 min, and the sample preparation is straightforward and time efficient. These methodological changes allow a state-of-the-art use for the changing landscape in CF therapy as well as processing a large number of samples which are used in hospital setting or required for clinical trials. MRM-MS methods have in the past been used as a biomarker tool in the context of CF diagnostics. Roberts et al. have used MRM-MS to identify novel plasma protein biomarkers in response to CF lung exacerbations.25 Quon et al. have used MRM-MS to predict imminent CF pulmonary exacerbations by quantifying novel plasma protein biomarkers.24
We have previously reported analytical methods for the quantification of ivacaftor–lumacaftor patient samples; however, with standard treatment regimens shifting, we must adapt and optimize the reported methods. Although Singh et al. have recently reported a HPLC method for the quantification of tezacaftor and ivacaftor, our method herein allows for a faster and low-dose high-throughput analysis with the inclusion of important active and partially metabolites as well as the inclusion of the novel triple combination.28 Targeted method MRM-MS analysis such as the method described herein requires knowledge of the molecular weight of the analytes and their fragmentation behavior: ivacaftor 393 > 337 > 172 > 319 m/z, ivacaftor-M1 408.5 > 353 > 172 > 335.1 m/z, ivacaftor-M6 423 > 367 > 349 m/z, tezacaftor 521.1 > 440 > 130.9 > 222.9 m/z and elexacaftor 597.7 > 422 > 205 > 329 m/z under collision-induced dissociation (CID) conditions (Tables 3 and 4). By combining carefully selected MRM precursor and fragment ion pairs, MRM can be used to determine, highly specifically and reproducibly, the absolute concentrations of ivacaftor and its metabolites, tezacaftor, and elexacaftor in biological samples. The concentrations of the analyte fragments can be used to infer the concentrations of the precursor compounds.22
In summary, we have demonstrated for the first time that MRM-MS can be applied as a biomarker tool to quantify concentrations of ivacaftor and tezacaftor and elexacaftor in CF. MRM-MS is a platform that has been used in clinical diagnostic laboratories to measure drugs and their metabolites, but to date no assays have been reported for the monitoring of ivacaftor–tezacaftor combination. Given that drug monitoring may be essential in certain cohorts, e.g., CF patients with severe liver impairment, pregnant women, or poor responders to CFTR modulator treatment, therapeutic drug monitoring in patient plasma is requisite to achieve optimizing dosage regimens and allow pharmacokinetic/pharmacodynamic analyses. The deployment of this simple yet sensitive assay in the hospital setting will offer clinicians the rationale to develop exposure–response relationships, to aid with the development and understanding of predictive biomarkers, and to achieve the best possible clinical efficacy. Further research will include clinical validation and evaluation for a clinical utility study.
Conclusion
This rapid and sensitive methodology allows for the high-throughput MRM-MS analysis of plasma samples from patient with CF receiving ivacaftor–tezacaftor or ivacaftor–tezacaftor–elexacaftor combination therapy. Our methodological adaptions allow for a large number of patient samples which are required for clinical trials including dose-finding studies, pharmacokinetic/pharmacodynamic analysis, or the routine hospital screening. A simple and minimally invasive plasma test can be applied to mitigate potential drug interactions.
Acknowledgments
We thank the patients who donated their time and contributed to our study and Joseph Pelle (HMST Lab, Monash Institute of Pharmaceutical Sciences) for his help with the mass spectrometer.
Author Contributions
F.R.-O., F.Q., and E.K.S.-F. were involved in the conception and design, analysis and interpretation of the data and the drafting of the paper or revising it critically for intellectual content and are responsible for the final approval of the version to be published. All authors agree to be accountable for all aspects of the work.
E.K.S.-F. is supported by a research grant from The University of Melbourne and the Australian National Health and Medical Research Council (NHMRC) as Biomedical Research Fellow. Portions of this work were supported by the Peter Phelan grant from the Thoracic Society of Australia and New Zealand. The content is solely the responsibility of the authors and does not necessarily represent the official views of the Australian National Health and Medical Research Council.
The authors declare no competing financial interest.
References
- Taylor-Cousar J. L.; Munck A.; McKone E. F.; van der Ent C. K.; Moeller A.; Simard C.; Wang L. T.; Ingenito E. P.; McKee C.; Lu Y.; Lekstrom-Himes J.; Elborn J. S. (2017) Tezacaftor-Ivacaftor in Patients with Cystic Fibrosis Homozygous for Phe508del. N. Engl. J. Med. 377 (21), 2013–2023. 10.1056/NEJMoa1709846. [DOI] [PubMed] [Google Scholar]
- Schneider E. K.; Reyes-Ortega F.; Li J.; Velkov T. (2017) Can. Cystic Fibrosis Patients Finally Catch a Breath With Lumacaftor/Ivacaftor?. Clin. Pharmacol. Ther. 101 (1), 130–141. 10.1002/cpt.548. [DOI] [PMC free article] [PubMed] [Google Scholar]
- Schneider-Futschik E. K. (2019) Beyond cystic fibrosis transmembrane conductance regulator therapy: a perspective on gene therapy and small molecule treatment for cystic fibrosis. Gene Ther. 26 (9), 354–362. 10.1038/s41434-019-0092-5. [DOI] [PubMed] [Google Scholar]
- Qiu F., Habgood M., and Schneider-Futschik E. K. (2020) The balance between the safety of mother, fetus and newborn undergoing cystic fibrosis transmembrane conductance regulator treatments during pregnancy. ACS Pharmacol. Transl. Sci. 10.1021/acsptsci.0c00098. [DOI] [PMC free article] [PubMed] [Google Scholar]
- Rowe S. M.; McColley S. A.; Rietschel E.; Li X.; Bell S. C.; Konstan M. W.; Marigowda G.; Waltz D.; Boyle M. P.; Group V. X. S. (2017) Lumacaftor/Ivacaftor Treatment of Patients with Cystic Fibrosis Heterozygous for F508del-CFTR. Ann. Am. Thorac Soc. 14 (2), 213–219. 10.1513/AnnalsATS.201609-689OC. [DOI] [PMC free article] [PubMed] [Google Scholar]
- Rowe S. M.; Daines C.; Ringshausen F. C.; Kerem E.; Wilson J.; Tullis E.; Nair N.; Simard C.; Han L.; Ingenito E. P.; McKee C.; Lekstrom-Himes J.; Davies J. C. (2017) Tezacaftor-Ivacaftor in Residual-Function Heterozygotes with Cystic Fibrosis. N. Engl. J. Med. 377 (21), 2024–2035. 10.1056/NEJMoa1709847. [DOI] [PMC free article] [PubMed] [Google Scholar]
- Donaldson S. H.; Pilewski J. M.; Griese M.; Cooke J.; Viswanathan L.; Tullis E.; Davies J. C.; Lekstrom-Himes J. A.; Wang L. T. (2018) Tezacaftor/Ivacaftor in Subjects with Cystic Fibrosis and F508del/F508del-CFTR or F508del/G551D-CFTR. Am. J. Respir. Crit. Care Med. 197 (2), 214–224. 10.1164/rccm.201704-0717OC. [DOI] [PMC free article] [PubMed] [Google Scholar]
- Paulin O., and Schneider-Futschik E. (2020) Treatment challenges associated with drug-drug interactions in cystic fibrosis, in Optimizing Pharmaceutical Treatment in Cystic Fibrosis, ECFS, Karup, Denmark. [Google Scholar]
- Keating D.; Marigowda G.; Burr L.; Daines C.; Mall M. A.; McKone E. F.; Ramsey B. W.; Rowe S. M.; Sass L. A.; Tullis E.; et al. (2018) VX-445-Tezacaftor-Ivacaftor in Patients with Cystic Fibrosis and One or Two Phe508del Alleles. N. Engl. J. Med. 379 (17), 1612–1620. 10.1056/NEJMoa1807120. [DOI] [PMC free article] [PubMed] [Google Scholar]
- Ghelani D. P.; Schneider-Futschik E. K. (2020) Emerging Cystic Fibrosis Transmembrane Conductance Regulator Modulators as New Drugs for Cystic Fibrosis: A Portrait of in Vitro Pharmacology and Clinical Translation. ACS Pharmacol Transl Sci. 3 (1), 4–10. 10.1021/acsptsci.9b00060. [DOI] [PMC free article] [PubMed] [Google Scholar]
- Middleton P. G.; Mall M. A.; Drevinek P.; Lands L. C.; McKone E. F.; Polineni D.; Ramsey B. W.; Taylor-Cousar J. L.; Tullis E.; Vermeulen F. (2019) Elexacaftor-Tezacaftor-Ivacaftor for Cystic Fibrosis with a Single Phe508del Allele. N. Engl. J. Med. 381 (19), 1809–1819. 10.1056/NEJMoa1908639. [DOI] [PMC free article] [PubMed] [Google Scholar]
- Tan M.; Reyes-Ortega F.; Schneider-Futschik E. (2020) Successes and Challenges: Inhaled Treatment Approaches Using Magnetic Nanoparticles in Cystic Fibrosis. MDPI Magnetochemistry 6 (2), 25. 10.3390/magnetochemistry6020025. [DOI] [Google Scholar]
- Committee for Medicinal Products for Human Use . (2015) Assessment Report: Orkambi (Ivacaftor/Lumacaftor), Report No. EMEA/H/C/003954/0000, European Medicines Agency, London.
- Donaldson S. H.; Pilewski J. M.; Griese M.; Cooke J.; Viswanathan L.; Tullis E.; Davies J. C.; Lekstrom-Himes J. A.; Wang L. T. (2018) Tezacaftor/ivacaftor in subjects with cystic fibrosis and F508del/F508del-CFTR or F508del/G551D-CFTR. Am. J. Respir. Crit. Care Med. 197 (2), 214–224. 10.1164/rccm.201704-0717OC. [DOI] [PMC free article] [PubMed] [Google Scholar]
- Schneider E. K.; Reyes-Ortega F.; Wilson J. W.; Kotsimbos T.; Keating D.; Li J.; Velkov T. (2016) Development of HPLC and LC-MS/MS methods for the analysis of ivacaftor, its major metabolites and lumacaftor in plasma and sputum of cystic fibrosis patients treated with ORKAMBI or KALYDECO. J. Chromatogr. B: Anal. Technol. Biomed. Life Sci. 1038, 57–62. 10.1016/j.jchromb.2016.10.026. [DOI] [PMC free article] [PubMed] [Google Scholar]
- Schneider E. K.; Reyes-Ortega F.; Li J.; Velkov T. (2017) Optimized LC-MS/MS Method for the High-throughput Analysis of Clinical Samples of Ivacaftor, Its Major Metabolites, and Lumacaftor in Biological Fluids of Cystic Fibrosis Patients. J. Visualized Exp. (128), 56084. 10.3791/56084. [DOI] [PMC free article] [PubMed] [Google Scholar]
- Hanafin P., Sermet-Gaudelus I., Griese M., Kappler M., Ellemunter H., Schwarz C., Wilson J., Velkov T., Rao G., and Schneider-Futschik E. (2020) Insights into the pharmacokinetic interactions between ivacaftor and lumacaftor in cystic fibrosis, currently under review. [Google Scholar]
- Hanafin P.; Rao G. G.; Schneider-Futschik E. (2020) WS19.3 Bidirectional pharmacokinetic interactions between ivacaftor and lumacaftor. J. Cystic Fibrosis 19, S32. 10.1016/S1569-1993(20)30266-6. [DOI] [Google Scholar]
- Masson A.; Schneider-Futschik E. K.; Baatallah N.; Nguyen-Khoa T.; Girodon E.; Hatton A.; Flament T.; Le Bourgeois M.; Chedevergne F.; Bailly C.; Kyrilli S.; Achimastos D.; Hinzpeter A.; Edelman A.; Sermet-Gaudelus I. (2019) Predictive factors for lumacaftor/ivacaftor clinical response. J. Cystic Fibrosis 18 (3), 368–374. 10.1016/j.jcf.2018.12.011. [DOI] [PubMed] [Google Scholar]
- Lim A., Balouch F., Cheney J., Lewindon P., Roberts J., Schneider-Futschik E., and Shevill Wainwright C. (2020) Orkambi in Patients with Cystic Fibrosis and Severe Liver Disease, in Annual Scientific Meeting, Transplantation Society of Australia and New Zealand, Melbourne, Victoria, Australia, Abstract No. TP 092.
- Kuzyk M. A.; Parker C. E.; Domanski D.; Borchers C. H. (2013) Development of MRM-based assays for the absolute quantitation of plasma proteins. Methods Mol. Biol. 1023, 53–82. 10.1007/978-1-4614-7209-4_4. [DOI] [PubMed] [Google Scholar]
- Hammad L. A.; Saleh M. M.; Novotny M. V.; Mechref Y. (2009) Multiple-reaction monitoring liquid chromatography mass spectrometry for monosaccharide compositional analysis of glycoproteins. J. Am. Soc. Mass Spectrom. 20 (6), 1224–34. 10.1016/j.jasms.2009.02.022. [DOI] [PubMed] [Google Scholar]
- Quon B. S.; Dai D. L.; Hollander Z.; Ng R. T.; Tebbutt S. J.; Man S. F.; Wilcox P. G.; Sin D. D. (2016) Discovery of novel plasma protein biomarkers to predict imminent cystic fibrosis pulmonary exacerbations using multiple reaction monitoring mass spectrometry. Thorax 71 (3), 216–22. 10.1136/thoraxjnl-2014-206710. [DOI] [PubMed] [Google Scholar]
- Roberts J. M.; Dai D. L. Y.; Hollander Z.; Ng R. T.; Tebbutt S. J.; Wilcox P. G.; Sin D. D.; Quon B. S. (2018) Multiple reaction monitoring mass spectrometry to identify novel plasma protein biomarkers of treatment response in cystic fibrosis pulmonary exacerbations. J. Cystic Fibrosis 17 (3), 333–340. 10.1016/j.jcf.2017.10.013. [DOI] [PubMed] [Google Scholar]
- Center for Drug Evaluation and Research . (2001) Bioanalytical Method Validation: Guidance for Industry, U.S. Department of Health and Human Services, Food and Drug Administration, Silver Spring, MD.
- Su Q.; Li J.; Ji X.; Li J.; Zhou T.; Lu W.; Li L. (2015) An LC-MS/MS method for the quantitation of cabozantinib in rat plasma: application to a pharmacokinetic study. J. Chromatogr. B: Anal. Technol. Biomed. Life Sci. 985, 119–23. 10.1016/j.jchromb.2015.01.024. [DOI] [PubMed] [Google Scholar]
- Singh N.; Bansal P.; Maithani M.; Chauhan Y. (2020) Development and Validation of a Novel Stability-Indicating RP-HPLC Method for Simultaneous Determination of Tezacaftor and Ivacaftor in Fixed Dose Combination. J. Chromatogr. Sci. 58 (4), 346–354. 10.1093/chromsci/bmz120. [DOI] [PubMed] [Google Scholar]
- Committee for Medicinal Products for Human Use . (2019) Assessment Report: Symkevi, Report No. EMEA/H/C/004682/0000, European Medicines Agency, London.