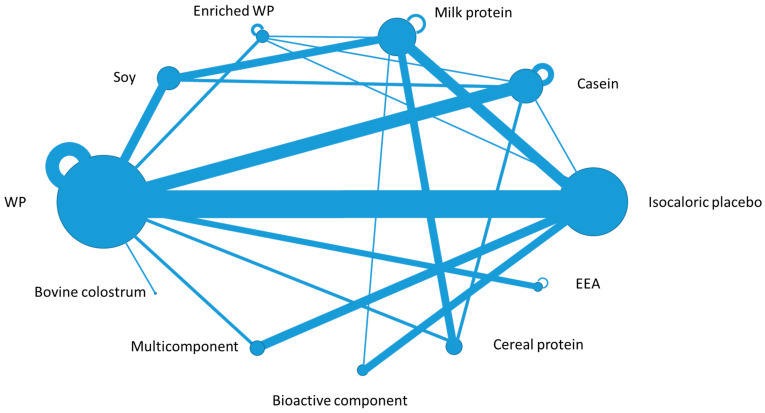
Figure 2.
The network plot of the 11 intervention arms included in the randomized clinical trials (82 studies). The intervention arms are coded in the plot as nodes: each node size is proportional to the number of direct comparisons involving each intervention. The 20 lines between nodes represent direct comparisons driven by the trials; the line thickness is proportional to the number of studies where the direct comparison was performed. The additional semicircles over five nodes represent comparisons of different dosages within the same intervention (WP: Whey Proteins, EEA: Essential Amino Acids).

