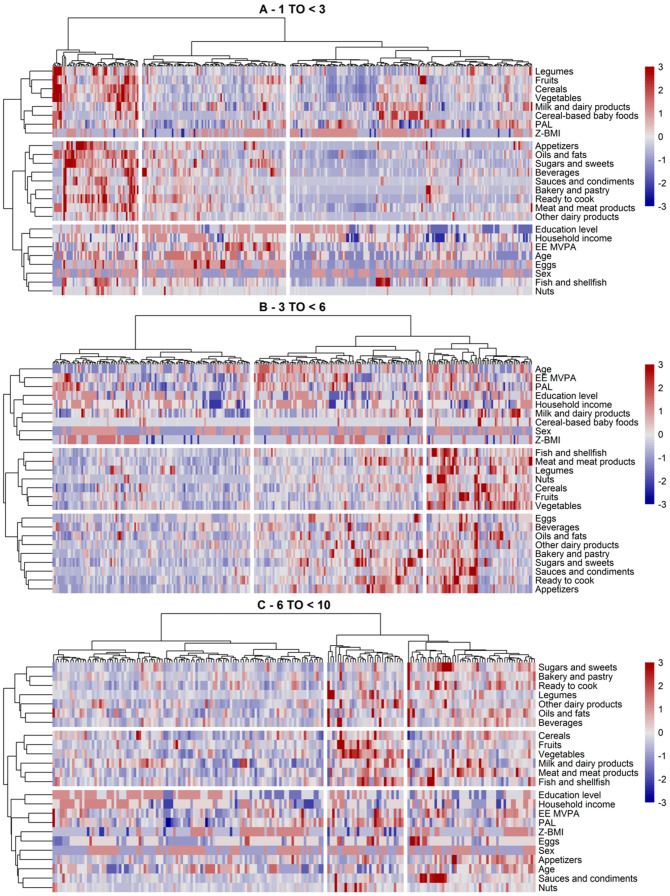
Figure 4.
Clusters of subjects and dietary/lifestyle variables identified via hierarchical clustering in the AMS by age group ((A) 1–3 years, (B) 3–6 years, (C) 6 to <10 years) in the Nutritional Study in Spanish Pediatric Population (EsNuPI) (n = 772). The clusters are visually separated by longitudinal marks on vertical and horizontal faces (clusters of subjects or dietary/lifestyle variables, respectively). The vertical and horizontal dendrograms denote the relationship between the clusters, i.e., similar observations. The color bar refers to levels above (red) or below (blue) the mean intake of dietary variable or mean scores of lifestyle variables. Increased color intensities indicate larger differences around the mean. Abbreviations: EE MVPA, energy expenditure moderate and vigorous physical activity; PAL, physical activity level; Z-BMI-for-age, body mass index for age z-score.

