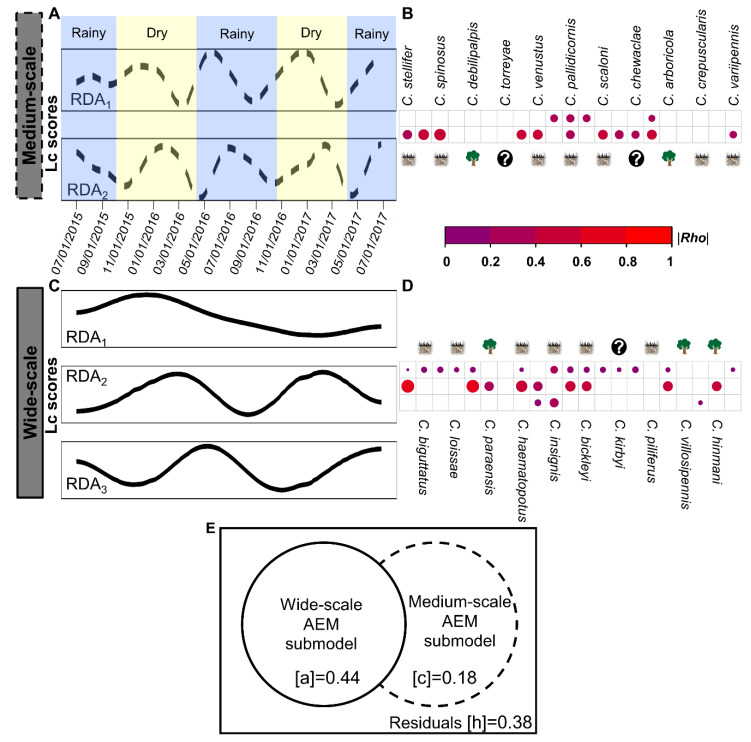
Figure 2.
Temporal scales behind Culicoides assembling pattern: the changes in species composition followed annual and biannual temporal profiles. (A,C) Panels describe the weekly oscillation in the community composition by each significant AEM temporal submodel and the nonoverlapping structures within them. Table S1.1 summarizes temporal scales and their week range, AEMs and statistical significance. The x-axis is shared between panels (A,C). Panel A also shows the rainy (light blue) and dry (light yellow) seasons in Florida. (B,D) Panels indicate compromised species for the changing composition at each temporal profile (RDA) after Spearman rank correlation. Only significant |Rho| showed where size and color followed the magnitude of the species-temporal structure association (Table S1.2). Larval habitat traits are indicated as wet soils and tree holes with shapes. The question mark indicates those species where the larval habitat was not described. Panel (E): Venn diagram represents the amount of variation in the community change composition at each temporal scale by hierarchical variance partitioning. Fractions were described in Culicoides β-diversity temporal profile section and their R2adj printed.

