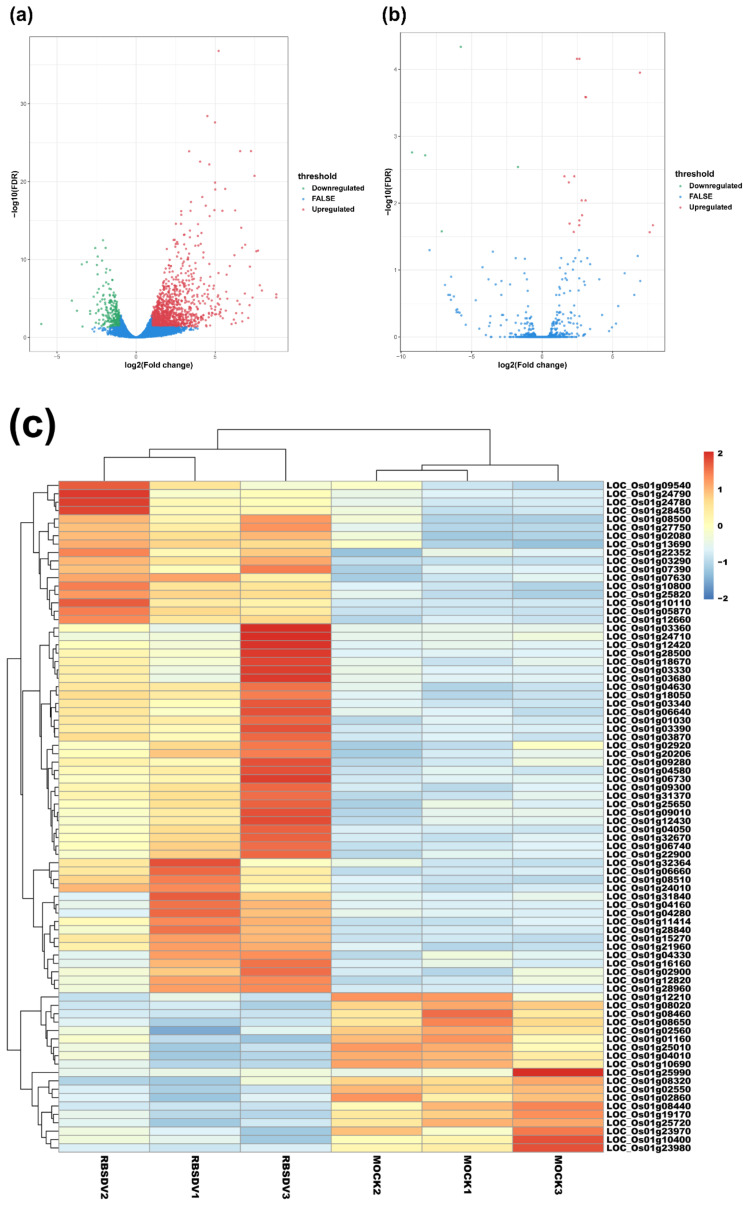
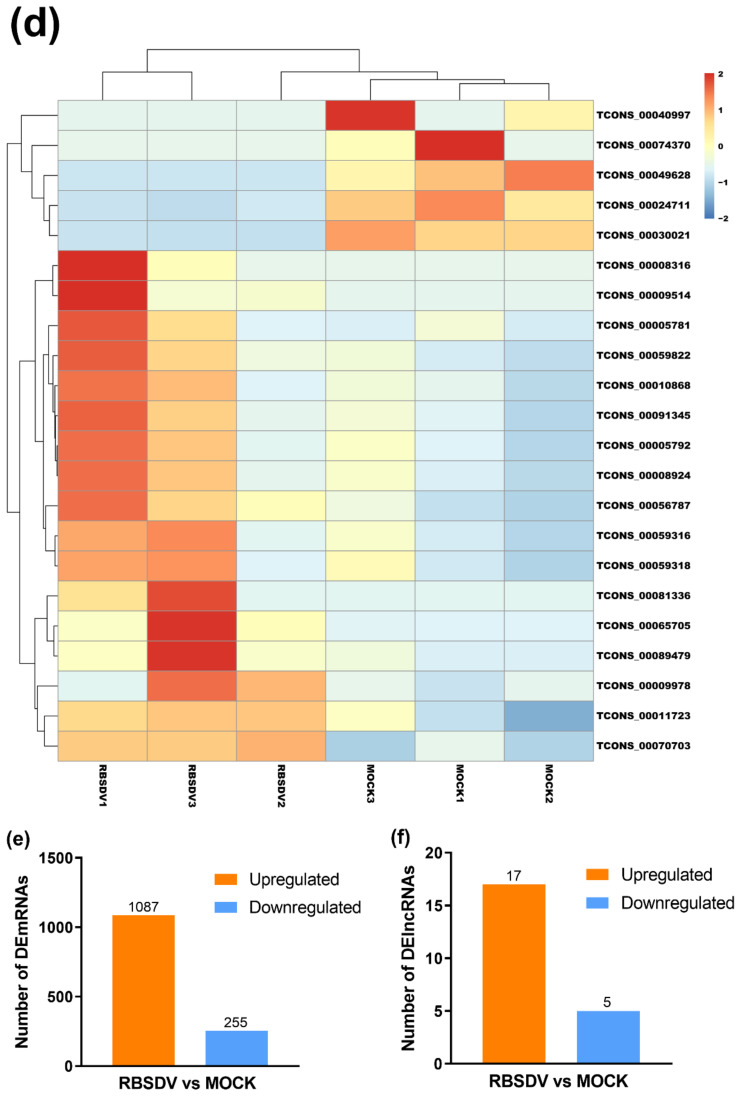
Figure 1.
Volcano maps and hierarchical clustering analysis show expression profiles of mRNAs and lncRNAs of RBSDV-infected and mock rice plants. Volcano maps show mRNA expression (a) and lncRNA expression (b) with fold change ≥ 2.0 and false discovery rate (FDR) < 0.05. Red dots represent upregulated genes, and green dots represent downregulated genes in volcano maps. The heatmaps show significantly expressed mRNAs (c) and lncRNAs (d) with fold change ≥ 2.0 and FDR < 0.05. The right panel is the color key for fold-change. Red represents upregulation, blue represents downregulation, the brighter image is the greater the fold change; (e,f) the number of mRNAs or lncRNAs whose expression significantly changed are shown.


