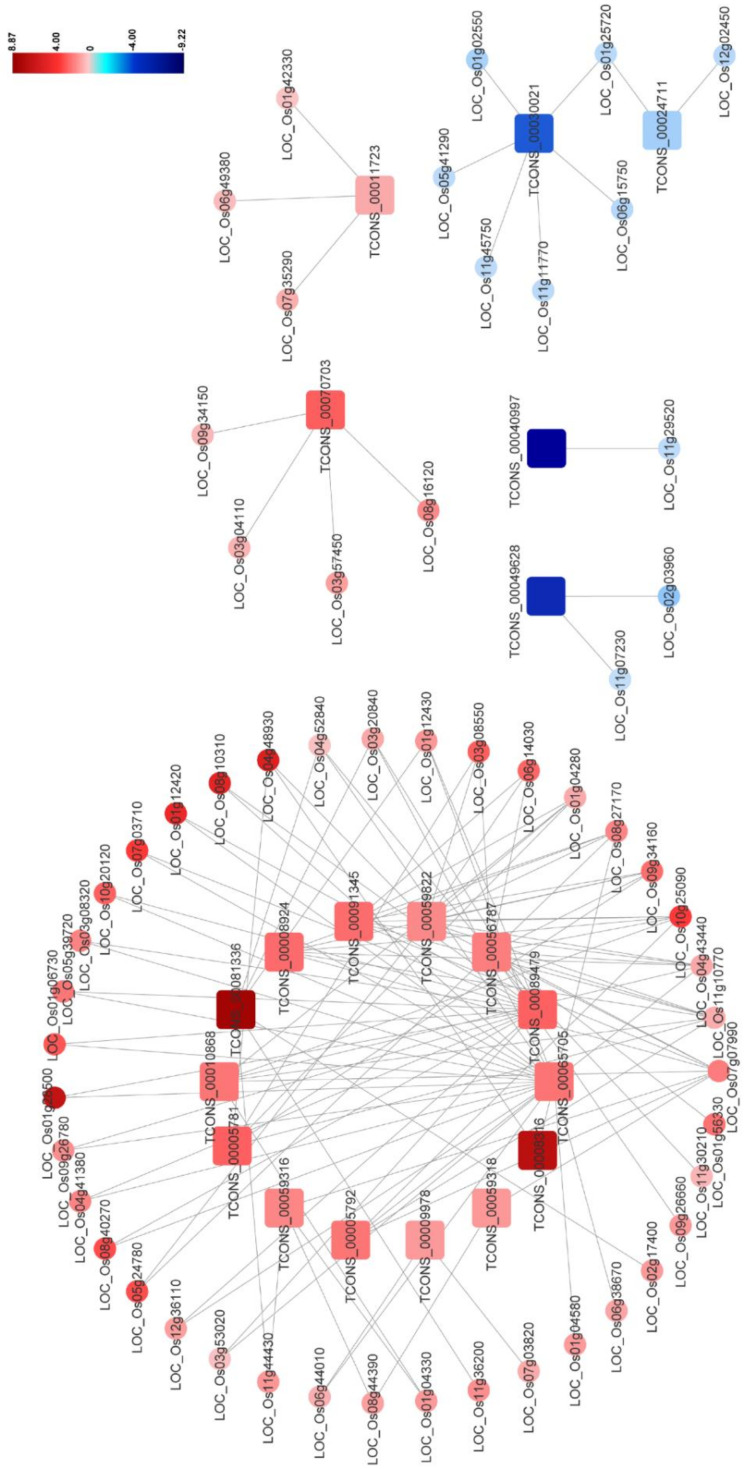
Figure 6.
The network for the predicted DElncRNA–DEmRNA co-expression pairs potentially involved in plant–pathogen interaction (Pathway ID:ko004626). The square represents DElncRNA and the circle represents DEmRNA. Red indicates upregulation and blue indicates downregulation. The brighter image is the greater fold change. Each selected pair is with a person’s correlation coefficient > 0.95 or < −0.95. Identitiess of DElncRNAs and DEmRNAs are shown in the figure.

