

Abstract
Understanding polymorphism in chiral systems for drug manufacturing is essential to avoid undesired therapeutic effects. Generally, polymorphism is studied through changes in temperature and solution concentration. A less common approach is the application of pressure. The goal of this work is to investigate the effect of pressure on levetiracetam (pure enantiomer) and etiracetam (racemic compound). Anisotropic compressions of levetiracetam and etiracetam are observed to 5.26 and 6.29 GPa, respectively. The most compressible direction for both was identified to be perpendicular to the layers of the structure. Raman spectroscopy and an analysis of intermolecular interactions suggest subtle phase transitions in levetiracetam (∼2 GPa) and etiracetam (∼1.5 GPa). The stability of etiracetam increases with respect to levetiracetam on compression; hence, the chiral resolution of this system is unfavorable using pressure. This work contributes to the ongoing efforts in understanding the stability of chiral systems.
Short abstract
The effect of pressure on the chiral and racemic crystals of 2-(2-oxo-1-pyrrolidinyl)butyramide was performed using Raman and single-crystal X-ray diffraction measurements. Potential subtle phase transitions to new high-pressure phases in each crystal form were observed with the support of computational approaches.
Introduction
Polymorphism is the ability of a chemical compound to exist in more than one crystalline form.1 This phenomenon plays an important role in the development of new drugs due to a possible modification of physicochemical properties in active pharmaceutical ingredients (APIs): e.g., solubility, processing behavior, and bioavailability.2,3 Polymorphism can also be found in chiral compounds, which are more than 50% of the active pharmaceutical compounds currently in the market.4 Chirality is identified when a chemical compound exhibits two nonsuperimposable mirror-image conformers (enantiomers). In Nature, only the single-enantiomer forms are observed: for example, natural amino acids and natural sugars. In contrast, racemic compounds are the main products of synthesis and extra separation techniques are necessary to obtain the pure enantiomer.5 The physicochemical properties of the two enantiomers are identical; however, their optical activities are opposite and their different conformations can lead to different physiological responses, hence enantiopure API crystal forms are selected preferentially for manufacture.4,6−8
Crystallization can be a highly selective separation technique, even for compounds as similar as enantiomers. Usually, crystallization is initiated by varying parameters such as solvent, temperature, and humidity; the thermodynamic parameter pressure has been rarely explored. To the best of our knowledge, combined studies of pure and racemic compounds at high pressure have only been reported for amino acids,9−13 and more recently, the enantiomers of mandelic acid14−16 and 1,1′-binaphthyl17 were explored to design pressure–temperature spontaneous resolution. The resolution of mandelic acid has been challenged using single-crystal X-ray diffraction, attributing the structural transformation at 0.65 GPa to a phase transition from form I to form II of dl-mandelic acid.15,16
In this work, we explore the structural features of the RS and S forms of 2-(2-oxo-1-pyrrolidinyl)butyramide. Our inspiration to investigate this system was the extensive polymorphic behavior of piracetam (2-oxopyrrolidineacetamide, an analogous compound without the ethyl group).18,19 It possesses three polymorphic forms at atmospheric pressure and two high-pressure forms as well as two hydrates.20−25 2-(2-Oxo-1-pyrrolidinyl)butyramide crystallizes in two racemic polymorphs at atmospheric pressure (etiracetam, Eti).26 Form I (monoclinic, P21/c) is stable below 303.5 K, and form II (monoclinic, P21/c) is formed via a suspension of form I in methanol above 313 K. In contrast, despite several crystallization attempts, only one crystalline structure has been reported for the enantiopure S form, levetiracetam (Lev).27,28 Given the extensive crystallization behavior of piracetam, it is possible that Lev and Eti show equally rich diagrams at high pressure.
The aim of this study is to investigate how the chirality of the material influences the compression of these systems and to identify whether pressure can be used as a tool for their enantiomeric separation. First, we explored the structures at ambient pressure using Raman spectroscopy to identify pressure points at which potential phase transitions might occur. Then, we have followed these studies with X-ray diffraction measurements to gain insight into the changes to the molecular and crystal structure as a function of pressure. Crystal energy calculations using CrystalExplorer have been used to provide intermolecular interaction energies and relate these to the phase transitions that occur in both crystal forms.
Experimental Procedure
Materials
Lev and Eti were purchased from Xiamen Top Health Biochem Tech. Co., Ltd. Both samples were recrystallized by cooling crystallization in ethyl acetate solvent (Sigma-Aldrich) followed by fast solvent evaporation, where a drop of saturated solution was placed on a microscopic slide.
Diamond Anvil Cell (DAC) Preparation
A Merrill–Bassett diamond anvil cell (DAC) equipped with a 600 μm culet was used to generate pressure.29 Tungsten foil (200 μm) was indented to a thickness of 100 μm, and a 250 μm hole was drilled in the center of indented gasket using an Almax Easylab Microdriller. Four samples were loaded individually into the DAC: (i) a powder of Lev, (ii) a single crystal of Lev, (iii) a powder of Eti form I, and (iv) a single crystal of Eti. In each cell, a ruby was loaded into the cell for pressure measurement by the ruby-fluorescence method.30 In all experiments, petroleum ether 35/60 (Alfa Aesar) was used as the pressure-transmitting medium. In the case of Lev, three samples were loaded with single crystals to verify the compression of the structure using unit cell information. In Figure 6, the data points for these crystals are highlighted by the same symbol but with different filling e.g. open, closed, and half-closed.
Figure 6.

X-ray diffraction compression data of (a–c) Lev and (d–f) Eti: (a, d) unit cell axis; (b, e) variation of the β angle; (c, f) volume fitted to the third-order Birch–Murnaghan equation of state for Lev and third-order Murnaghan equation of state for Eti. The compression of LEV was performed using three crystals illustrated by solid symbols (crystal 1), open symbols (crystal 2) and right half solid symbols (crystal 3) in compression data of (a) the unit cell axis and by different shapes of symbols in the (b) variation of the β angle and (c) volume: squares in crystal 1, circles in crystal 2, and triangles in crystal 3.
Raman Spectroscopy
Raman spectra of Lev and Eti samples loaded into the DAC were collected using a Horiba Jobin Yvon XploRA micro Raman system using a 532 nm laser line with a 1200 lines/mm grating and CCD detector. An Olympus microscope coupled with a LWD 50× objective lens was used for visualization of the sample. The spectra were collected and analyzed using the LabSpec 6 program in the region between 50 and 3500 cm–1. Data collection times and parameters were varied to maximize the signal to noise ratio for each pressure.
Single-Crystal X-ray Diffraction
Single crystal X-ray diffraction data were collected with a Bruker Kappa Apex II Duo diffractometer using Mo Kα radiation (λ = 0.71073 Å) at 300 K. Diffraction data were acquired using the strategy developed by Dawson et al., adding the movement of the κ angle of −90 or 90°.31 In APEX 3,32 the data sets were integrated using SAINT33 with the dynamic mask procedure implemented in the program. Absorption correction was carried out using the SHADE program.34 The crystal structures were refined in Olex235 using SHELXL.36 The atomic coordinates were taken from the Cambridge Structural Database (CSD)37,38 and used as the starting model for the refinement of Lev (CSD recode OMIVUB27) and Eti form I (CSD refcode OFIQUR26). All non-hydrogen atoms were refined anisotropically with the use of the RIGU restraint.39 The hydrogen atoms were placed on the carbon atoms, except for those involved in hydrogen bonding, e.g. NH2, which were found from the difference map and allowed to optimize before a riding model was used as per the procedures in OLEX2. The Eti single-crystal data sets were collected at 0, 0.60, 0.80, 1.02, 1.24, 1.40, 1.90, 2.51, 2.98, 3.51, 3.95, 4.84, 5.51, and 6.29 GPa, and LEV single crystal data sets were collected at pressures of 0, 0.73, 1.29, 2,00, 2.71, 3.1, 3.67, 4.19, and 4.61 GPa. These data have been deposited with CSD with the numbers 2011949–2011966 and 2011968–2011970. To probe the potential phase transition, two further LEV crystals were collected at pressures of 1.20, 2.12, 2.68, 3.59, 3.81, and 4.83 GPa for unit cell information only. The crystallographic information can be found in Tables S1 and S2 in the Supporting Information.
Structure Analysis
The analysis of molecular and crystal structures was performed using the Mercury 4.1.3 software38 from the Cambridge Crystallographic Data Centre (CCDC). The software CrystalExplorer40 and PIXEL57−59 was used to understand the intermolecular interactions. The calculation of energy was performed between a central molecule and a cluster of molecules in a radius of 3.80 Å using the B3LYP/6-31G(d,p) method. The EoSFit7-GUI41 software was applied to obtain the equation of state (EoS) parameters from diffraction data collected as a function of varying pressure. The calculation of the strain tensor and compressibility indicatrix was performed using PASCal42 and visualized in VESTA 3.4.6.43
Results and Discussion
Structural Analysis of Levetiracetam and Etiracetam
In this study, we have investigated the structural changes that occur in 2-(2-oxopyrrolidin-1-yl)butyramide as a function of pressure. It can crystallize as a chirally pure crystal (Lev) or as a racemic crystal (Eti). Lev is the S enantiomer, and there is only one crystalline form known. Eti crystallizes in two polymorphic forms, but in this study, we have only characterized form I, as this is the most stable form at room temperature. The molecular structure has a chiral carbon that is linked to an ethyl group, an amide group (CNH2), and an oxopyrrolidine ring (O(py)) that adopts a half-chair conformation (Figure 1). The molecular conformation of each of the forms is altered due to the crystal packing, but the greatest difference observed is the torsional angle between the amide group and the oxopyrrolidine group (20°; Table 1). Torsion angles are relatively soft parameters; hence, there is the potential that these will show a large change on compression. Two metrics by which we can measure these changes as a function of pressure are the globularity and asphericity. These metrics are derived from Hirshfeld surfaces,44,45 where the crystalline electron distribution is divided into molecular fragments; thus, the surface is generated using both intermolecular and intramolecular interactions. Asphericity is a measure of molecular anisotropy, and globularity is the difference between the Hirshfeld surface area and the sphere area with the same volume. At ambient pressure, despite the different conformations, 2-(2-oxopyrrolidin-1-yl)butyramide in Lev and Eti has similar values for this parameter (asphericity, 0.033 and 0.032, respectively; globularity, 0.831 and 0.839, respectively).
Figure 1.
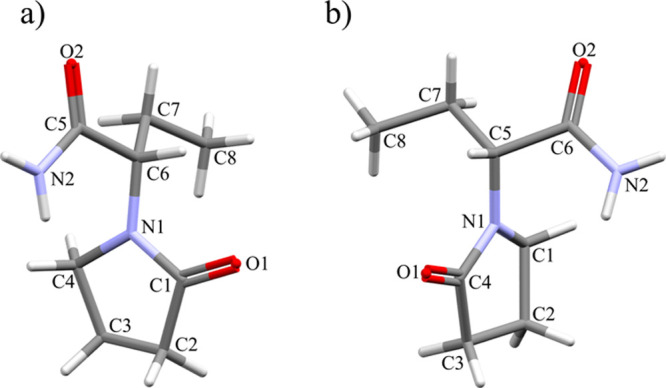
Molecular structures and numbering schemes for (a) the S enantiomer of Lev (chiral carbon C6) and (b) the R enantiomer present in the racemic compound Eti (chiral carbon C5) taken from reference structures deposited with the CSD (OMIVUB27 and OFIQUR26). It is not ideal that the numbering schemes are different in both compounds; however, to be consistent with the references we are following the CSD numbering schemes.
Table 1. Torsional Angles Taken from Reference Structures Deposited in the CSD (OMIVUB27 and OFIQUR26)a.
|
S enantiomer torsion angle in Lev
(deg) |
R enantiomer torsional angle in
Eti (deg) |
||
|---|---|---|---|
| C3–C4–N1–C6 | 163.9(4) | C2–C1–N1–C5 | 170.55(8) |
| O1–C1–N1–C6 | 6.0(6) | O1–C4–N1–C5 | –4.9(1) |
| N1–C6–C5–O2 | –166.9(3) | N1–C5–C6–O2 | 146.74(9) |
| N1–C6–C7–C8 | –54.5(5) | N1–C5–C7–C8 | 58.2(1) |
| C5–C6–C7–C8 | 176.4(4) | C6–C5–C7–C8 | –176.07(9) |
The information for the R enantiomer is taken from the molecule in the racemic crystal; hence, all values would be inverted for the S enantiomer.
Lev crystallizes in the monoclinic space group P21 with a single molecule of Lev in the asymmetric unit. At 293(2) K (CSD refcode OMIVUB), the unit cell parameters are a = 6.272(5) Å, b = 7.993(5) Å, c = 9.199(7) Å, β = 108.645(9)°, and V = 436.962 Å3, which gives a molecular volume of 218.5 Å3.27 In contrast, the crystal structure of Eti form I crystallizes in the centrosymmetric monoclinic space group P21/c with unit cell parameters a = 9.593(2) Å, b = 7.8325(3) Å, c = 11.9547(4) Å, β = 103.830(3)°, and V = 872.22 (5) Å3 at 293 K (CSD refcode OFIQUR).26 The molecular volume for Eti is 218.1 Å3; hence, there is no difference in molecular volumes between the chiral and racemic crystals.
The structure of Lev is organized through hydrogen bonds between the amide groups and the oxopyrrolidine group (N···O(py)′ 3.038(5) Å, NH···O(py)′ 156°) forming infinite chains through a 21 screw axis along the b direction (dark blue hydrogen bond in Figure 2a).27 The interaction between adjacent molecules in this chain is the strongest in the crystal (total −48.0 kJ mol–1; CrystalExplorer40). Following the same translation symmetry (light blue hydrogen bond in Figure 2a), a second chain is established through the amide groups (N···O(CNH2)′ 2.995(5) Å, NH···O(CNH2)′ 168°), where the energy of the interaction is also very strong (total −37.8 kJ mol–1). The combination of these two interactions forms rings of four molecules described by a R44(20) graph set (blue area in Figure 2a). This motif is propagated along the b direction by a 21 screw axis.
Figure 2.

Crystal structures of Lev and Eti. (a) The crystalline structure of Lev is formed through two infinite chains, NH···O(py) (in dark blue) and NH···O(CNH2) (in light blue) following the b direction. (b) The structure of Lev is packed through van der Waals interactions along the a-axis (view of two layers in the element colors and a green layer). (c) In Eti infinite enantiopure chains (S enantiomer (in element colors) and R enantiomer (in orange)) formed through NH···O(CNH2) hydrogen bonds (in dark blue); the chains are linked by NH···O(py) hydrogen bonds (in light blue), creating a centrosymmetric dimer. (d) In Eti chains are parallel to the (1 0 –1) plane and are linked by an inversion center. The stepped layers are depicted in green.
The molecular packing of Eti is constructed through a hydrogen bond between amide groups (NH···O(CNH2)′ 3.031(9) Å, NH···O(CNH2)′ 159(3)°) building enantiopure chains that lie parallel to the (1 0 –1) plane (dark blue in Figure 2c).26 It is interesting to observe that, despite Eti being racemic, each enantiomer forms a hydrogen bond chain with itself rather than with the other enantiomer. This hydrogen bond chain in Eti, constructed by the dark blue hydrogen bonds shown in Figure 2c, is comparable in geometry and hydrogen bond interaction energy (−32.7 kJ mol–1) to the hydrogen bond chain in Lev (−37.8 kJ mol–1), constructed by the light blue hydrogen bonds shown in Figure 2a. The difference in the structures lies in the relationship between the two chains and the hydrogen bonds between them. The chains in Eti are linked through the inversion center to form centrosymmetric dimers connected through a hydrogen bond between the secondary amide hydrogen and the oxopyrrolidine group (NH···O(py) 3.056(4) Å, NH···O(py)′ 166(1)°). Due to the dimer arrangement of counter enantiomer molecules consisting of two strong hydrogen bonds, the intermolecular interaction energy is −84.3 kJ mol–1.
Both Lev and Eti form layered structures Figure 2b,d) where strongly hydrogen-bonded layers are stacked through weaker van der Waals interactions. This type of structural feature is important, as previous high-pressure studies have shown that compression is generally observed in the direction perpendicular to the layers due to the lack of strong interactions.46,47 In Lev, the three-dimensional crystal structure is built through translation of the hydrogen-bonded layer along the a direction. The layers have a sawtooth profile when they are viewed along the b direction and interact through weaker van der Waals interactions (−11.6 to −17.1 kJ mol–1), where the energy is largely made of a dispersion component (Figure 2b). In Eti, the layer is not planar but shows a stepped motif, where the dimer interaction links the hydrogen-bonded chains together into the layer parallel to the (1 0 –1) plane (Figure 2d). Again, there are only van der Waals interactions between the layers but these interactions have a larger range of energies (−1.2 to −31.6 kJ mol–1).
Raman Spectroscopy Study of Levetiracetam and Etiracetam
Raman spectroscopy is a quick method to survey structural changes with respect to pressure. While it shows intramolecular vibrations, it can also provide information about the changes in structure through phonon regions of the spectrum. The Raman spectra of commercial Lev and Eti as well as the band assignments for Lev are shown in Figure 3. The band assignments for Lev were applied by following the literature values from the work of Ramya et al.;48 we have not found any assignments for Eti, but it can be assumed the assignments for the molecular vibrations will be similar. The frequencies for the bending of OCN (349 cm–1), the combination of torsional OCNCtors and bending of CCN (707 cm–1), and the stretching of N–H (3200–3367 cm–1) are important, since those reflect the molecular conformation induced by intramolecular and intermolecular interactions. These bands have the potential to allow us to understand the change during the compression process.
Figure 3.

Raman spectra of commercial (a) Lev and (b) Eti at atmospheric pressure.
For our pressure studies we used two different sample types to understand how the crystal structures of Lev and Eti are modified by increasing pressure: a polycrystalline powder and single crystals. There are three important factors when we analyze and compare these two experiments: hydrostaticity, particle size, and time frame. The main pressure-related difference between these two samples is the hydrostatic conditions inside the diamond anvil cell. The hydrostatic pressure, or lack thereof, can induce or inhibit phase transformations.49,50 Single-crystal experiments are generally hydrostatic, up to a hydrostatic limit of the pressure-transmitting medium, but quasi-hydrostatic for powder samples. The difference is due to compaction of the powder, where there are solid–solid interactions as well as solid–pressure-transmitting-medium interactions. The interaction of the solid with itself can induce strain and thus is only quasi-hydrostatic. Single-crystal samples are surrounded by a pressure-transmitting medium; hence, there are only crystal–pressure-transmitting-medium contacts limiting the strain imposed on the crystal. The particle size of the crystalline material and the time frame of the experiment can dictate the nucleation rate of a transformation; hence, kinetics can play a significant role.51 In this study, we collected the Raman spectra for powder sample over 1 day, while the single-crystal data were collected over the course of 32 days due to the concurrent X-ray diffraction experiments that were being performed. Therefore, we cannot rule out the effect of the two different time scales on the results obtained. Raman spectra of the powder and single-crystal samples of Lev and Eti are shown in Figures 4 and 5. The Raman spectra of the samples at increased pressure have slightly broader peaks than the Raman spectra at atmospheric pressure, which is a consequence of the stress applied to the sample. The increase in pressure induces a gradual shift of the vibrations below 3000 cm–1 toward higher wavenumbers (Figure 5a,b,d,e). The inverse trend is observed for the N–H stretching modes at approximately 3200 and 3367 cm–1, which progressively shift toward low wavenumbers (Figure 5c,f). In particular for Lev, the vibration at 345 cm–1 (CC stretch + OCN bend and CCC bend) (Figure 5a) presents a slight discontinuity in the trend for the powder sample at about 2 GPa, which is not observed for single crystals; in Figure 5a, the symbols at 1.25 and 2 GPa overlap and hence are depicted in different colors. This discontinuity is also observed for the OCNC torsion + CCN bend in Figure 5b. The characteristic of a powder sample is a high surface area and hence high surface energy, thereby increasing the possibility of a subtle transformation not detected for the single-crystal sample. No discontinuity is observed in the shift of the N–H stretch with either powder or single crystals.
Figure 4.

(a) Raman spectra of a powder sample of Lev during the compression to 5.26 GPa. The effect of pressure could be observed in several peaks such as at (green ●) ∼345 cm–1, (purple ▼) ∼690 cm–1, (blue ▼) ∼700 cm–1, and (brown ◆) ∼3360 cm–1. (b) Raman spectra of a single crystal of Eti during the compression to 6.29 GPa. The effect of pressure could be observed in several peaks such as at (blue and green ●) ∼345 cm–1, (green ▼) ∼700 cm–1, and (brown ◆) ∼3180 cm–1.
Figure 5.

(a–c) Evolution of the center position of a specific Raman peak for Lev at (green ●) ∼345 cm–1, (purple ▼) ∼690 cm–1, (blue ▼) ∼700 cm–1, and (brown ◆) ∼3360 cm–1.during compression to 5.26 GPa. The peaks are observed in Raman spectra of powder (solid symbols) and single-crystal samples (open symbols) upon compression of the samples. At 1.25 and 2.1 GPa the data points of the single crystal and powder overlap; hence, they are shown in a lighter color (light color symbols); (d–f) Evolution of the center position of a specific Raman peak for Eti at (blue and green ●) ∼345 cm–1, (green ▼) ∼700 cm–1, and (brown ◆) ∼3180 cm–1 during compression to 6.29 GPa.
As with Lev, we followed the compression of Eti form I using Raman spectroscopy and single-crystal X-ray diffraction from 0.60 to 6.29 GPa. Following the same approach used in the analysis of the vibrational spectra for Lev, three areas related to the hydrogen-bond interactions were investigated to understand the effect of pressure on the structure of Eti. Figure 5d illustrates the effect of pressure on the vibrational mode of the OCN bend. The frequency at 330 cm–1 shows a slight discontinuity above 2.0 GPa, and the NH2 stretch shows a change at 1.25 GPa (Figure 5f), indicating that there may be changes in structure at each of these points. These pressure zones were investigated carefully using X-ray diffraction with the goal of understanding if any structural modification was induced by pressure.
Single-Crystal X-ray Diffraction Study of Levetiracetam and Etiracetam
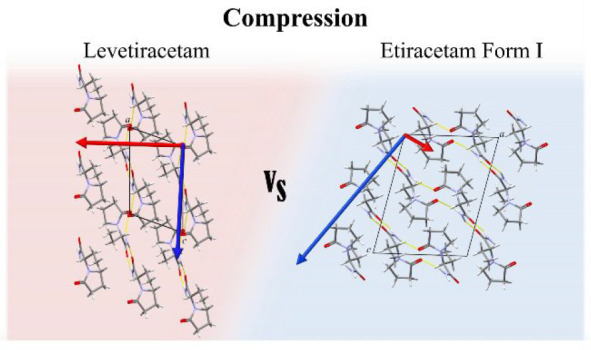
The Raman data provided us with evidence that slight structural modifications could be occurring in Lev and Eti at higher pressures. For this reason, we collected single-crystal diffraction data to verify the changes that may be occurring at the pressures identified in the Raman study. We compressed single crystals of Lev and Eti to 4.83 and 6.29 GPa, respectively. The limits of these studies were dictated by the quality of the diffraction pattern. For reference structures we used the literature structures with CSD refcodes OMIVUB27 (Lev) and OFIQUR26 (Eti). The changes in the unit cell parameters over the compression range studied are shown in Figure 6. The slight dispersion in the measurements for Lev using the three crystals can arise due to errors in pressure measurement (typically 0.05 GPa) as well as errors introduced, as the data are collected in a diamond anvil cell. We do not have as many observations as a normal crystallographic data set would have to refine the cell parameters. Neutron powder diffraction would be the best technique for the evolution of cell parameters with pressure but was unavailable to us for this study. Nevertheless, in both instances the change in unit cell parameters with pressure shows an anisotropic compression with higher compressibility in the a axis (Lev, 11%) and c axis (Eti, 12%) followed by the compression of the b axis (Lev, 7%; Eti 9%) followed by the c axis (Lev, 4%) and a axis (Eti, 5%) (Figure 6a,d). The β angle reacts differently in each case, where it increases by 0.6° until approximately 1.5 GPa and then plateaus in Lev (Figure 6b) but for Eti it decreases by 6° during compression (Figure 6e). The difference in behavior is linked to the direction of greatest compression with respect to the unit cell. Figure 7 shows the compression of the structure and the alignment of this with respect to the unit cell. For Lev, these directions are approximately aligned to the a and c directions of the unit cell; hence, there is little change in the β angle, whereas for Eti the compressions are not so well aligned to the unit cell directions, resulting in a greater β angle change. The change in β angle where it plateaus is also observed in the compression of paracetamol52 and RS-ibuprofen.53
Figure 7.

Compressibility indicatrix for (a) Lev and (b) Eti calculated by PASCal together with a vector applied to the crystal structure to show how the crystal compresses.
The unit cell volumes are compressed by an extent (18% to 4.83 GPa; 22% to 4.84 GPa) similar to that of the unit cell parameters. We applied a third-order Birch–Murnaghan (BM) and Murnaghan (M) equation of state (EoS) to each set of data and observed that the best fit was using a third-order BM EoS for Lev (using data for all three crystals) and a third-order M EoS for Eti (Table 2). The refined EoS parameters are a bulk modulus (K0) of 8(7) GPa with V0 = 434(14) Å3 and K0′ = 12(11) for Lev and a bulk modulus (K0) of 6.5(10) GPa with V0 = 882(8) Å3 and K0′ = 8.5(4) for Eti. These parameters indicate that the crystal forms have similar compressibilities. As part of this study we determined the bulk moduli for four other pharmaceutically relevant molecules from literature values using EoSFIT7.0:41 for piracetam (second-order BM EoS, K0 = 15(2)),54 paracetamol (third-order BM EoS, K0 = 16(10));52RS-ibuprofen (second-order BM EoS, K0 = 12.1(8)),53 and chlorothiazide form I (third-order BM EoS, K0 = 13(5)).55 This analysis demonstrated that Lev is far more compressible than piracetam, paracetamol, RS-ibuprofen, and chlorothiazide.
Table 2. Expression for the Equation of States along with the Parameters Used in the Fits along with χ2 for Each Fita.
| Expression of Bulk Modulus | |
|---|---|
| Birch–Murnaghan EoS: | |
| where | |
| Murnaghan EoS: | |
| Parameters Used in the Fits | ||||
|---|---|---|---|---|
| V0 (Å3) | K0 (GPa) | K0′ | χ2 | |
| Lev BM | 434(14) | 8(7) | 12(12) | 32.05 |
| Lev M | 432(10) | 10(4) | 8(2) | 32.93 |
| Eti BM | 845b | 11.8(13) | 8.6(16) | 15.74 |
| Eti M | 882(8) | 6.5(10) | 8.5(4) | 2.92 |
P is the pressure, V0 is the reference volume, V is the volume at the pressure, K0 is the bulk modulus, and K0′ is the derivative of the bulk modulus with respect to pressure.
Refining the V0 for Eti using the BM EoS made the refinement unstable but is included here to validate our choice of EoS expression.
While knowing how the unit cell compresses is important, the principal axis of strain is a better measure of how the solid reacts to compression. The strain tensor and compressibility indicatrix provide the directions in which the crystal structure is compressed, which makes it more appropriate for the analysis of low-symmetry triclinic and monoclinic systems, as the unit cell angles are not necessarily 90°. The principal axes of strain for both crystal structures are presented in Figure 7 and Table 3. The red compressibility indicatrix for each phase is shown with the respect to the unit cell axis. From this analysis, we have superimposed the directions of compression onto the crystals structure using red and blue arrows to aid our understanding of the compression.
Table 3. Principal Axes of Strain for the Crystal Structures of Lev and Eti.
| principal
axis of strain |
||||||
|---|---|---|---|---|---|---|
| X1 |
X2 |
X3 |
||||
| direction | K (TPa–1) | direction | K (TPa–1) | direction | K (TPa–1) | |
| Lev | [−0.99 0 –0.17] | 11(3) | [0 1 0] | 9.8(8) | [−0.11 0 –0.99] | 5.4(5) |
| Eti | [− 0.44 0 0.90] | 18(1) | [0 –1 0] | 11.7(5) | [0.91 0 0.42] | 2.3(1) |
The presence of layers in the crystal structures is characterized by weak interlayer van der Waals interactions, that can be observed in Lev and Eti. As expected, the most compressible direction for both compounds (Lev, [−0.99 0 –0.17]; Eti, [−0.44 0 0.90]) is almost perpendicular to the layers and the degree of compressibility depends on the geometry of the hydrogen bonding in the layers (Figure 7). In addition to the geometry we can correlate the weaker interactions and the layered nature of the structure with the position and percentage of voids in the crystal structure. The voids in the Lev structure are located between the layers that are translated along the a axis (Figure 8a). Eti form I shows that the majority of the void space is between the stepped layers parallel to the (1 0 –1) plane (Figure 8b).
Figure 8.

Representation of voids in the crystal structure of Lev and Eti: (a) view along the b axis in the crystal structure of Lev; (b) view along the b axis in the crystal structure of Eti. Parameters used for void calculations: probe radius of 0.5 Å and grid spacing 0.2 Å.
On compression there is a general reduction of void volume in Lev (from 12.7 to 1.4%) and the interlayer voids decrease over the compression range. However, even at the highest pressure there are still voids present between the ethyl group of one layer and the amide of the second layer. This is due to the perpendicular orientation of the five-membered ring with respect to the layer, which prevents the molecules from coming closer together and reducing the voids. In contrast to Lev, the direction of the principal axis of strain in Eti contains significant components of the a and c axes due to the layers being parallel to the (1 0 –1) plane, as we discussed in relation to the β angle. The majority of the voids in the crystal structure of Eti are between the stepped layers and are reduced substantially on compression; as a whole the volume decreases by 7.7%. The remaining void space is due to the orientation of the oxopyrrolidine ring and ethyl groups, where they form the sides of a “pocket” and limit the compression.
An unusual observation in the two structures, but common to both, is that the direction of the hydrogen bond ([0 1 0] or [0 –1 0]) is the second most compressible direction. We are able to rationalize this for each structure due to there being little intercalation of the molecules into the neighboring hydrogen-bonded chains. The lack of intercalation and geometry of the hydrogen bonding (sinusoidal pattern rather than a straight chain) permit the hydrogen-bonded chain to act as a spring, something that has been noted in other studies.46,56 The remaining void volumes in both systems, highlighted previously, are the remnants of the void between translated molecules in the hydrogen-bonded chain and hence indicate the lack of intercalation. In Lev, the oxygen of the oxopyrrolidine group is the only part that is in the same plane as the neighboring chain and hence has little effect on the compression along the bond.
The least compressible direction in Lev is along the [−0.11 0 –0.99] direction. As previously described, the hydrogen-bonded chains are positioned at a slight angle to the c axis, restricting the compression along the [−0.11 0 –0.99] direction. The ethyl group of one chain is in close contact with the oxopyrrolidine ring and at ambient pressure is close to the van der Waals radii for the groups. The structure compresses so that these groups interlock and prevent further compression along the c direction. In addition to this, the NH···O(py) hydrogen bond is also in this direction. It compresses at a rate similar to that of the other hydrogen bond in the system: 6.25% in the NH···O(py) bond, in comparison with 7.02% in NH···O(CNH2). For Eti the compression of the structure in the [0.91 0 0.42] direction is much lower than that in Lev, which can be attributed to the strong dimer interaction over the inversion center. Due to the symmetry there is necessarily a two-point contact between the molecules in the chains rather than the single hydrogen bond contact observed in Lev, which provides a more robust interaction. As expected, the hydrogen bonds were compressed at different rates: 4.25% in NH···O(py) and 8.18% in NH···O(CNH2) hydrogen bonds.
Comparison of Levetiracetam and Etiracetam
We have investigated the compression of 2-(2-oxo-1-pyrrolidinyl)butyramide as both the enantiopure and racemic solid forms to observe the similarities and differences of these materials on exposure to pressure, including the potential to use pressure as a method of phase separation.
At a basic level, we observe that the globularity and sphericity for Lev and Eti diverge slightly when they are compressed to 4.83 and 4.85 GPa, respectively (Table 4). The compression promotes a less spherical surface for both compounds. The molecular volumes for Lev and Eti are also very similar at ambient pressure (Lev, 218.5 Å3; Eti, 217.8 Å3). On compression (Figure 9), the molecular volumes for both forms are equivalent to approximately 1 GPa, after which they deviate slightly. At higher pressures, the molecular volume of Eti is marginally lower than that of Lev, which may indicate the increased stability of Eti with respect to Lev. Hence, a conclusion from this work is that chiral resolution using pressure is not a viable method for this system. Pressure has been used in the past to separate mandelic acid, where the molecular volume of the chiral crystal is lower than that of the racemic crystal.14−16
Table 4. Asphericity and Globularity for the Molecules in Lev and Eti Crystal Structures at Atmospheric and High Pressure.
| Lev |
Eti |
|||
|---|---|---|---|---|
| 0 GPa | 4.83 GPa | 0 GPa | 4.85 GPa | |
| globularity | 0.831 | 0.804 | 0.839 | 0.823 |
| sphericity | 0.033 | 0.036 | 0.032 | 0.037 |
Figure 9.

Molecular volume (V/Z) for Eti (orange plot) and Lev (blue plot) as a function of pressure. The lines are only a guide to the eye.
Up to this point, we have discussed the compression of Lev and Eti as a progressive compression of the structure. However, there are some indications that imply a subtle phase transition where the structure rearranges slightly enough to be stabilized at high pressure. The Raman spectra of both compounds show a discontinuity in the increase in frequency with an increase in pressure (Figure 5), as described in previous sections. We have plotted the percentage changes in length for both Lev and Eti in Figure 10. This plot highlights the small discontinuities on the compression of Lev after 2 GPa and in Eti after 1.5 GPa. For Lev, we have plotted all of the data sets for the three single crystals measured and it can be observed that there are discontinuities in each of the cell axes. The plot for Eti is less clear, but the c axis shows the greatest change over the pressure range. Superimposed on these graphs are the adjusted lattice energies for the structures as calculated using PIXEL.57−59 These energies take into account not only the intermolecular energies but also the changes in the molecular energy following procedures by Johnstone et al.60 The lattice energy for leviteracetam shows a distinct change over the pressure range of the discontinuity in the lattice parameters. The lattice energy of etiracetam does not show a distinct discontinuity, but there is a change in the gradient of the slope at the pressure of the suspected transition. From these additional observations, we will tentatively identify these as form II of leviteracetam and form III of etiracetam. These boundaries are our best estimate, given the data we have collected. Neutron powder diffraction would provide an opportunity to define these boundaries with increased precision.
Figure 10.

Variation of unit cell lengths as a percentage change together with the adjusted total lattice energies for (a) Lev (all data) and (b) Eti as a function of pressure. The discontinuities in the regions of 2 and 1.5 GPa can be seen in Lev and Eti, respectively. Lines are polynomials as a guide to the eye.
A more in-depth investigation into the potential phase transitions at the molecular level reveals that there are changes in the intermolecular interactions over the “phase transition” pressure (CrystalExplorer40). The interactions between molecules in translated layers (between the central molecule and the blue and red molecules in Figure 11) show a relief of repulsive energies over the transition pressure, while this is not evident in the interactions between molecules in the hydrogen-bonded chain using the amide moieties (purple molecule).
Figure 11.

Energy of molecular interactions in Lev illustrated by (a) a molecular packing diagram surrounding the element-colored molecule with (b) red molecule interaction energies (amide-oxopyrrolidine hydrogen bond), (c) purple-molecule interaction energies (amide–amide hydrogen bond), and (d) blue molecule interaction energies (interlayer interaction). Color code: green, repulsion energy; blue, dispersion energy; red, polarization energy; violet, total energy.
Overall for Eti, there is a very small difference in the unit cell parameters, where the c axis varies the most over the possible transition. The interactions among the hydrogen-bonded dimer, chain, and layer indicate a slight change in total energy that is driven by a variation in the polarization energy over the transition pressure (Figure 12). The relief of repulsive energies for interactions between the hydrogen-bonded dimer and chain are not as pronounced as for Lev, while the interactions between layers show no discontinuity. That the hydrogen-bonded dimers show the greatest changes in the intermolecular energies can be rationalized through the notion that the direction of the hydrogen-bonded dimer has a component of the c direction. It is clear from Figure 12 that the polarization components of the molecules in the layer are affected at the same pressure, whereas the interlayer interaction polarizations change at a higher pressure. Ultimately, the changes are so small that any difficulties in refinement will change the intermolecular interactions, which is particularly important given that this is refined using high-pressure data.
Figure 12.

Energy of molecular interactions in Eti illustrated by (a) a molecular packing diagram surrounding the element-colored molecule with (b) green-molecule interaction energies (amide–oxopyrrolidine hydrogen-bonded dimer), (c) purple-molecule interaction energies (amide–amide hydrogen bond) and (d) blue-molecule interaction energies (interlayer interaction). Color code: green, repulsion energy; blue, dispersion energy; red, polarization energy; violet, total energy.
Conclusion
We have discussed the effect of high pressure on the structure of Eti (racemic compound) and Lev (enantiopure crystal of the S enantiomer). Both compounds showed an anisotropic strain compression where the most compressible axis is determined by the presence of van der Waals interactions between layers. Nonetheless, the compression of both compounds is not linear. The Raman spectroscopy analysis highlights that there is a possible phase transition in Lev (∼2 GPa) to form II and in Eti (∼1.5 GPa) to form III. These observations are supported by the analysis of the change in unit cell parameters as a function of pressure as well as the change in lattice energies and corresponding intermolecular energies over the transition. In Lev, we observe that the repulsive energy of some of the interlayer interactions is relieved over the transition, while the interlayer hydrogen-bonded molecules show no such relief. With respect to the preferential crystallization at high pressure of the chiral compound, Eti shows an increase in density of up to 1.7% at 4.8 GPa in relation to Lev. This factor makes the spontaneous resolution through high pressure unlikely.
Acknowledgments
We thank the EPSRC (Grant ref: EP/N015401/1), the Doctoral Training Centre in Continuous Manufacturing and Crystallization (Grant ref: EP/K503289/1), and the Centre for Innovative Manufacturing in Continuous Manufacturing and Crystallization (Grant ref: EP/I033459/1) for funding this work. We acknowledge that this work was carried out at the CMAC National Facility supported by a UKRPIF (UK Research Partnership Fund) award from the Higher Education Funding Council for England (HEFCE) (Grant ref: HH13054). We thank Professor Tom Leyssens from the University of Louvain for supplying the project with samples of levetiracetam and etiracetam and Dr. Martin R. Ward for useful discussions and help with data collection.
Supporting Information Available
The Supporting Information is available free of charge at https://pubs.acs.org/doi/10.1021/acs.cgd.0c00871.
Crystallographic tables for etiracetam and levetiracetam (PDF)
Accession Codes
CCDC 2011949–2011966 and 2011968–2011970 contain the supplementary crystallographic data for this paper. These data can be obtained free of charge via www.ccdc.cam.ac.uk/data_request/cif, or by emailing data_request@ccdc.cam.ac.uk, or by contacting The Cambridge Crystallographic Data Centre, 12 Union Road, Cambridge CB2 1EZ, UK; fax: +44 1223 336033.
The authors declare no competing financial interest.
Notes
All data underpinning this publication are openly available from the University of Strathclyde KnowledgeBase at https://doi.org/10.15129/29ade4d6-6603-4a70-a807-0c8889751f07.
Supplementary Material
References
- Haleblian J.; McCrone W. Pharmaceutical Applications of Polymorphism. J. Pharm. Sci. 1969, 58, 911–929. 10.1002/jps.2600580802. [DOI] [PubMed] [Google Scholar]
- Brittain H. G.Polymorphism in Pharmaceutical Solids, 2nd ed.; CRC Press: 2016. 10.3109/9781420073225. [DOI] [Google Scholar]
- Yu L.; Reutzel S. M.; Stephenson G. A. Physical Characterization of Polymorphic Drugs: An Integrated Characterization Strategy. Pharm. Sci. Technol. Today 1998, 1, 118–127. 10.1016/S1461-5347(98)00031-5. [DOI] [Google Scholar]
- Nguyen L. A.; He H.; Pham-Huy C. Chiral Drugs: An Overview. Int. J. Biomed. Sci. 2006, 2, 85–100. [PMC free article] [PubMed] [Google Scholar]
- Lorenz H.; Seidel-Morgenstern A. Processes To Separate Enantiomers. Angew. Chem., Int. Ed. 2014, 53, 1218–1250. 10.1002/anie.201302823. [DOI] [PubMed] [Google Scholar]
- Wechter W. J.; Bigornia A. E.; Murray E. D.; Levine B. H.; Young J. W. Rac-Flurbiprofen Is More Ulcerogenic than Its (S)-Enantiomer. Chirality 1993, 5, 492–494. 10.1002/chir.530050703. [DOI] [PubMed] [Google Scholar]
- Islam M. R.; Mahdi J. G.; Bowen I. D.. Pharmacological Importance of Stereochemical Resolution of Enantiomeric Drugs. Drug Safety; Springer International: 1997; pp 149–165. 10.2165/00002018-199717030-00002. [DOI] [PubMed] [Google Scholar]
- Lorenz H.; Perlberg A.; Sapoundjiev D.; Elsner M. P.; Seidel-Morgenstern A. Crystallization of Enantiomers. Chem. Eng. Process. 2006, 45, 863–873. 10.1016/j.cep.2005.11.013. [DOI] [Google Scholar]
- Bordallo H. N.; Kolesov B. A.; Boldyreva E. V.; Juranyi F. Different Dynamics of Chiral and Racemic (L- and DL-) Serine Crystals: Evidenced by Incoherent Inelastic Neutron and Raman Scattering. J. Am. Chem. Soc. 2007, 129, 10984–10985. 10.1021/ja073351n. [DOI] [PubMed] [Google Scholar]
- Zakharov B. A.; Kolesov B. A.; Boldyreva E. V. Effect of Pressure on Crystalline L- and Dl-Serine: Revisited by a Combined Single-Crystal X-Ray Diffraction at a Laboratory Source and Polarized Raman Spectroscopy Study. Acta Crystallogr., Sect. B: Struct. Sci. 2012, 68, 275–286. 10.1107/S0108768112015960. [DOI] [PubMed] [Google Scholar]
- Minkov V. S.; Krylov A. S.; Boldyreva E. V.; Goryainov S. V.; Bizyaev S. N.; Vtyurin A. N. Pressure-Induced Phase Transitions in Crystalline l - and dl -Cysteine. J. Phys. Chem. B 2008, 112, 8851–8854. 10.1021/jp8020276. [DOI] [PubMed] [Google Scholar]
- Görbitz C. H. Crystal Structures of Amino Acids: From Bond Lengths in Glycine to Metal Complexes and High-Pressure Polymorphs. Crystallogr. Rev. 2015, 21, 160–212. 10.1080/0889311X.2014.964229. [DOI] [Google Scholar]
- Moggach S. A.; Parsons S.; Wood P. A. High-Pressure Polymorphism in Amino Acids. Crystallogr. Rev. 2008, 14, 143–184. 10.1080/08893110802037945. [DOI] [Google Scholar]
- Rietveld I. B.; Barrio M.; Tamarit J.-L.; Do B.; Céolin R. Enantiomer Resolution by Pressure Increase: Inferences from Experimental and Topological Results for the Binary Enantiomer System (R)- and (S)-Mandelic Acid. J. Phys. Chem. B 2011, 115, 14698–14703. 10.1021/jp209328d. [DOI] [PubMed] [Google Scholar]
- Cai W.; Marciniak J.; Andrzejewski M.; Katrusiak A. Pressure Effect on d, L -Mandelic Acid Racemate Crystallization. J. Phys. Chem. C 2013, 117, 7279–7285. 10.1021/jp401626a. [DOI] [Google Scholar]
- Marciniak J.; Andrzejewski M.; Cai W.; Katrusiak A. Wallach’s Rule Enforced by Pressure in Mandelic Acid. J. Phys. Chem. C 2014, 118, 4309–4313. 10.1021/jp411738p. [DOI] [Google Scholar]
- Roszak K.; Katrusiak A. High-Pressure and Temperature Dependence of the Spontaneous Resolution of 1,1′-Binaphthyl Enantiomers. Phys. Chem. Chem. Phys. 2018, 20, 5305–5311. 10.1039/C7CP07234A. [DOI] [PubMed] [Google Scholar]
- Fabbiani F. P. A.; Allan D. R.; Parsons S.; Pulham C. R. An Exploration of the Polymorphism of Piracetam Using High Pressure. CrystEngComm 2005, 7, 179–186. 10.1039/b418976k. [DOI] [Google Scholar]
- Fabbiani F. P. A.; Allan D. R.; David W. I. F.; Davidson A. J.; Lennie A. R.; Parsons S.; Pulham C. R.; Warren J. E. High-Pressure Studies of Pharmaceuticals: An Exploration of the Behavior of Piracetam. Cryst. Growth Des. 2007, 7, 1115–1124. 10.1021/cg0607710. [DOI] [Google Scholar]
- Admiraal G.; Eikelenboom J. C.; Vos A. Structures of the Triclinic and Monoclinic Modifications of (2-Oxo-1-Pyrrolidinyl)Acetamide. Acta Crystallogr., Sect. B: Struct. Crystallogr. Cryst. Chem. 1982, 38, 2600–2605. 10.1107/S0567740882009431. [DOI] [Google Scholar]
- Bandoli G.; Clemente D. A.; Grassi A.; Pappalardo G. C. Molecular Determinants for Drug-Receptor Interactions. 1. Solid-State Structure and Conformation of the Novel Nootropic Agent 2-Pyrrolidone-N-Acetamide: X-Ray and Theoretical SCF-MO Studies. Mol. Pharmacol. 1981, 20, 558–564. [PubMed] [Google Scholar]
- Picciochi R.; Diogo H. P.; Minas da Piedade M. E. Thermodynamic Characterization of Three Polymorphic Forms of Piracetam. J. Pharm. Sci. 2011, 100, 594–603. 10.1002/jps.22294. [DOI] [PubMed] [Google Scholar]
- Toscani S.; Céolin R.; Ter Minassian L.; Barrio M.; Veglio N.; Tamarit J.-L.; Louër D.; Rietveld I. B. Stability Hierarchy between Piracetam Forms I, II, and III from Experimental Pressure–Temperature Diagrams and Topological Inferences. Int. J. Pharm. 2016, 497, 96–105. 10.1016/j.ijpharm.2015.11.036. [DOI] [PubMed] [Google Scholar]
- Fabbiani F. P. A.; Allan D. R.; David W. I. F.; Davidson A. J.; Lennie A. R.; Parsons S.; Pulham C. R.; Warren J. E. High-Pressure Studies of Pharmaceuticals: An Exploration of the Behavior of Piracetam. Cryst. Growth Des. 2007, 7, 1115–1124. 10.1021/cg0607710. [DOI] [Google Scholar]
- Fabbiani F. P. A.; Allan D. R.; Parsons S.; Pulham C. R. An Exploration of the Polymorphism of Piracetam Using High Pressure. CrystEngComm 2005, 7, 179. 10.1039/b418976k. [DOI] [Google Scholar]
- Herman C.; Vermylen V.; Norberg B.; Wouters J.; Leyssens T. The Importance of Screening Solid-State Phases of a Racemic Modification of a Chiral Drug: Thermodynamic and Structural Characterization of Solid-State Phases of Etiracetam. Acta Crystallogr., Sect. B: Struct. Sci., Cryst. Eng. Mater. 2013, 69, 371–378. 10.1107/S2052519213015054. [DOI] [PubMed] [Google Scholar]
- Song J.; Lou K. X.; Li X. J.; Wu X. P.; Feng R. X. 2-(2-Oxopyrrolidin-1-Yl)Butyramide. Acta Crystallogr. Sect. E Struct. Reports Online 2003, 59, o1772–o1773. 10.1107/S1600536803022578. [DOI] [Google Scholar]
- Xu K.; Xiong X.; Guo L.; Wang L.; Li S.; Tang P.; Yan J.; Wu D.; Li H. An Investigation into the Polymorphism and Crystallization of Levetiracetam and the Stability of Its Solid Form. J. Pharm. Sci. 2015, 104, 4123–4131. 10.1002/jps.24628. [DOI] [PubMed] [Google Scholar]
- Moggach S. A.; Allan D. R.; Parsons S.; Warren J. E. Incorporation of a New Design of Backing Seat and Anvil in a Merrill-Bassett Diamond Anvil Cell. J. Appl. Crystallogr. 2008, 41, 249–251. 10.1107/S0021889808000514. [DOI] [Google Scholar]
- Piermarini G. J.; Block S.; Barnett J. D.; Forman R. a. Calibration of the Pressure Dependence of the R//1 Ruby Fluorescence Line To 195 Kbar. J. Appl. Phys. 1975, 46, 2774–2780. 10.1063/1.321957. [DOI] [Google Scholar]
- Dawson A.; Allan D. R.; Parsons S.; Ruf M. Use of a CCD Diffractometer in Crystal Structure Determinations at High Pressure. J. Appl. Crystallogr. 2004, 37, 410–416. 10.1107/S0021889804007149. [DOI] [Google Scholar]
- APEX 3; Bruker AXS: Madison, WI, USA, 2017.
- SAINT Version 7 ; Bruker AXS: Madison, WI, USA, 2003.
- Parsons S.SHADE: Program for Empirical Absorption Corrections to High Pressure Data; The University of Edinburgh: Edinburgh, U.K., 2004.
- Dolomanov O. V.; Bourhis L. J.; Gildea R. J.; Howard J. A. K.; Puschmann H. OLEX2: A Complete Structure Solution, Refinement and Analysis Program. J. Appl. Crystallogr. 2009, 42, 339–341. 10.1107/S0021889808042726. [DOI] [Google Scholar]
- Sheldrick G. M. Crystal Structure Refinement with SHELXL. Acta Crystallogr., Sect. C: Struct. Chem. 2015, 71, 3–8. 10.1107/S2053229614024218. [DOI] [PMC free article] [PubMed] [Google Scholar]
- Groom C. R.; Bruno I. J.; Lightfoot M. P.; Ward S. C. The Cambridge Structural Database. Acta Crystallogr., Sect. B: Struct. Sci., Cryst. Eng. Mater. 2016, B72, 171–179. 10.1107/S2052520616003954. [DOI] [PMC free article] [PubMed] [Google Scholar]
- Macrae C. F.; Bruno I. J.; Chisholm J. A.; Edgington P. R.; McCabe P.; Pidcock E.; Rodriguez-Monge L.; Taylor R.; van de Streek J.; Wood P. A. Mercury CSD 2.0 - New Features for the Visualization and Investigation of Crystal Structures. J. Appl. Crystallogr. 2008, 41, 466–470. 10.1107/S0021889807067908. [DOI] [Google Scholar]
- Thorn A.; Dittrich B.; Sheldrick G. M. Enhanced Rigid-Bond Restraints. Acta Crystallogr., Sect. A: Found. Crystallogr. 2012, 68, 448–451. 10.1107/S0108767312014535. [DOI] [Google Scholar]
- Turner M. J.; McKinnon J. J.; Wolff S. K.; Grimwood D. J.; Spackman P. R.; Jayatilaka D.; Spackman M. A.. CrystalExplorer17; University of Western Australia: 2017.
- Gonzalez-Platas J.; Alvaro M.; Nestola F.; Angel R. EosFit7-GUI: A New Graphical User Interface for Equation of State Calculations, Analyses and Teaching. J. Appl. Crystallogr. 2016, 49, 1377–1382. 10.1107/S1600576716008050. [DOI] [Google Scholar]
- Cliffe M. J.; Goodwin A. L. PASCal: A Principal Axis Strain Calculator for Thermal Expansion and Compressibility Determination. J. Appl. Crystallogr. 2012, 45, 1321–1329. 10.1107/S0021889812043026. [DOI] [Google Scholar]
- Momma K.; Izumi F. VESTA 3 for Three-Dimensional Visualization of Crystal, Volumetric and Morphology Data. J. Appl. Crystallogr. 2011, 44, 1272–1276. 10.1107/S0021889811038970. [DOI] [Google Scholar]
- Spackman M. A.; Byrom P. G. A Novel Definition of a Molecule in a Crystal. Chem. Phys. Lett. 1997, 267, 215–220. 10.1016/S0009-2614(97)00100-0. [DOI] [Google Scholar]
- Hirshfeld F. L. Bonded-Atom Fragments for Describing Molecular Charge Densities. Theor. Chim. Acta 1977, 44, 129–138. 10.1007/BF00549096. [DOI] [Google Scholar]
- Connor L. E.; Delori A.; Hutchison I. B.; Nic Daeid N.; Sutcliffe O. B.; Oswald I. D. H. The Ecstasy and the Agony; Compression Studies of 3,4-Methylenedioxymethamphetamine (MDMA). Acta Crystallogr., Sect. B: Struct. Sci., Cryst. Eng. Mater. 2015, 71, 3–9. 10.1107/S2052520614026389. [DOI] [PubMed] [Google Scholar]
- Johnstone R. D. L.; Lennie A. R.; Parsons S.; Pidcock E.; Warren J. E. Comparison of the Effects of Pressure on Three Layered Hydrates: A Partially Successful Attempt to Predict a High-Pressure Phase Transition. Acta Crystallogr., Sect. B: Struct. Sci. 2009, 65, 731–748. 10.1107/S0108768109039469. [DOI] [PubMed] [Google Scholar]
- Ramya T.; Gunasekaran S.; Ramkumaar G. R. Molecular Structure, Spectroscopic Characterization of (S)-2-Oxopyrrolidin-1-Yl Butanamide and Ab Initio, DFT Based Quantum Chemical Calculations. Spectrochim. Acta, Part A 2015, 149, 132–142. 10.1016/j.saa.2015.04.033. [DOI] [PubMed] [Google Scholar]
- Yoo C. S.; Cynn H. Equation of State, Phase Transition, Decomposition of β-HMX (Octahydro-1,3,5,7-Tetranitro-1,3,5,7-Tetrazocine) at High Pressures. J. Chem. Phys. 1999, 111, 10229–10235. 10.1063/1.480341. [DOI] [Google Scholar]
- Liu X.; Bull C. L.; Kleppe A. K.; Dowding P. J.; Lewtas K.; Pulham C. R. High-Pressure Crystallisation Studies of Biodiesel and Methyl Stearate. CrystEngComm 2019, 21, 4427. 10.1039/C9CE00393B. [DOI] [Google Scholar]
- Hutchison I. B.; Delori A.; Wang X.; Kamenev K. V.; Urquhart A. J.; Oswald I. D. H. Polymorphism of a Polymer Precursor: Metastable Glycolide Polymorph Recovered via Large Scale High-Pressure Experiments. CrystEngComm 2015, 17, 1778–1782. 10.1039/C5CE00119F. [DOI] [Google Scholar]
- Oswald I. D. H.; Motherwell W. D. S.; Parsons S.; Pulham C. R. A Paracetamol–Morpholine Adduct. Acta Crystallogr., Sect. E: Struct. Rep. Online 2002, 58, o1290–o1292. 10.1107/S1600536802018111. [DOI] [Google Scholar]
- Ostrowska K.; Kropidowska M.; Katrusiak A. High-Pressure Crystallization and Structural Transformations in Compressed R, S -Ibuprofen. Cryst. Growth Des. 2015, 15, 1512–1517. 10.1021/cg5018888. [DOI] [Google Scholar]
- Fabbiani F. P. A.; Allan D. R.; David W. I. F.; Davidson A. J.; Lennie A. R.; Parsons S.; Pulham C. R.; Warren J. E. High-Pressure Studies of Pharmaceuticals: An Exploration of the Behavior of Piracetam. Cryst. Growth Des. 2007, 7, 1115–1124. 10.1021/cg0607710. [DOI] [Google Scholar]
- Oswald I. D. H.; Lennie A. R.; Pulham C. R.; Shankland K. High-Pressure Structural Studies of the Pharmaceutical, Chlorothiazide. CrystEngComm 2010, 12, 2533. 10.1039/c001355b. [DOI] [Google Scholar]
- Hutchison I. B.; Bull C. L.; Marshall W. G.; Urquhart A. J.; Oswald I. D. H. Pressure-Induced Polymorphism of Caprolactam: A Neutron Diffraction Study. Molecules 2019, 24, 2174. 10.3390/molecules24112174. [DOI] [PMC free article] [PubMed] [Google Scholar]
- Gavezzotti A. Efficient Computer Modeling of Organic Materials. The Atom-Atom, Coulomb-London-Pauli (AA-CLP) Model for Intermolecular Electrostatic-Polarization, Dispersion and Repulsion Energies. New J. Chem. 2011, 35, 1360–1368. 10.1039/c0nj00982b. [DOI] [Google Scholar]
- Gavezzotti A. Non-Conventional Bonding between Organic Molecules. The “Halogen Bond” in Crystalline Systems. Mol. Phys. 2008, 106, 1473–1485. 10.1080/00268970802060674. [DOI] [Google Scholar]
- Reeves M. G.; Wood P. A.; Parsons S. MrPIXEL: Automated Execution of Pixel Calculations via the Mercury Interface. J. Appl. Crystallogr. 2020, 53, 1154–1162. 10.1107/S1600576720008444. [DOI] [PMC free article] [PubMed] [Google Scholar]
- Johnstone R. D. L.; Francis D.; Lennie A. R.; Marshall W. G.; Moggach S. A.; Parsons S.; Pidcock E.; Warren J. E. High-Pressure Polymorphism in L-Serine Monohydrate: Identification of Driving Forces in High Pressure Phase Transitions and Possible Implications for Pressure-Induced Protein Denaturation. CrystEngComm 2008, 10, 1758–1769. 10.1039/b810746g. [DOI] [Google Scholar]
Associated Data
This section collects any data citations, data availability statements, or supplementary materials included in this article.