Abstract
The acoustic phonons in the organic-inorganic lead halide perovskites have been reported to have anomalously short lifetimes over a large part of the Brillouin zone. The resulting shortened mean free paths of the phonons have been implicated as the origin of the low thermal conductivity. We apply neutron spectroscopy to show that the same acoustic phonon energy linewidth broadening (corresponding to shortened lifetimes) occurs in the fully inorganic CsPbBr3 by comparing the results on the organic-inorganic CH3NH3PbCl3. We investigate the critical dynamics near the three zone boundaries of the cubic Brillouin zone of CsPbBr3 and find energy and momentum broadened dynamics at momentum points where the Cs-site (A-site) motions contribute to the cross section. Neutron diffraction is used to confirm that both the Cs and Br sites have unusually large thermal displacements with an anisotropy that mirrors the low temperature structural distortions. The presence of an organic molecule is not necessary to disrupt the low-energy acoustic phonons at momentum transfers located away from the zone center in the lead halide perovskites and such damping may be driven by the large displacements or possibly disorder on the A site.
I. INTRODUCTION
The lead halide perovskites [with chemical formula APb(Cl,Br,I)3] display exceptional structural, optical, electronic, and charge transport properties [1-7]. In particular, the semiconducting properties of CsPbBr3 have made this system a promising candidate for detector applications [4]. Recent theoretical and experimental works have been focused on hybrid organic-inorganic lead halide perovskites as potentially efficient photovoltaic materials [8-10]. These materials combine two sublattices, formed by an inorganic lead halide framework coupled to a molecular cation (based on the A site) through hydrogen bonding. As this coupling has been identified as key for understanding their improved efficiency in solar power conversion, a significant number of studies have been devoted to investigating the coupling between the molecular and inorganic frameworks [1,11-13] with some studies implicating the organic molecule as the origin for the improved thermal properties [14].
Although this new class of materials has generated a considerable amount of theoretical and experimental interest, it has been shown that all-inorganic lead halide perovskites also exhibit similar efficiencies and properties for photovoltaic devices [15-19]. Therefore, an open question is whether the organic A-site cation is essential to the enhanced photoelectronic properties [20]. From a more fundamental point of view, the role of the cationic nature and its influence on lattice dynamics is still unclear and needs to be further examined particularly given the suggestions that the low-energy acoustic phonons are influential to the electronic properties [21]. In this context, we investigate the low-energy acoustic phonons in CsPbBr3 with the goal of establishing which lattice dynamical features are unique to the organic-inorganic variants. With Cs occupying the A site, CsPbBr3 is one of the all inorganic lead-halide perovskites.
The study of cesium lead halide compounds started 40 years ago when the first structural characterization was performed using neutron inelastic scattering in CsPbCl3 by Fujii et al., who reported the temperature dependence of superlattice Bragg peaks through the structural transitions, as well as the dispersion of acoustic phonons across the Brillouin zone [22]. In an attempt to characterize the structural transitions in this compound, this study showed the presence of overdamped phonons at the M and R zone boundaries, which prevents the observation of phonon softening near the transitions. A detailed study of the structural transitions was later performed by Hua et al. [23] who reported three structural transitions in CsPbCl3: a cubic to tetragonal transition, followed by a tetragonal to orthorhombic phase transition, and finally an orthorhombic-orthorhombic transition.
A neutron diffraction study was also performed on the bromine compound [2] which exhibits only two structural transitions: one first order transition from a cubic phase described by the space group to a tetragonal symmetry around 400 K (space group P4/mbm) and a second order transition to an orthorhombic phase around 360 K (space group Pmbn). The structural transitions in both chlorine and bromine compounds were then further investigated with ultrasound measurements that reported several anomalies in the longitudinal and transverse sound velocities at the structural transitions, indicative of changes in the elastic coefficients [24,25]. Since then, many experimental and theoretical studies have been devoted to similar compounds, such as cesium tin halides [26-28].
This paper reports a neutron scattering study of the transverse acoustic phonons in the all-inorganic perovskite CsPbBr3 towards the three high symmetry points of the cubic Brillouin zone , , and . We show the existence of both critical fluctuations and resolution limited Bragg peaks at specific zone boundaries when approaching the orthorhombic transition, concurrently with the presence of damped phonon modes indicating shortened lifetimes. Based on powder diffraction data showing strong anisotropic Cs and Br displacements in the tetragonal and orthorhombic phases, we speculate that the strong phonon damping originates from anharmonic effects related to this anisotropy. Based on these results, we discuss the importance of displacive transitions in this compound along with the influence of possible anisotropic A-site fluctuations affecting the acoustic phonon lifetime. This work therefore highlights similar mechanisms affecting the harmonic phonons as in the hybrid counterparts, which may explain their comparable efficiencies in terms of thermal and optoelectronic properties. This also illustrates that the strong phonon damping is possibly universal across the lead-halide perovskites and does not require the presence of an organic molecule on the A site.
II. EXPERIMENTAL DETAILS
A. Sample preparation
Single crystals of CsPbBr3 were prepared using the Bridgman method. First, a powder of CsPbBr3 was synthesized by solid state reaction following the procedure described in Ref. [4]. A bright orange ingot resulted from the reaction and was ground to obtain a homogeneous powder of CsPbBr3. The powder was then pelleted and sealed in an evacuated quartz ampoule which was placed into a three-zone horizontal tube furnace. The hottest zone was set to 600 °C and a temperature gradient of 10 °C/cm was applied. Orange transparent crystals were obtained and checked with neutron Laue diffraction using OrientExpress (ILL, Grenoble).
B. Neutron powder diffraction measurements
Powder neutron diffraction measurements were performed on the BT1 diffractometer (NIST, Gaithersburg) using Cu(311) (λ = 1.5399 Å) and Ge(311) (λ = 2.079 Å) monochromators for the orthorhombic and tetragonal phases, respectively. rietan [29] was used to perform Rietveld refinement of powder neutron diffraction data. Variable temperature synchrotron x-ray powder diffraction data were collected at the Swiss-Norwegian beamline BM01 (SNBL) at the ESRF (France) with an incident wavelength of λ = 0.956910 Å. The Rietveld refinements of this synchrotron x-ray powder diffraction data were performed using the fullprof suite [30].
C. Neutron inelastic measurements
Neutron inelastic spectroscopy was performed on the thermal triple-axis spectrometer IN22 (ILL, Grenoble) with constant kf = 2.662 Å−1, using a PG filter between the sample and the analyzer to remove higher order contamination. Further measurements as a function of temperature were performed on the thermal triple-axis instrument BT4 (NIST, Gaithersburg) with constant kf = 2.662 Å−1 using PG filters between the monochromator and the sample, and between the sample and the analyzer. Higher resolution measurements were also carried out on the cold triple-axis spectrometer SPINS (NIST, Gaithersburg) with kf = 1.55 Å−1 using a Be filter between the sample and the analyzer.
All phonon measurements were performed in the (H K 0) and (H H L) scattering planes. As superlattice reflections are expected at the X , M, and R zone boundaries, measurements were performed towards specific directions where the structure factor was nonzero, as described in Ref. [22]. Throughout the paper we use the zone boundary notation taken with respect to the cubic unit cell shown in Fig. 1(a). Diffraction measurements investigating the three zone boundaries were done both in the (H K 0) and (H H L) planes. With the 0.5 g sample aligned in the (H K 0) plane, the phonon dispersions of the TA1 and TA2 modes could be extracted and another sample aligned in the (H H L) plane was used to measure the phonons toward the zone boundary. The TA1 mode corresponds to the acoustic phonons propagating along the [1 0 0] direction with a polarization along [0 1 0] or [0 0 1]. Using the equations of motion outlined in Ref. [31], the velocity of this phonon can be related to the C44 elastic constant. The TA2 phonon mode propagates along [1 1 0] with a polarization along , and the limq→0 slope of the dispersion depends on (C11 – C12)/2. Given that the neutron cross section for phonon scattering scales as , where is the phonon eigenvector, transverse scans near allow the measurement of the TA1 phonon while scans near give the TA2 mode.
FIG. 1.
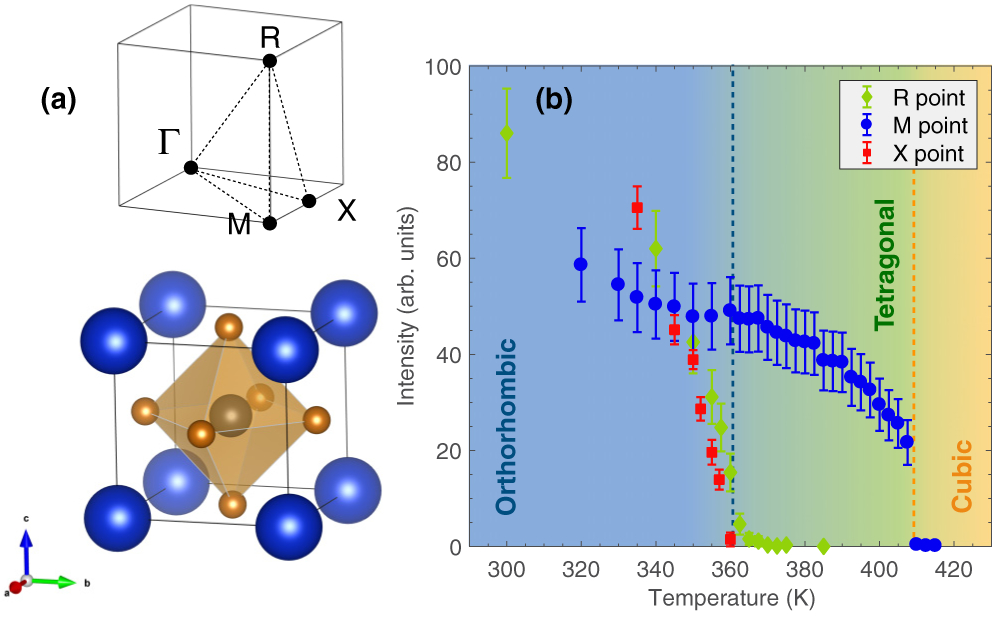
(a) Crystallographic structure of CsPbBr3 in the cubic phase. The Pb site is represented by the gray sphere, the Br ions are in light brown, and the Cs ions are in blue. The figure on the top shows the high symmetry points in the first Brillouin zone of a primitive cubic lattice. X, M, and R represent , , and , respectively. (b) Temperature dependence of the superlattice intensities at the three zone boundaries X , M and R . The colored dashed lines indicate the two transition temperatures.
III. PHONON MOMENTUM DEPENDENCE—FREQUENCY AND LIFETIMES
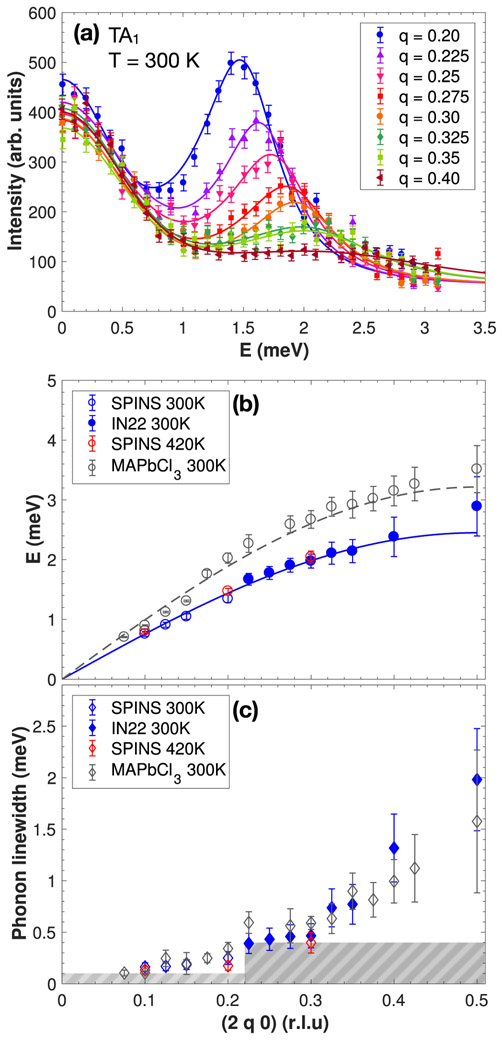
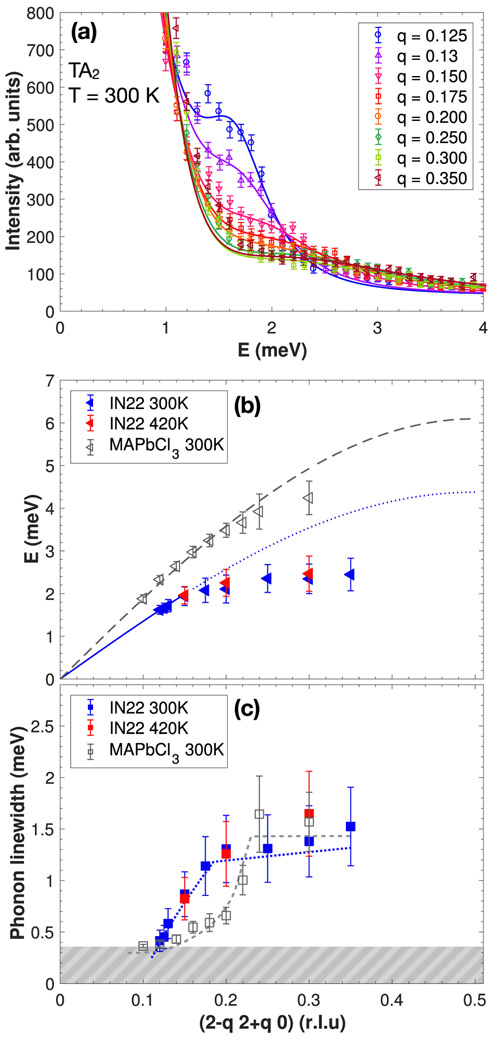
Acoustic phonons were mapped out in the (H K 0) scattering plane and we report in this section anomalies found in the phonon dispersion at particular points of the Brillouin zone. The phonon dispersions were measured in both the orthorhombic and cubic phases at 300 K and 420 K, respectively, around the (2 0 0) and (2 2 0) Bragg positions in the [2 q 0] and [2 – q 2 + q 0] directions. These correspond to the directions from the Γ zone center point towards the X and M Brillouin zone boundary symmetry points, as shown in Fig. 1(a). Dispersions in both directions were measured on the thermal triple-axis spectrometer IN22 (ILL) and were extended to low momentum transfer, to approach the q → 0 limit, on the cold-triple-axis spectrometer SPINS (NIST) in the [2 q 0] direction. The [2 – q 2 + q 0] direction is not reachable with cold neutrons due to kinematic constraints of neutron scattering. Figures 2(a) and 3(a) show constant-Q scans in the [2 q 0] and [2 – q 2 + q 0] directions, respectively, at T = 300 K, measured on IN22 with thermal neutrons. Harmonic phonon modes can be observed and show a dependence on momentum transfer. The phonon energy position ω0 could be extracted as a function of q by fitting the experimental data using a damped harmonic oscillator model and a constant background:
where [1 + n(ω)] is the Bose factor, I0 is a constant, and γ0 is the phonon energy linewidth related to the phonon lifetime via . The above expression of the neutron scattering cross section takes into account both neutron energy gain and loss and obeys detailed balance [32]. The elastic scattering was fitted to a Gaussian centered around E = 0 with a width fixed to the instrument resolution extracted from vanadium incoherent scattering.
FIG. 2.
(a) Constant-Q cuts through the acoustic phonon TA1 for several Q positions from the (2 0 0) Bragg peak towards the X point. (b) Dispersion curves associated to the TA1 mode towards the X point. The data is compared to the organic-inorganic compound CH3NH3PbCl3 in its cubic phase (gray circles, from Ref. [1]). The blue and gray dashed lines are a fit to a sine function performed near the q → 0 limit. (c) Q dependence of the TA1 phonon linewidths extracted from the constant-Q cuts as described in the text and compared to the phonon linewidth for CH3NH3PbCl3 (gray diamonds, from Ref. [1]). The gray dashed areas represent the instrumental resolution of SPINS (q < 0.22) and IN22 (q > 0.22).
FIG. 3.
(a) Constant-Q cuts through the acoustic phonon TA2 for several Q positions from the (2 2 0) Bragg peak towards the M point. (b) Dispersion curves associated with the TA2 mode towards the M point. The data is compared to the organic-inorganic compound CH3NH3PbCl3 in its cubic phase (gray triangles, from Ref. [1]). The blue and gray dashed lines are a fit to a sine function performed near the q → 0 limit. (c) Q dependence of the TA2 phonon linewidths extracted from the constant-Q cuts as described in the text and compared to the phonon linewidth for CH3NH3PbCl3 (gray squares, from Ref. [1]). The blue and gray dashed lines are a guide to the eye. The gray dashed area represents the instrumental resolution of IN22.
Figures 2(b) and 3(b) show the resulting dispersions from the zone center Γ to the X zone boundary (TA1 mode) and Γ to M (TA2 mode), respectively. Near the (2 0 0) and (2 2 0) zone centers, the phonons were found to be well defined in energy and momentum. A direct comparison with the phonon dispersion in the organic-inorganic counterpart CH3NH3PbCl3 in each direction (taken from [1]), measured on the IN22 spectrometer and extracted following the same fitting procedure, is shown in gray. At low momentum transfer, near the q → 0 limit, the dispersion curves were fitted to a sine function in order to extract the elastic constants C44 from the TA1 mode and (C11 – C22)/2 from the TA2 mode. Table I summarizes the extracted elastic constant values along with a comparison with the chlorine counterpart and the hybrid compound CH3NH3PbCl3. The elastic constants for our Br variant are generally lower than the Cl and organic-inorganic compounds. Given the larger size of Br, the decrease may be attributed to an increase in lattice constants. It can be noted that no clear change in the dispersion curves occurs between 300 K and 420 K on the energy scale (~ THz) probed with neutron scattering. The temperature dependence of the lattice dynamics will be discussed later. Moreover, the TA2 mode becomes significantly flat, dispersing little in energy towards the M zone boundary.
TABLE I.
Comparison of elastic constants extracted from ultrasound measurements in the cubic phase for CsPbCl3 and neutron inelastic measurements in the cubic phase for CsPbBr3 and MAPbCl3 (MA = CH3NH3).
While acoustic phonons are well defined near the zone center with γ0 < ω0, they become much broader in energy towards the zone boundaries, indicative of a shortened lifetime. The phonon linewidth was extracted as a function of q and shows a shorter lifetime for smaller wavelength excitations, as shown in Figs. 2(c) and 3(c). The effect is the most dramatic for the TA2 phonon mode, towards the M point as phonons could not be observed above q = 0.35. This feature was also reported in CsPbCl3 [22]. As shown in gray, the momentum dependence of the acoustic linewidth is also very similar to the organic-inorganic hybrid perovskite CH3NH3PbCl3 [1] near the zone boundary. At the momentum transfers near the zone center, the linewidth enters the resolution of the spectrometer and higher resolution probes are required to investigate the phonon lifetime in this region of momentum.
IV. TEMPERATURE DEPENDENCE
A. Static properties
A temperature dependence study was carried out to characterize the different structural transitions in CsPbBr3. The intensity of the elastic superlattice reflections at the X point , M point , and R point was measured as a function of temperature on the IN22, BT4, and SPINS spectrometers, respectively. New nuclear Bragg peaks appear at all three zone boundaries, implying a doubling of the unit cell along the crystallographic directions on entering the tetragonal and orthorhombic phases from the high temperature cubic phase. As shown in Fig. 1(b), a sudden jump in the intensity occurs at the M point around T = 410 K when the unit cell transforms from cubic to tetragonal. When entering the low-temperature orthorhombic phase around T = 360 K, superlattice intensities simultaneously appear at the X and R points. While the discontinuous evolution of the intensity at the M point suggests a first-order transition, the intensity at the X and R points seems to follow a second-order transition, as previously reported in Refs. [2,23].
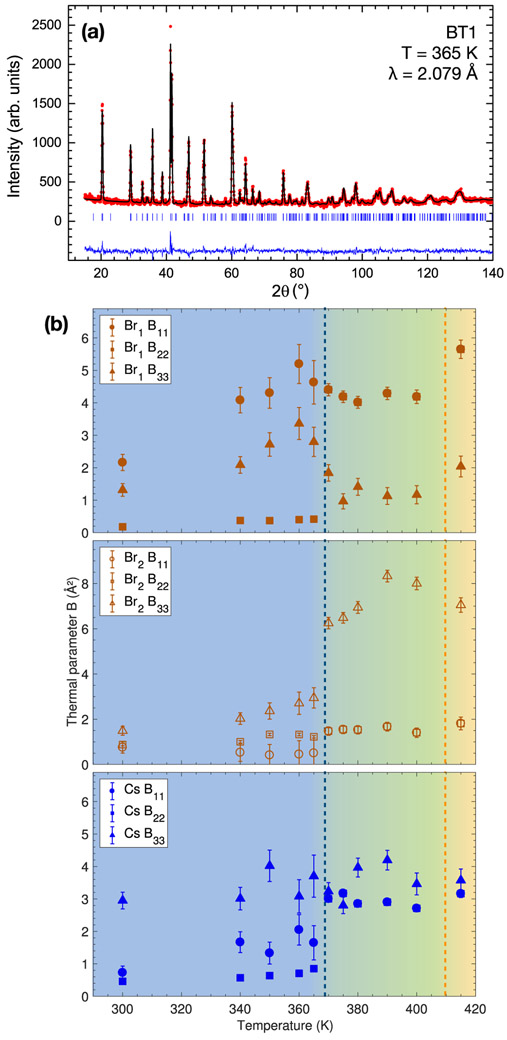
Previous work on CsPbCl3 analyzing the structure found irregular behavior on the Cs and Cl sites which could be modelled as either an anomalously large thermal parameter [33] or site disorder [34]. Following this, we have carried out an analysis of the temperature dependence of the thermal parameters for CsPbBr3 using powder neutron diffraction (Fig. 4) and synchrotron x-ray diffraction. The refined values, as a function of temperature, for the components of the thermal parameters along the three directions in space (B11, B22, and B33) for Br and Cs are displayed in Fig. 4(b) and are illustrated in real space in Fig. 5. The blue ellipsoids in the left panels of Fig. 5 represent thermal displacements of the Cs ions in the tetragonal and orthorhombic phases and the right panels show the octahedral tiltings associated with both structural transitions. It should be noted that the powder diffraction data showed a slightly different temperature for the transition from the tetragonal to orthorhombic phase (found around 365 K), compared to the single crystal sample (360 K). Like in CsPbCl3, the thermal parameters values are anomalously large for the Br and Cs sites across all temperatures.
FIG. 4.
(a) Powder neutron diffraction data performed on BT1 (λ = 2.079 Å) at T = 365 K. The red dots and black line represent the measured and calculated intensities, respectively. The blue tick marks indicate the calculated reflections and the blue line represents the difference between measured and calculated intensities. (b) Thermal parameters for the three spatial components associated with the Br1, Br2, and Cs sites, respectively, as a function of temperature. The colored areas and dashed lines indicate the tetragonal and orthorhombic transitions.
FIG. 5.
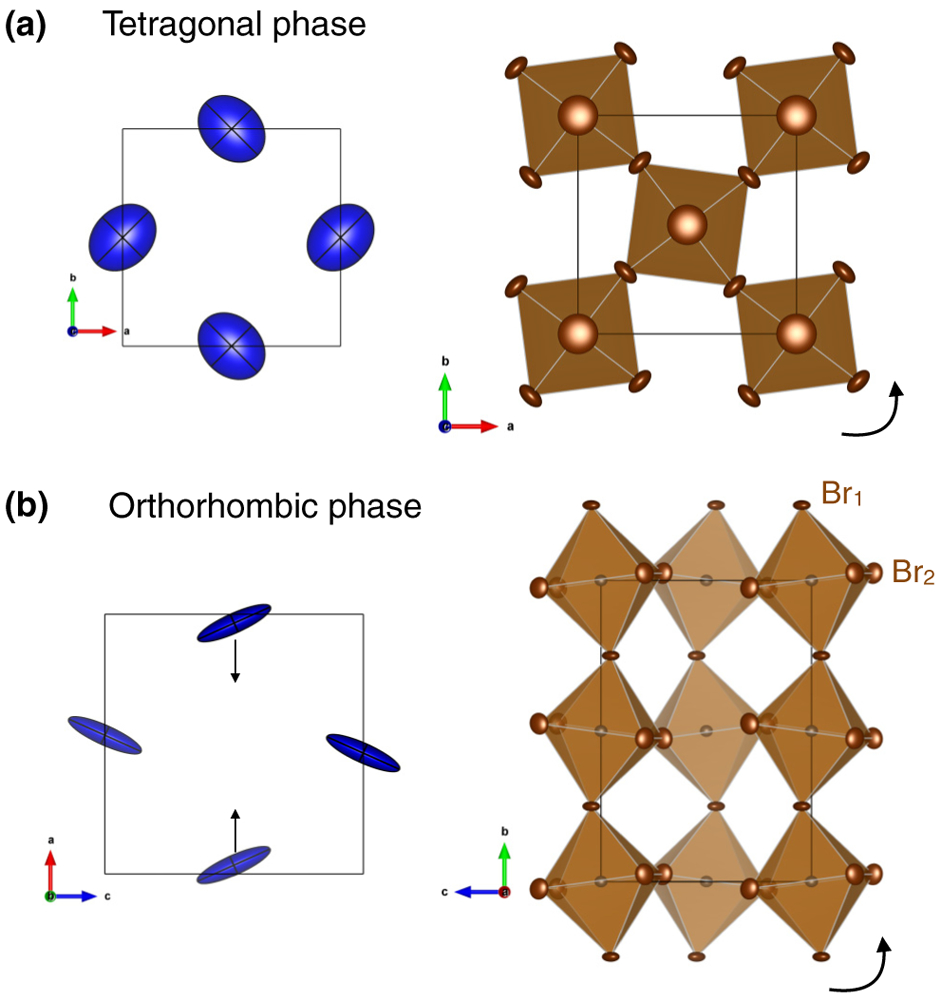
(a),(b) Thermal displacements of Cs ions (blue ellipsoids) and PbBr6 octahedra tiltings (right panels) in the tetragonal and orthorhombic phases, respectively. The arrows indicate atomic displacements and octahedral rotations.
In the cubic phase, Fig. 4(b) (bottom panel) shows that the Cs motions are quasi-isotropic while the Br motions (top and middle) are large and anisotropic in comparison, as also previously reported in Ref. [33] for CsPbCl3. When going through the tetragonal and orthorhombic transition however, the Cs site also becomes anisotropic as indicated by the elongated shapes of the thermal ellipsoids in Fig. 5. Moreover, as illustrated in Fig. 5(b), the results also show an off-center rearrangement of the A-site cation in the low-temperature phase, indicated by the arrows. The shape and orientation of the ellipsoids representing the Cs thermal displacements follows the PbBr6 octahedra tilting in both tetragonal and orthorhombic phases, which suggests a strong coupling between the A-site cation and the halogen anions, as discussed later.
B. Lattice dynamics
The temperature evolution of the lattice dynamics was also investigated. As mentioned and shown in Figs. 2 and 3, no clear change in the phonon dispersion curves for CsPbBr3 between the high-temperature cubic phase and the low-temperature orthorhombic phase was observed near the zone center. This contrasts with the case of CH3NH3PbCl3 where the elastic constants, and hence the acoustic phonon dispersion, shows a discontinuity at the low temperature structural transitions [1]. This may be indicative of an underlying ferroelastic character as suggested by ultrasound measurements [35].
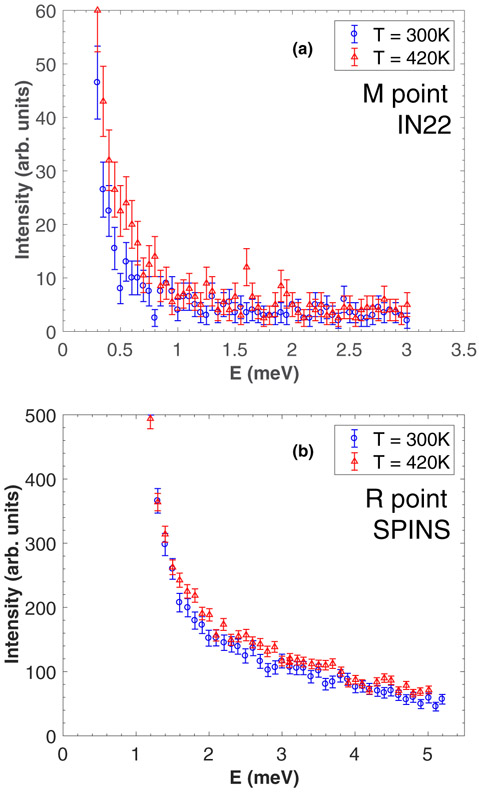
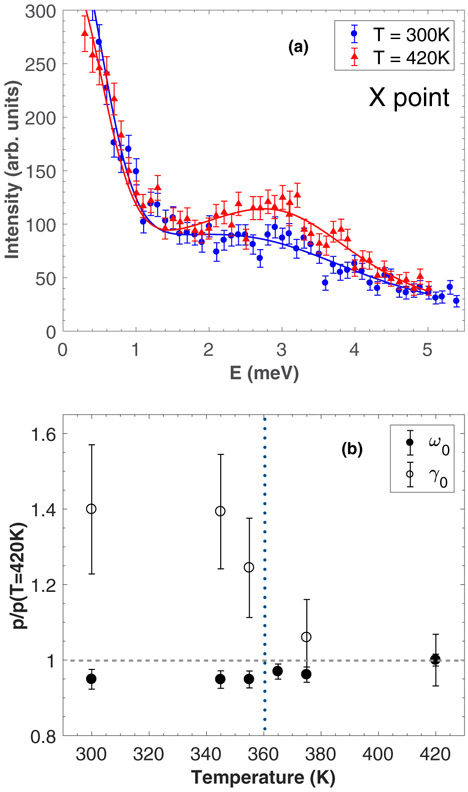
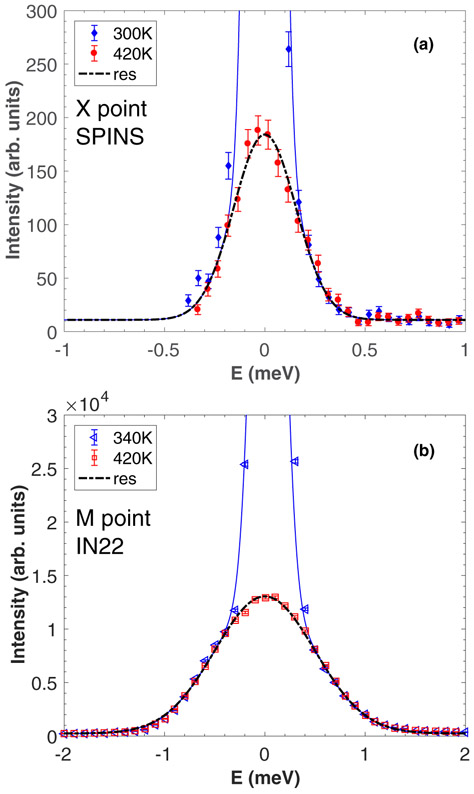
We now discuss the temperature dependence at the X and M zone boundaries, through the two structural transitions. Figures 6(a)-6(b) and 7(a) show constant-Q scans at the M, R, and X points, respectively, in the cubic (T = 420 K) and orthorhombic (T = 300 K) phases. While the acoustic phonons remain unobservable at the M and R points in both phases, the TA1 phonon shows a broadening at the X point when cooling into the orthorhombic phase. As also reported in CsPbCl3 [22], the presence of highly damped phonons around the M and R points does not allow for a direct measurement of the soft modes at these zone boundaries throughout the transitions. Figure 7(b) displays the relative change in linewidth γ0 and energy position ω0 of the TA1 mode, starting from the high temperature phase (set as the reference) and cooling down towards 300 K. With decreasing temperature, the TA1 mode seems to soften very slightly while there is a clear increase in the phonon linewidth when entering the orthorhombic phase, indicating a shortening of the phonon lifetime.
FIG. 6.
(a) Constant-Q cuts through the TA1 mode at the M point measured on IN22 at 300 K and 420 K. (b) Constant-Q cuts through the TA1 mode at the R point measured on SPINS at 300 K and 420 K.
FIG. 7.
(a) Constant-Q cuts through the TA1 mode at the X point measured on IN22 at 300 K (orthorhombic phase) and 420 K (cubic phase). (b) Temperature dependence of the energy position (black circles) and the energy linewidth (white circles) of the TA1 phonon at the X zone boundary. The vertical dashed line indicates the orthorhombic transition.
We now discuss the relaxational scattering around E = 0 meV for the three zone boundaries X , M , and R . Energy scans were carried out as a function of temperature, using the cold triple-axis spectrometer SPINS for the measurements at the R and X points [Figs. 8(a) and 9(a), respectively] and the thermal triple-axis spectrometer IN22 for the measurements at the M point [Fig. 9(b)]. At the X and M zone boundaries, the data shows a rapid increase in the intensity when decreasing the temperature, while the width in energy remains resolution limited. It should be noted that the low temperature data corresponds to the appearance of new Bragg peaks, with resolution tied to the instrumental Bragg resolution which is much narrower than the resolution extracted from the incoherent signal of vanadium as shown with the black dashed line. In contrast, at the R point, critical dynamic fluctuations beyond the instrumental resolution could be observed above the tetragonal-to-orthorhombic phase transition.
FIG. 8.
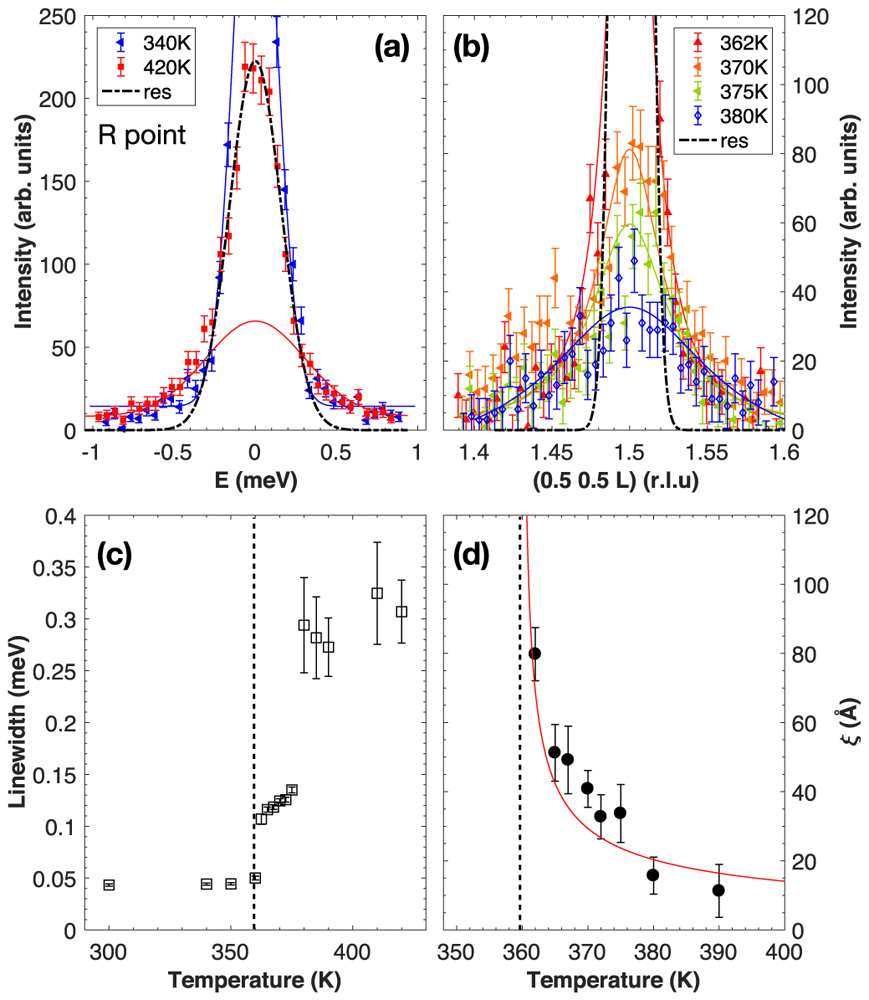
(a) Energy scans measured on SPINS at the R point in the cubic and orthorhombic phases. The black dashed line indicates the instrumental energy resolution, extracted from the incoherent signal of vanadium. (b) Elastic scans measured on SPINS at the R point at several temperatures. The black dashed line shows the Bragg instrumental resolution in momentum. (c) Temperature dependence of the energy linewidth extracted from the quasi-elastic scans at the R point. (d) Temperature dependence of the spatial correlation (inverse of the momentum linewidth) extracted from the elastic scans at the R point. The vertical dashed line indicates the temperature transition to the orthorhombic phase.
FIG. 9.
(a),(b) Energy scans measured on SPINS and IN22 at the X and M points, respectively, in the cubic and orthorhombic phase.
In order to parametrize the observed neutron scattering cross section, the experimental data was fitted to the sum of a Gaussian with width fixed to the experimental resolution derived from the incoherent scattering from vanadium (shown with black dashed lines) and a second narrower Gaussian function. Figure 8(c) shows the temperature evolution of the extracted energy linewidth. In particular, the linewidth shows a first jump when decreasing temperature from the cubic to the tetragonal phase. Then, when the system enters the orthorhombic phase, the linewidth further decreases and reaches a minimum value corresponding to the Bragg resolution while the intensity increases. The presence of critical fluctuations in energy is concomitant with a narrowing in momentum as observed with elastic transverse scans shown in Fig. 8(b) when decreasing temperature. The elastic scattering which is broad in momentum above the cubic phase, progressively sharpens along with an increase in intensity, indicating a critical divergence of the dynamic correlation length. The temperature dependence of the correlation length ξ was extracted by fitting the elastic data with a Lorentzian of the form:
| (1) |
where I0 is a constant, γ = 1/ξ is the inverse of the real-space correlation length, and q is the length of the wave vector measured from the position. The spatial correlation length, plotted as a function of temperature in Fig. 8(d), shows a divergence when going towards the orthorhombic transition at T = 360 K, as indicated by the dashed line. A power-law fit of the correlation length, following a mean-field analysis, as a function of temperature using a form was also performed (shown with the red line) and gave an exponent of ν = −0.53 ± 0.06, close to the exact value predicted from mean field theory [36].
V. DISCUSSION
A. Energy broadening of the TA2 mode
We first address the significant energy broadening of the phonons towards the M zone boundary of the TA2 phonon mode. Temporally broad acoustic phonons have also been reported for the hybrid organic-inorganic halide perovskites CH3NH3PbCl3[1] and CH3NH3PbI3[14] and attributed to the molecular dynamics [11,12] strongly affecting the acoustic phonon modes through hydrogen bonding. It was further suggested [14], with lattice dynamics calculations, that these anharmonic effects are due to low-energy optical phonon modes arising from the organic cation. The resulting short mean free path of the phonon resulting from this damping was suggested to be the origin of the ultra-low thermal conductivity in this compound.
Figures 2 and 3 illustrate that this same phonon damping is present in CsPbBr3, even without the presence of an organic molecule. However, in the case of CsPbBr3, the powder diffraction data presented in Fig. 4 shows large anisotropic Cs and Br motions in both the tetragonal and orthorhombic phases. These anisotropic Cs displacements respond in concert with octahedra tilting, suggestive of a strong coupling between the A cation and the halogen anions. The large anisotropic displacements on the A site may, in turn, damp tilt modes of the PbBr6 octahedra manifesting as energy broadening near the M zone boundary. As discussed below, this is consistent with the structure factors of neutron scattering [22,37] and is supported by calculations [26-28] on a series of fully inorganic lead halide perovskites, which have reported anharmonic fluctuations, including octahedral tilting. In particular, Refs. [27,38] stress the importance of the coupling between the Cs+ displacements and the tilt distortions in order to explain the dynamical instabilities in the high and intermediate temperature phases.
While the energy widths of the acoustic phonons are similar in CsPbBr3 and CH3NH3PbCl3, there are some differences between the organic and inorganic perovskite variants. Contrary to the organic compound, the TA1 and TA2 phonon linewidths in CsPbBr3, near the zone center, do not show any measurable change in temperature (on the THz scale) while the organic variant shows a broadening of the long wavelength acoustic phonons in the intermediate tetragonal phase. This additional temperature dependent broadening may be the result of the molecular motion and this indeed has been suggested by Raman scattering (at Q → 0 probe) with the observation of an “amplitudon” mode in the organic variant [39]. Therefore, the effects of the organic molecule may be dominant for long wavelength dynamics sampled through phonons near the zone center rather than the zone boundary.
B. Temperature dependent dynamics and statics near the zone boundaries
The structural transitions in the lead halide perovskite compounds CsPb(Cl,Br)3 were previously studied by neutron scattering [2,22,23] and confirmed by our diffraction results in Fig. 1. CsPbCl3 exhibits three transitions while the Br counterpart undergoes only two with a cubic to tetragonal transition at ~400 K and an orthorhombic unit cell forming below 360 K. Group theory analysis [2] predicts that in CsPbBr3, the higher temperature transition is caused by the condensation of the M3 mode at the M point . The second transition is associated with the R point in the cubic Brillouin zone which transforms into the Z point of the tetragonal Brillouin zone. We note that both R and X points of the cubic lattice are equivalent in the tetragonal phase and hence show simultaneous superlattice reflections. The R25 mode associated with the R point splits into a Z1 mode and a doubly degenerate Z9 mode. It is predicted that the transition is driven by a softening of the Z9 modes which are based on the motions of both the Cs and Br ions.
As discussed in Ref. [23], and in relation to neutron scattering structure factors in [37,40], the M point involves the tilting of the PbCl6 octahedra around the [0 0 1] cubic axis [also shown in the right panel of Fig. 5(a)], while the R point [measured in the (H H L) scattering plane] involves displacive distortions of the octahedra accompanied with the displacement of Cs ions. The A-site Cs motions may explain the critical scattering (on the THz frequency scale) observed at the point and presented in Figs. 8(a)-8(d), yet simultaneously not measurable at the point. While both QR and QX are the same zone boundary (termed Z) in the tetragonal phase, they are different momentum points with QX having an identical zero structure factor for the Cs site while the Cs A-site motion gives a nonzero neutron structure factor at QR. This is consistent with the group theory analysis outlined above and the powder diffraction data shown in Fig. 4.
Our temperature dependent results are consistent with critical fluctuations of the Cs A site and Fig. 8(c) illustrates two steps suggestive of Cs dynamics in both the high temperature cubic phase and the intermediate tetragonal phase. This is supported by theoretical work [27] highlighting the importance of displacive A-site motion and its coupling to octahedra tilt modes. Concurrently, we note that dynamic critical fluctuations are not observable in CH3NH3PbCl3 [1] at the M and X zone boundaries but show a sudden increase of resolution limited Bragg peaks. This may indicate that the transitions in the inorganic variants is dominated by a coupling to relaxational dynamics rather than displacive [41-44]. This later point requires further study with higher resolution techniques.
The comparison between the organic-inorganic perovskites and the fully inorganic variants indicates a strong coupling between the A site and the tilt distortions, even in the absence of hydrogen bonding. It also appears that the influence of the A site, either disordered or strongly fluctuating, is ubiquitous to the lead halide perovskites. This in turn results in highly damped acoustic phonon fluctuations and may explain the apparently universal low thermal conductivity found both in fully inorganic [16] and organic-inorganic lead halide perovskites [14].
VI. CONCLUSION
We report short acoustic phonon lifetimes in the fully inorganic CsPbBr3. The phonon lifetimes are similar to organic variants, indicating that the presence of an organic molecule on the A site and the resulting hydrogen bonding are not crucial for large damping to appear in a large part of the Brillouin zone.
ACKNOWLEDGMENTS
We acknowledge funding from the EPSRC, STFC, and Carnegie Trust for the universities of Scotland. The work was also supported by the Natural Sciences and Engineering Research Council of Canada (NSERC, Grant No. 203773) and the U.S. Office of Naval Research (Grant No. N00014-16-1-3106). We acknowledge the support of the National Institute of Standards and Technology, U.S. Department of Commerce, in providing the neutron research facilities used in this work.
References
- [1].Songvilay M, Bari M, Ye Z-G, Xu G, Gehring PM, Ratcliff WD, Schmalzl K, Bourdarot F, Roessli B, and Stock C, Phys. Rev. Materials 2, 123601 (2018). [DOI] [PMC free article] [PubMed] [Google Scholar]
- [2].Hirotsu S, Harada J, and Iizumi M, J. Phys. Soc. Jpn 37, 1393 (1974). [Google Scholar]
- [3].Babin V, Fabeni P, Nikl M, Pazzi GP, Sildos I, Zazubovich N, and Zazubovich S, Chem. Phys. Lett 314, 31 (1999). [Google Scholar]
- [4].Stoumpos CC, Malliakas CD, Peters JA, Liu Z, Sebastian M, Chasapis TC, Wibowo AC, Chung DY, Freeman AJ, Wessels BW, and Kanatzidis MG, Cryst. Growth Des 13, 2722 (2013). [Google Scholar]
- [5].Kondo S, Suzuki K, Saito T, Asada H, and Nakagawa H, Phys. Rev. B 70, 205322 (2004). [Google Scholar]
- [6].Ramade J, Andriambariarijaona LM, Steinmetz V, Goubet N, Legrand L, Barisien T, Bernardot F, Testelin C, Lhuillier E, Bramati A, and Chamarro M, Appl. Phys. Lett 112, 072104 (2018). [DOI] [PubMed] [Google Scholar]
- [7].Du X, Wu G, Cheng J, Dang H, Ma K, Zhang Y-W, Tan P-F, and Chen S, RSC Adv. 7, 10391 (2017). [Google Scholar]
- [8].Leguy AMA, Frost JM, McMahon AP, Sakai VG, Kockelmann W, Law C, Li X, Foglia F, Walsh A, O’Regan BC, Nelson J, Cabral JT, and Barnes PRF, Nat. Commun 6, 7124 (2015). [DOI] [PMC free article] [PubMed] [Google Scholar]
- [9].Egger DA, Rappe AM, and Kronik L, Acc. Chem. Res 49, 573 (2016). [DOI] [PMC free article] [PubMed] [Google Scholar]
- [10].Saparov B and Mitzi DB, Chem. Rev 116, 4558 (2016). [DOI] [PubMed] [Google Scholar]
- [11].Brown KL, Parker SF, Garcia IR, Mukhopadhyay S, Sakai VG, and Stock C, Phys. Rev. B 96, 174111 (2017). [Google Scholar]
- [12].Swainson IP, Stock C, Parker SF, Van Eijck L, Russina M, and Taylor JW, Phys. Rev. B 92, 100303(R) (2015). [Google Scholar]
- [13].Ferreira AC, Létoublon A, Paofai S, Raymond S, Ecolivet C, Rufflé B, Cordier S, Katan C, Saidaminov MI, Zhumekenov AA, Bakr OM, Even J, and Bourges P, Phys. Rev. Lett 121, 085502 (2018). [DOI] [PubMed] [Google Scholar]
- [14].Gold-Parker A, Gehring P, Skelton J, Smith IC, Parshall D, Frost JM, Karunadasa HI, Walsh A, and Toney MF, PNAS 115, 11905 (2018). [DOI] [PMC free article] [PubMed] [Google Scholar]
- [15].Egger DA, Bera A, Cohen D, Hodes G, Kirchartz T, Kronik L, Lovrincic R, Rappe A, Reichnman DR, and Yaffe O, Adv. Mater 30, 1800691 (2018). [DOI] [PubMed] [Google Scholar]
- [16].Lee W, Li H, Wong AB, Zhang D, Lai M, Yu Y, Kong Q, Lin E, Urban JJ, Grossman JC, and Yang P, PNAS 114, 8693 (2017). [DOI] [PMC free article] [PubMed] [Google Scholar]
- [17].Eperon GE, Paternò M, Sutton RJ, Zampetti A, Haghighirad AA, Cacialli F, and Snaith HJ, J. Mater. Chem. A 3, 19688 (2015). [Google Scholar]
- [18].Ramasamy P, Lim DH, Kim B, Lee SH, Lee MS, and Lee JS, Chem. Commun 52, 2067 (2016). [DOI] [PubMed] [Google Scholar]
- [19].Yantara N, Bhaumik S, Sabba D, Dewi HA, Mathews N, Boix PP, Demir HV, and Mhaisalkar S, J. Phys. Chem. Lett 6, 4360 (2015). [DOI] [PubMed] [Google Scholar]
- [20].Kulbac M, Cahen D, and Hodes G, J. Phys. Chem. Lett 6, 2452 (2015). [DOI] [PubMed] [Google Scholar]
- [21].Long H, Peng X, Lin K, Xie L, Lu J, Zhang B, Ying L, and Ewi Z, Appl. Phys. Express 12, 052003 (2019). [Google Scholar]
- [22].Fujii Y, Hoshino S, Yamada Y, and Shirane G, Phys. Rev. B 9, 4549 (1974). [Google Scholar]
- [23].Hua GL, Phys J.: Condens. Matter 3, 1371 (1991). [Google Scholar]
- [24].Hirotsu S, Suzuki T, and Sawada S, J. Phys. Soc. Jpn 43, 575 (1977). [Google Scholar]
- [25].Hirotsu S and Suzuki T, J. Phys. Soc. Jpn 44, 1604 (1978). [Google Scholar]
- [26].Yang RX, Skelton JM, Lora da Silva E, Frost J, and Walsh A, J. Phys. Chem. Lett 8, 4720 (2017). [DOI] [PubMed] [Google Scholar]
- [27].Bechtel JS and Van der Ven A, Phys. Rev. Materials 2, 025401 (2018). [Google Scholar]
- [28].Marronnier A, Lee H, Geffroy B, Even J, and Bonnassieux Y, J. Phys. Chem. Lett 8, 2659 (2017). [DOI] [PubMed] [Google Scholar]
- [29].Izumi F and Momma K, Solid State Phenomena 130, 15 (2007). [Google Scholar]
- [30].Rodriguez-Carvajal J, Physica B 192, 55 (1993). [Google Scholar]
- [31].Dove MT, Introduction to Lattice Dynamics (Cambridge University Press, Cambridge, 1993). [Google Scholar]
- [32].Shirane G, Shapiro SM, and Tranquada JM, Neutron Scattering with a Triple-Axis Spectrometer (Cambridge University Press, Cambridge, 2004). [Google Scholar]
- [33].Harada J, Sakata M, Hoshino S, and Hirotsu S, J. Phys. Soc. Jpn 40, 212(1976). [Google Scholar]
- [34].Møller CK, Mat. Fys. Medd. Dan. Vid. Selsk 32, 2 (1959). [Google Scholar]
- [35].Harwell JR, Payne JL, Sajjad MT, Heutz FJL, Dawson DM, Whitfield PS, Irvine JTS, Samuel IDW, and Carpenter MA, Phys. Rev. Materials 2, 065404 (2018). [Google Scholar]
- [36].Collins MF, Magnetic Critical Scattering (Oxford University Press, New York, 1989). [Google Scholar]
- [37].Lynn JW, Patterson HH, Shirane G, and Wheeler RG, Solid State Commun. 27, 859 (1978). [Google Scholar]
- [38].Yaffe O, Guo Y, Tan LZ, Egger DA, Hull T, Stoumpos CC, Zheng F, Heinz TF, Kronik L, Kanatzidis MG, Owen JS, Rappe AM, Pimenta MA, and Brus LE, Phys. Rev. Lett 118, 136001 (2017). [DOI] [PubMed] [Google Scholar]
- [39].Guo Y, Yaffe O, Paley D, Beecher A, Hull T, Szpak G, Owen J, Brus L, and Pimenta M, Phys. Rev. Materials 1, 042401(R) (2017). [Google Scholar]
- [40].Gesi K, Axe J, Shirane G, and Linz A, Phys. Rev. B 5, 1933 (1972). [Google Scholar]
- [41].Shapiro SM, Axe J, Shirane G, and Riste T, Phys. Rev. B 6, 4332 (1972). [Google Scholar]
- [42].Shirane G and Yamada Y, Phys. Rev 177, 858 (1969). [Google Scholar]
- [43].Shirane G, Cowley RA, Matsuda M, and Shapiro SM, Phys. Rev. B 48, 15595 (1993). [DOI] [PubMed] [Google Scholar]
- [44].Halperin BI and Varma CM, Phys. Rev. B 14, 4030 (1976). [Google Scholar]


