Abstract
Cardiac mechanical function is supported by ATP hydrolysis, which provides the chemical-free energy to drive the molecular processes underlying cardiac pumping. Physiological rates of myocardial ATP consumption require the heart to resynthesize its entire ATP pool several times per minute. In the failing heart, cardiomyocyte metabolic dysfunction leads to a reduction in the capacity for ATP synthesis and associated free energy to drive cellular processes. Yet it remains unclear if and how metabolic/energetic dysfunction that occurs during heart failure affects mechanical function of the heart. We hypothesize that changes in phosphate metabolite concentrations (ATP, ADP, inorganic phosphate) that are associated with decompensation and failure have direct roles in impeding contractile function of the myocardium in heart failure, contributing to the whole-body phenotype. To test this hypothesis, a transverse aortic constriction (TAC) rat model of pressure overload, hypertrophy, and decompensation was used to assess relationships between metrics of whole-organ pump function and myocardial energetic state. A multiscale computational model of cardiac mechanoenergetic coupling was used to identify and quantify the contribution of metabolic dysfunction to observed mechanical dysfunction. Results show an overall reduction in capacity for oxidative ATP synthesis fueled by either fatty acid or carbohydrate substrates as well as a reduction in total levels of adenine nucleotides and creatine in myocardium from TAC animals compared to sham-operated controls. Changes in phosphate metabolite levels in the TAC rats are correlated with impaired mechanical function, consistent with the overall hypothesis. Furthermore, computational analysis of myocardial metabolism and contractile dynamics predicts that increased levels of inorganic phosphate in TAC compared to control animals kinetically impair the myosin ATPase crossbridge cycle in decompensated hypertrophy/heart failure.
Keywords: heart failure, cardiac energetics, mechanoenergetic coupling, transaortic constriction, ejection fraction, computational modeling, cardiomyopathy, mitochondria, oxidative respiration
Graphical Abstract
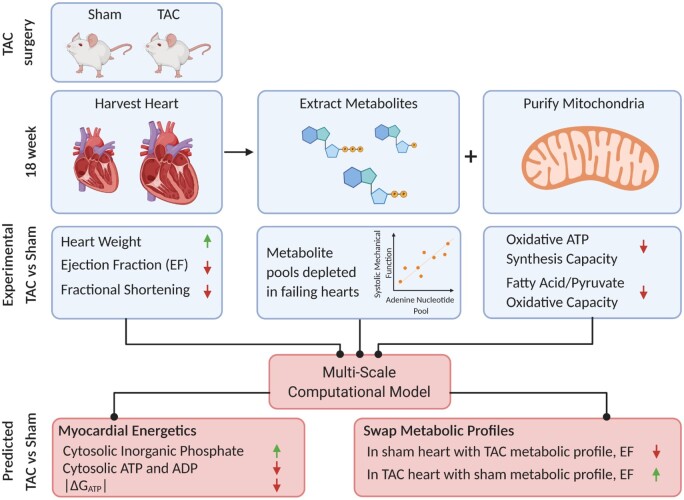
Graphical Abstract.
Introduction
Normal cardiac function requires chemical energy, supplied from oxidative ATP synthesis to meet the demands for mechanical power generation by myosin ATPase and active processes involved in ion handling and cellular homeostasis. In large mammals, under resting conditions, the left ventricle (LV) consumes ATP at a rate of approximately 0.5 mmol sec−1 L−1 of cardiomyocyte.1 This rate means that the total ATP content of the heart (at 5–10 mM) is hydrolyzed and resynthesized several times per minute. In the fasted resting state in humans, the majority (60–80%) of acetyl-CoA supplied to the citric acid cycle is supplied by oxidation of fatty acids and thus roughly 60% of ATP is derived from fatty acid oxidation.2,3 In the fed state and during exercise the fractional contribution from glucose and lactate increases such that more than 50% of ATP is derived from carbohydrate oxidation.2–5
Mirroring the metabolic response to exercise, there is a switch from fatty acid to carbohydrate oxidation in decompensated hypertrophy and heart failure.6 Furthermore, in diseased states, the relationships between cardiac work rate and concentrations of phosphocreatine (CrP) and CrP/ATP ratio are altered.7 The CrP/ATP ratio is lower compared to normal in patients with aortic valve disease8 and dilated cardiomyopathy9,10 and total ATP in myocardium is lower in heart failure patients than in healthy subjects.6,9–11 Although heart failure is a complex syndrome that can arise due to a variety of pathophysiological abnormalities, alterations to the myocardial energetics state (e.g., ATP hydrolysis potential, CrP/creatine [Cr] ratio) are well-established hallmarks of heart failure irrespective of etiology.6,11–17
These changes in phosphate metabolite levels observed in heart disease have been interpreted to necessarily reflect an impairment in mitochondrial function in vivo.18 Indeed, rodent models of decompensation and failure show decrease in oxidation phosphorylation in purified mitochondria.19 Yet, measurements of mitochondrial respiratory capacity from human hearts have yielded conflicting results, including little or no differences in oxidative capacity between failing and non-failing hearts,20 increased capacity in failing hearts,21 and a marked reduction in capacity in failing hearts.22 Computer simulations predict that depletion of cytoplasmic metabolic pool, namely the adenine nucleotide and total creatine pool, plays an under-recognized aspect of energetic dysfunction in aging and hypertrophic decompensation—plays an important role in driving the energetic phenotype.7,23 Analysis of a canine model of pressure overload-induced hypertrophy and failure reveals that this phenomenon explains observations on diminished ATP and CrP/ATP, even without needing to invoke mitochondrial dysfunction.7
While associations between myocardial energy metabolite concentrations and the disease state have been appreciated for some time,9,24,25 mechanistic connections between metabolic and mechanical pump function have not been firmly established.26–28 If indeed impaired cardiac pumping in heart failure is in part a consequence of metabolic derangement, then understanding the underlying mechanisms will be crucial for understanding the natural history of the disease and for developing new therapies. We have developed multiscale computer simulations accounting for coupled metabolism and mechanics to analyze and predict how observed changes in energetic status may impact cardiac pump function.29,30 Based on simulations that integrate crossbridge cycle dynamics with myocardial energy metabolism and a model of the heart that accounts for both the geometry and the mechanical interaction of the ventricle walls and the septum, we predict that changes in the phosphate metabolites that occur in heart failure impair the ability of oxidative phosphorylation to supply ATP at free energy levels necessary for proper mechanical function of the heart.30 Thus, we hypothesize that the resulting changes to the phosphate metabolite levels impair mechanical function of the heart and contribute to the heart failure phenotype. If true, this hypothesis yields a number of questions regarding the role of mechanical-energetic coupling in heart failure:
How are changes in cardiac power output that occur in heart failure influenced by the energetic status of the myocardium—specifically, the concentrations of ATP, ADP, and inorganic phosphate (Pi) and the free energy of ATP hydrolysis?
How do changes in metabolite pools and potential changes in mitochondrial oxidative capacity contribute to the energetic phenotype in vivo in heart failure?
What are the relationships between the energetic and mechanical states in vivo?
To test our hypothesis and to answer these questions, the goals of this study were to test and refine these predictions by (1) quantifying relationships between mechanical function and the metabolic/energetic status of the myocardium in the normal versus failing heart; (2) using those data to identify a computer model of cardiac mechanoenergetic coupling; (3) using the model to determine how changes in energetic state affect mechanical function in heart failure; (4) probing molecular mechanisms underlying depletion of metabolite pools in heart failure; and finally, (5) predicting strategies for restoring mechanical function by targeting metabolism in heart failure.
We adopted the transverse aortic constriction (TAC) model of Doenst et al.19 to obtain rats with pressure overload-induced hypertrophy and decompensation. Resting cardiac mechanical functions were assayed by echocardiography, revealing significant decreases in ejection fraction (EF) and fractional shortening (FS) in decompensated/TAC animals compared to sham. Measurements of oxidative capacities reveal reductions in TAC animals compared to sham that is less severe than those reported by Doenst et al. Measurements of metabolite pools reveal reductions in total adenine nucleotides (TAN), total phosphate (TEP), and total creatine (CRtot) similar to those observed in humans with heart failure and large-animal models. Analysis of our data points to an increase in inorganic phosphate, needed to drive ATP synthesis in overcoming reductions in adenine nucleotides and mitochondrial capacity, as playing a primary role in impeding crossbridge kinetics in systole and reducing the magnitude of the ATP hydrolysis potential in failing compared to control hearts. Computer simulations predict that rescuing the metabolic profile of the TAC rats improves mechanical function and increases EF, adding further support to the hypothesis that energetic dysfunction in the myocardium causes mechanical dysfunction in heart failure.
Materials and Methods
Transverse Aortic Constriction
All the protocols involving animals conformed to the National Institutes of Health Guide for the Care and Use of Laboratory Animals and were approved by the University of Michigan Animal Research Committee. Twenty-eight 3-week-old Sprague Dawley male rats underwent a TAC surgery. Under anesthesia (isoflurane), 20 of the rats had a 0.4 mm clip placed on the aortic arch between the right and left carotids (TAC rats) and 8 rats had no clip placed on the aortic arch (sham rats). Eleven of the 20 TAC-operated rats survived to the end of the protocol. Echocardiography was done at Week 1 and 18 postsurgery. At 18 weeks postsurgery, the hearts were excised and perfused with an ice-cold cardioplegia solution (25 mM KCl [P4504; Sigma-Aldrich, Saint Louis, Mo], 100 mM NaCl [S9888; Sigma], 10 mM Dextrose [D9559; Sigma], 25 mM MOPS [M1254; Sigma] 1 mM EGTA [E4378; Sigma], pH 7.15). The right ventricle free wall was separated from the LV and septum. The apex of the LV and septum was used to purify mitochondria and the remainder of the LV and septal tissue was flash frozen and used to measure phosphate metabolites.
Mitochondrial Isolation
The apex of the heart was homogenized using a glass dounce homogenizer at 4°C for 3 minutes in isolation buffer (200 mM Mannitol [M9647; Sigma], 60 mM sucrose [S7903; Sigma], 5 mM KH2PO4 [P5379; Sigma], 5 mM MOPS [M1254; Sigma], 1 mM EGTA [E4378; Sigma], and 3 mg of Nagarse protease [P8038; Sigma]). After 3 minutes, isolation buffer with 0.1% w/w BSA (A6003; Sigma) was added and the homogenate was centrifuged at 8000 × g for 10 min at 4°C. The pellet was resuspended in isolation buffer with BSA and centrifuged at 8000 × g for 10 min at 4°C. The resulting pellet was resuspended in isolation buffer with BSA and centrifuged at 700 × g for 10 min at 4°C. The supernatant was collected and centrifuged at 8000 × g for 10 min. The pellet was resuspended in isolation buffer with BSA and mitochondrial concentration was measured using a citrate synthase (CS) assay as previously published by Oroboros.31 Briefly, purified mitochondria were placed in a solution containing 100 mM Tris pH 8.1 (T1503, Sigma), 0.25% triton X-100 (T8532, Sigma), 0.31 mM acetyl CoA (A2181; Sigma), 0.1 mM DTNB (D218200, Sigma), and 0.5 mM oxaloacetate (04126, Sigma) at 30°C. Immediately, absorbance was measured at a wavelength of 412 nm.
Mitochondrial respiration
Mitochondrial respiration was measured from purified mitochondria using a high resolution Oxygraph O2k (Oroboros Instruments GmbH; Innsbruck, Austria). Mitochondria were added to chambers containing a respiration buffer (90 mM KCl [P4504; Sigma], 5 mM K2HPO4 [P5504; Sigma], 50 mM MOPS [M1254; Sigma], 1 mM EGTA [E4378; Sigma], and 0.1% w/w BSA [A6003; Sigma], pH 7.2). The substrate of choice was added to the chambers (carbohydrate: 5 mM pyruvate [P8574; Sigma], 2 mM malate [M1000; Sigma], and 5 mM NaCl [S9888; Sigma]; fatty acid: 0.010 mM palmitoyl-L-carnitine [PLC; P1645; Sigma], 2 mM malate, and 10 mM NaCl). After mitochondria and substrate were added, 0.5 mM K-ADP (A5285; Sigma) was added to each chamber.
Extraction for Phosphate Metabolites
Frozen LV and septum tissue were pulverized into a fine powder. The powder was homogenized in an ice-cold dounce homogenizer with 2 normal (N) perchloric acid (244252; Sigma) (with 2 mM EDTA [E4884, Sigma]) on ice for 30 s and waited for 60 s before repeating for two additional times. The homogenate was centrifuged at 15 000 × g for 10 min at 4°C to pellet the denatured proteins. The supernatant was transferred to an Eppendorf tube containing ice-cold 10 N KOH (P1767; Sigma) as a 10th of the volume of the supernatant and was neutralized with ice-cold 2 N KOH (with 40 mM TES [T6541; Sigma] and 300 mM KCl [P4504, Sigma]) and/or with 2 N perchloric acid (with 2 mM EDTA). The precipitate was pelleted at 15 000 × g for 10 min at 4°C and the supernatant was stored at −80°C.
Metabolite Measurements
Extracted LV and septal tissue were used to measure AMP, ADP, ATP, inorganic phosphate, creatine, and creatine phosphate.
AMP/ADP Measurement
The assay for AMP and ADP concentration was based on the enzymatic reactions
Extent of these reactions was measured via NADH absorbance at 340 nm. Extracted sample was mixed with a solution containing 0.1 M TEA (90279, Sigma), 30 mM MgSO4 (M7506; Sigma), 120 mM KCl (P4504, Sigma), 0.16 mM phosphoenolpyruvate (PEP; AAB2035806; VWR), 8.25 U lactate dehydrogenase (LDH; L2500; Sigma), and 90 µg of NADH (Calzyme Laboratories, San Luis Obispo, CA). The reaction was catalyzed by adding 4.7 U pyruvate kinase (PK; P1506; Sigma) at room temperature. Once all ADP is consumed, AMP is measured by adding 20 µg of NADH (Calzyme) and 0.049 mM ATP (A2383, Sigma). The reaction is catalyzed by adding 7.2 U of myokinase (MK; M3003; Sigma).
ATP Measurement
The assay for ATP employed the enzymatic reactions
Reaction extent was measured via NADPH absorbance at 340 nm. Extracted sample was mixed with an assay mixture (2X-1 ug/uL NADP+ [Calzyme], 56.8 mM Tris-HCl [T1503, Sigma] with 5 mM MgCl2 solution [M0250; Sigma], and 1 U/uL Glucose-6-Phosphate Dehydrogenase [Calzyme]). The reaction was catalyzed with 10 mM glucose (D9559; Sigma) and 1 U hexokinase (HK; H4502; Sigma) at room temperature.
Creatine/Creatine Phosphate Measurement
The assays for creatine and creatine phosphate were based on the enzymatic reactions:
Creatine and creatine phosphate were measured by the consumption of NADPH measured by absorption at 340 nm at 37°C. Extracted sample was suspended in a working solution (200 mM phosphate buffer [200 mM KH2PO4 (P5504; Sigma) and 200 mM Na2HPO4 (4062-01; JT Baker, Phillipsburg, NJ)], 7 mM MgCl2 (M0250; Sigma), 1.8 mg NADPH (Calzyme), 10 mM of α-ketoglutarate (75892; Sigma), and 2.5 mM ADP (A2754; Sigma) and the reactions were catalyzed by adding 6 U of glutamate dehydrogenase (GLDH; G4387; Sigma), 100 U of urease (U1875; Sigma), and 90 U of creatinase (C2409; Sigma). After creatine is consumed, creatine phosphate was measured by adding 42 U creatine kinase (CK; C3755; Sigma).
Bicinchoninic Acid Protein Assay
Tissue prep and protein extraction were adapted from the Abcam NP-40 Buffer recipe and the NSJ Bioreagents: Western Blot Sample Preparation Protocol. Frozen LV and septum tissue were pulverized into a fine powder in liquid nitrogen. Approximately, 200 mg of powdered heart sample was lysed in 500 µL of lysis buffer (150 mM NaCl, 1.0% triton ×100 [T8532, Sigma], 50 mM Tris pH 8.0, [T1503, Sigma] 14.2 µL per sample of protease inhibitor [5391034, Calbiochem, San Diego, CA]). Lysate was vortexed every 5 min for 30 min and centrifuged at 13 000 x g for 20 min at 4°C. After the supernatant was collected, a small volume of lysate was removed to perform the Thermo Scientific Pierce Bicinchoninic Acid Protein Assay.
Western Blot
A Western blot was done to measure protein abundance after protein homogenate samples were prepared for Western blot with 4× Laemmli buffer (#1610747; BioRad Laboratories, Hercules, CA) at a concentration of 2 µg/µL. Twenty micrograms of protein for each sample were run through a 10% polyacrylamide gel. The protein was transferred onto a nitrocellulose membrane and immunoblotted for the following proteins: NT5c1a (1:500; sc377244; Santa Cruz Biotechnology, Dallas, TX), NT5c2 (1:1000; NBP1-31404; Novus Biologicals, Littleton, CO), NT5c3 (1:500; ab204800; Abcam), AMPD1 (1:1000; NBP2-24509; Novus Biologicals), AMPD3 (1:1000; ab194361; Abcam), and GAPDH (1:500; sc166574; Santa Cruz Biotechnology). The ladder used for all gels is BioRad Precision Plus Protein Kaleidoscope Prestained Protein Standards (#1610375; BioRad). Signal was developed using either Pico (#34580 Thermo Fisher Scientific, Waltham, MA) or ECL (#1705060; BioRad) chemiluminescence and imaged using the BioRad ChemiDoc. Protein abundance was estimated using ImageJ.
Metabolomics Analysis
Metabolites were extracted from frozen pulverized tissue using methanol, chloroform, and water solvent containing labeled internal standards following protocols detailed in Lorenz et al.32,33 LC/MC analysis was performed using an Agilent system consisting of an Infinity Lab II UPLC coupled with a 6545 QTof mass spectrometer (Agilent Technologies, Santa Clara, CA) using a JetStream ESI source in negative mode. Details of the assay are provided in Lorenz et al.33 Identification of metabolites and relative quantification for this platform follows a hybrid targeted/nontargeted approach also detailed in Sato et al.34
A z-score was calculated for each metabolite concentration in the TAC and sham group by subtracting the mean value within-group and dividing by the within-group standard deviation. Metabolites with a relative standard deviation (standard deviation/average) greater than 40% were removed from the dataset. The P-value for comparison of each metabolite level between TAC and sham groups was calculated using GraphPad Prism 8. Comparisons were done between 4 sham and 4 TAC animals, and thus not corrected for multiple comparisons. The Kyoto Encyclopedia of Genes and Genomes (KEGG) metabolic pathway database was used to identify the metabolite compound ID of each metabolite. The KEGG compound ID is used in Metabolite Biological Role (MBROLE) 2.0 to identify significant pathways of the metabolites of interest. A total of 277 metabolites were directly measured with 55 significant metabolites further analyzed with MBROLE 2.0.
Multiscale Modeling of Cardiac Mechanoenergetics and Whole-Body Cardiovascular Function
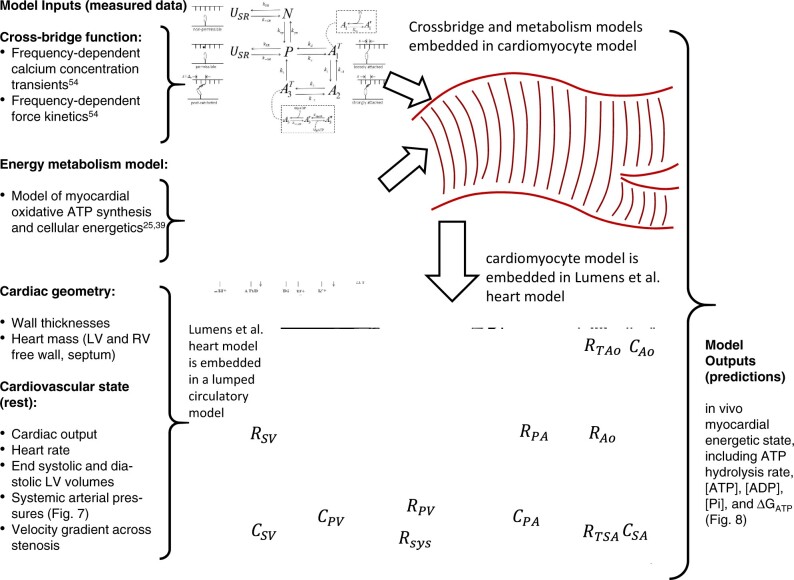
The multiscale modeling approach is summarized in Figure 1, which summarizes individual model components, and data sources for identification of components. The crossbridge and muscle mechanics model was identified to represent rat left-ventricular cardiomyocyte mechanics based on Tewari et al.30 The model for mitochondrial oxidative ATP synthesis was identified from data from mitochondria purified from rat ventricular myocardium.35 The cardiac energetics was parameterized to match data from individual animals based on the oxidative capacity and cytoplasmic metabolite pools obtained from this study. Wall volumes and anatomic parameters associated with the Lumens et al. heart model36 were identified based on anatomical data obtained from echocardiography and ex vivo gross morphological measurements on individual animals. A simple lumped parameter circulatory model was identified based on cardiovascular state variables measured under resting conditions. The resulting integrated model, parameterized for an individual animal, is used to predict the in vivo energetic state of the myocardium under resting conditions in each animal. Furthermore, the integrated model facilitates computer experiments where the metabolic component of the failing phenotype is replaced by normal control metabolism. The resulting model predictions (see below) yield insights into the specific contribution of energetic dysfunction in causing mechanical dysfunction.
Figure 1.
Multiscale Myocardial Mechanoenergetic Function. The model integrates previously developed and validated models of cardiomyocyte dynamics,29,30 myocardial energetics,23,35 whole-organ cardiac mechanics,36 and a simple lumped parameter closed-loop circulatory system representing the systemic and pulmonary circuits. Data from multiple experimental modalities are used to identify model components for each individual animal in this study. Detailed descriptions of model formulation and implementation are provided in Marzban et al.37 The model predicts variables representing the in vivo myocardial energetic state, including ATP hydrolysis rate, [ATP], [ADP], [Pi], and the free energy of ATP hydrolysis DGATP in the LV myocardium for each individual animal.
A complete description with explanation of computer codes for the model is provided in Marzban et al.37
Results
Cardiovascular Phenotype of Pressure-Overload Model
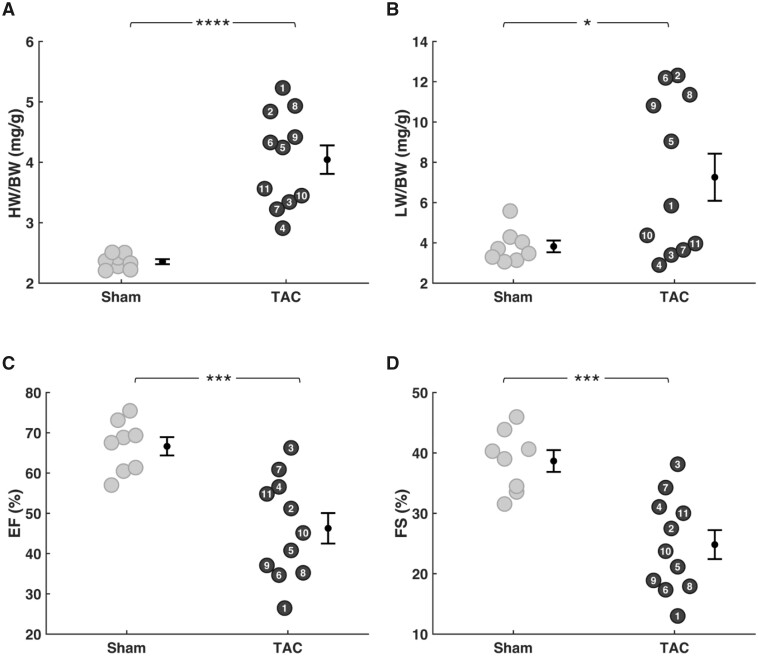
Table 1 reports gross anatomical measurements and cardiac function metrics evaluated from echocardiography at Week 18 postsurgery in TAC rats (n = 11) and sham-operated control (n = 8) rats. The mean mass of the sham-operated control rats (614 ± 18 g) was slightly larger than that of TAC group (551 ± 18 g). There were no significant differences between the groups in average cardiac output or heart rate (assessed under light anesthesia via echocardiography). The average pressure drops across the aortic clip, estimated from the measured velocity gradient,38 was 35 ± 5 mmHg in the TAC group. As expected, this increased afterload resulted in marked cardiac hypertrophy in the TAC group, with an average increase of >70% in heart weight to body weight (HW/BW) ratio at the 18-week endpoint compared to the control (Figure 2A). The lung weight to body weight (LW/BW) ratio also showed a substantial and significant increase in the TAC group compared to control (Figure 2B), indicating cardiac dysfunction and pulmonary congestion. Furthermore, the group average values of EF and FS also point to systolic dysfunction (Figure 2C and D), with EF = 67 ± 2% and FS = 39 ± 5% in the control group and EF = 46 ± 4% and FS = 25 ± 8% in the TAC group (P < .001 for both variables).
Table 1.
Data are mean ± SEM
| Metric | Sham | TAC |
|---|---|---|
| n | 8 | 11 |
| BW (g) | 614 ± 18 | 551 ± 18* |
| LVM (g) | 1.1 ± 0.05 | 1.7 ± 0.05** |
| HR (bpm) | 345 ± 7 | 393 ± 47 |
| EDV (µL) | 417 ± 35 | 525 ± 24* |
| ESV (µL) | 141 ± 18 | 286 ± 28*** |
| SV (µL) | 276 ± 22 | 238 ± 16* |
| EF (%) | 67 ± 2 | 46 ± 4*** |
| FS (%) | 39 ± 5 | 25 ± 8*** |
| CO (mL/min) | 95 ± 7 | 90 ± 9 |
LVM, left ventricular mass; HR, heart rate; EDV, end-diastolic volume; ESV, end-systolic volume; SV, stroke volume; CO, cardiac output.
P < 0.05,
P < 0.01,
P < 0.001, compared to controls.
Figure 2.
Cardiac Hypertrophy and Decompensation in TAC Animals. EF and FS were measured at 18 weeks postsurgery by echocardiography. HW and LW were measured following harvesting the heart and lungs. (A) HW-to-body-weight ratio (HW/BW) and (B) LW-to-body-weight (LW/BW) were normalized to the bodyweight of each rat. Variability in HW and LW was low in sham rats compared to TAC rats. Mean HW/BW and LW/BW were elevated in the TAC group compared to sham group. (C) EF and (D) and FS were both lower in TAC rats compared to sham rats (sham n = 8; TAC n = 11; error bars: SEM; HW/BW P-value: <0.0001; LW/BW P-value: 0.016; EF and FS P-value: 0.0003).
Although the group means for HW/BW, LW/BW, EF, and FS are substantially and significantly different between TAC and control groups, there is substantial variability in the phenotype of the TAC model, as illustrated in Figure 2. While the lowest observed EF and FS values of 27% and 13% (for TAC animal 1) were much lower than the sham control mean values, the highest observed EF and FS values of 66% and 38% (TAC animal 3) were equivalent to the mean control values. Because greatest degree of hypertrophy tended to be associated with the lowest EF and FS values, the HW/BW ratio and EF in the TAC group were correlated (r2 = 0.63). Pulmonary congestion, assessed by LW/BW, was also correlated with HW/BW (r2 = 0.57). This variability in phenotype in the TAC model was therefore used to quantitatively correlate the magnitude of myocardial dysfunction and altered myocardial energetics.
Mitochondrial Function and Myocardial Metabolic Pools
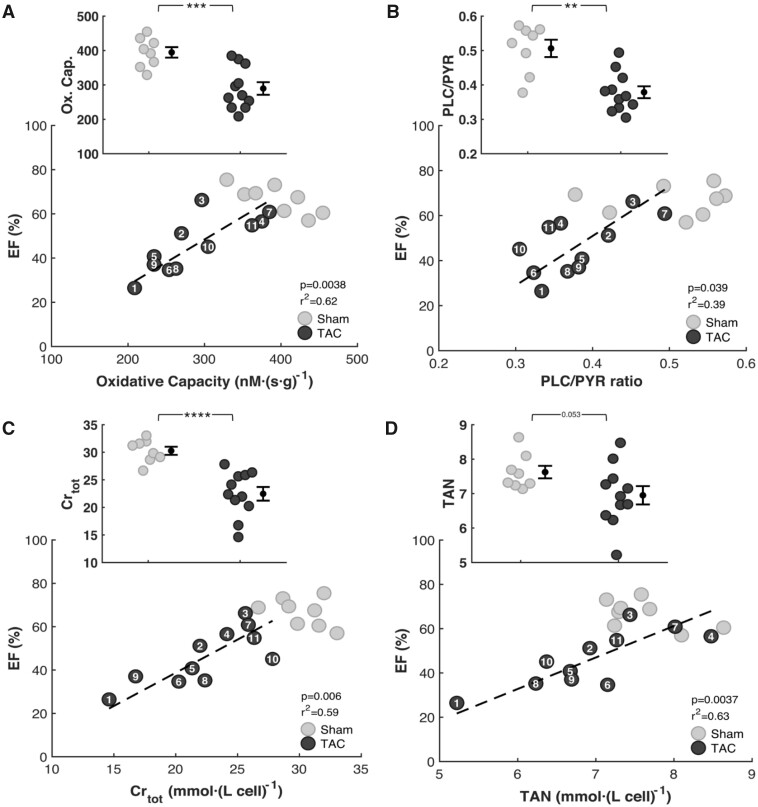
Myocardial mitochondria were isolated from the apex of the LV and septum at Week 18 postsurgery. Maximal mitochondrial respiration was measured using either pyruvate and malate (PYR) or PLC and malate as substrates. Oxidative capacity (maximal mitochondrial respiration with PYR substrate) is plotted in Figure 3A in units of oxygen flux per unit mass of myocardial tissue. Figure 3A shows that on average the carbohydrate oxidative capacity is 27% lower in TAC rats (290 ± 18 nmol·s−1·g−1, P = 0.0004) than in sham rats (394 ± 15 nmol·s−1·g−1) and that there is a strong correlation between carbohydrate oxidative capacity and EF (r2 = 0.62, P = 0.0036). The fatty acid oxidative capacity is also lower in TAC rats (111 ± 34 nmol·s−1·g−1, P = 0.000080) than in sham rats (200 ± 36 nmol·s−1·g−1), data not shown. The ratio of maximal capacity to oxidize fatty acid to maximal capacity to oxidize carbohydrates (PLC/PYR) is 0.51 ± 0.02 in sham control rats. This ratio is decreased by 24% in the TAC animals (0.38 ± 0.001), with a significant correlation between PLC/PYR ratio and EF, as illustrated in Figure 3B.
Figure 3.
Relationships between Heart Function and Cardiac Energetics. Respiratory capacity was assessed from high-resolution respirometry with mitochondria isolated from the apex of the heart 18 weeks postsurgery. Metabolites were extracted from frozen left ventricular and septal heart tissue. (A) Measurements of respiratory capacity on carbohydrate substrate (PYR) show lower ATP synthesis capacity in TAC rats compared to the sham group. Oxidative capacity and EF are correlated in the TAC group. (B) Measurements of the ratio of respiratory capacity on fatty acid oxidative capacity (PLC) to the respiratory capacity on carbohydrate substrate show a decrease in PLC/PYR in TAC rats compared to sham control. CRtot levels (C) TAN levels (D) were depleted in TAC rats compared to control. Reductions in TAN and CRtot are correlated with reductions in EF in the TAC group. (sham n = 8; TAC n = 11; error bars: SEM; Oxidative Capacity P-value:0.0004; CRtotP-value: <0.0001; PLC/PYR P-value: 0.0011).
Figure 3C and D plot the observed values of the TAN and CRtot metabolic pools in left ventricular and septal tissue from TAC and sham controls. These metabolite pools levels are lower in the TAC group compared to control, as illustrated in the insets of Panels C and D and summarized in Table 2. The observed 25% reduction in CRtot compared to control was found to be statistically significant, while the smaller 8% reduction in TAN was not. However, there is a significant correlation between the measured EF and the values of both TAN and CRtot. Taken together, the observations in Panels A–D of Figure 3 reveal relationships between metabolic function and cardiac mechanical function, in agreement with the hypotheses that changes to myocardial energetic status in this animal model caused by reductions in the concentrations of cytoplasmic adenine nucleotide, creatine, and phosphate pools, and a reduction in mitochondrial oxidative capacity contribute to the impaired mechanical performance.
Table 2.
Data are mean ± SEM
| Metric | Sham | TAC |
|---|---|---|
| TAN (mmol/L cell) | 7.6 ± 0.2 | 6.9 ± 0.3 |
| CRtot (mmol/L cell) | 30 ± 0.7 | 22 ± 1.2* |
| Oxidative Capacity (nmol/s·g) | 394 ± 15 | 290 ± 18* |
*P < 0.001, compared to controls.
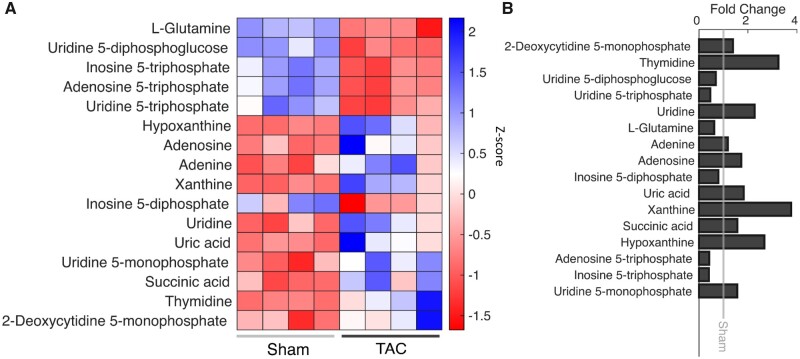
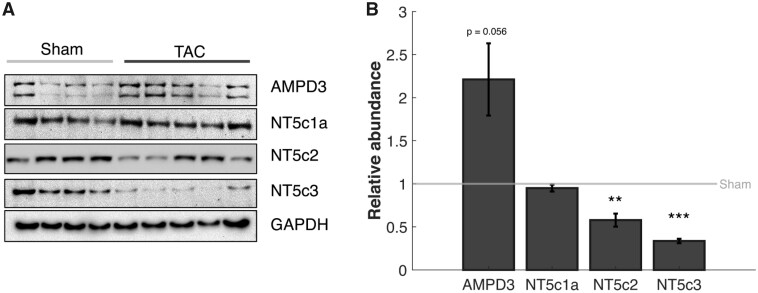
Targeted metabolomics profiling39 reveals significant changes in 55 of 277 metabolites measured. Pathway analysis using both KEGG and MBROLE identified pyrimidine metabolism and purine metabolism as significantly altered pathways, with decreases in the ATP, UTP, ITP, IDP, and increases in the hypoxanthine, xanthine, uric acid, adenosine, adenine, and succinate (Figure 4). The decreased metabolites imply that these metabolites are being degraded at a faster rate than they are being replenished in the TAC rats. Increases in adenosine and adenine indicate an increased degradation of AMP via 5′-nucleotidase activity. Increases in levels of uric acid and hypoxanthine indicate that there is an increase in the rate of purine nucleotide degradation via the AMP deaminase pathway. Western blot analysis of cytosolic 5′-nucleotidase enzymes (NT5c1a, NT5c2, NT5c3) and AMP deaminases (AMPD; AMPD1, AMPD3) show that both NT5c2 and NT5c3 are decreased by 42% and 66%, respectively, and AMPD3 is increased by 120% in the TAC group (Figure 5).
Figure 4.
Metabolite Levels Within the Degradation Pathway. KEGG and MBROLE were used to identify significant pathways from a metabolomics screen done on four sham and four TAC samples. (A) A heatmap showing the z-score of significantly different metabolites within the pyrimidine and purine metabolism pathways. Shades of blue signify an increase in abundance, white represents no change, and shades of red represent a decrease in abundance. Metabolites that are increased in TAC rats are associated with degradation of purines and pyrimidines. The decreased metabolites are ones that are being degraded and converted to the metabolites that are increased. (B) This graph shows the fold change of the metabolites in panel A (sham n = 4; TAC n = 4).
Figure 5.
Regulation of Purine Degradation Pathway. (A) Representative Western blots are shown. Each lane represents a biological replicate. GAPDH is used as a loading control. Two isoforms of 5′-nucleotidase (Nt5c2 and NT5c3) are found to be less abundant in TAC rats compared to control while one (NT5c1a) is unchanged between TAC and control. The AMP deaminase AMPD3 is upregulated in TAC compared to control. (B) Using ImageJ to quantify the Western blots, there is a 42% and 66% decrease in NT5c2 and NT5c3, respectively, and a 121% increase in AMPD3 protein abundance in the TAC rats compared to control (error bar: SEM; NT5C3 P-value: 0.009; NT5C2 P-value: 0.05; sham n = 8; TAC n = 8).
Left Ventricular Power Output
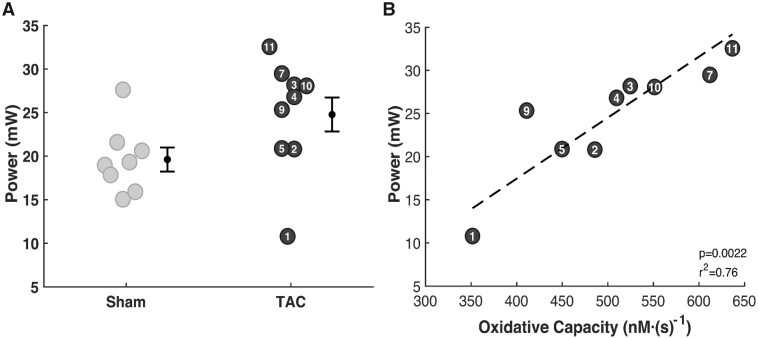
Left ventricular power output (LVPO), the rate of external work done by the LV,40 was estimated using the echocardiography derived data. Estimated LVPO in TAC rats is 26% greater than in sham controls (Figure 6A) due to increased power need to pump blood through the aortic constriction. Plotting LVPO versus myocardial ATP synthesis capacity (Figure 6B) reveals a striking relationship between the metabolic energy supply and mechanical power output. This relationship is consistent with the interpretation that myocardial metabolic dysfunction causes mechanical dysfunction in this animal model.
Figure 6.
Resting Left-Ventricular Mechanical Power Output. (A) Although mean estimated LVPO is higher in TAC rats than in sham controls, the observed difference is not statistically significant. Developed pressure in TAC rats is markedly higher than in controls, while cardiac output tends to be lower. The effects of these two differences on power output tend to counteract one another. (B) Resting LVPO is strongly correlated with oxidative ATP synthesis capacity in the TAC group.
Integrative Metabolic and Mechanical Function
The theory connecting changes in energetic status of the myocardium to changes in mechanical function in the failing heart is based on integrative multiscale simulations that account for the influence of ATP, ADP, and Pi on crossbridge kinetics and muscle dynamics. Previously reported theoretical calculations reveal that the myocardial metabolic changes observed in a canine model of heart failure7 are predicted to cause systolic dysfunction, leading to reduced EF and pulmonary congestion.30 Here, we use this theoretical framework to parameterize the multiscale model of cardiovascular function for each individual rat assessed in this study, based on anatomical data (body size, heart mass, wall thicknesses), resting-state cardiovascular data (heart rate, end-systolic, and -diastolic volumes, arterial pressure, and aortic pressure gradient), and LV myocardial metabolic data (ATP synthesis capacity, metabolic pool concentrations) to assess the influence of energetic state on mechanical function and to predict how changes to metabolic state would influence mechanical function.
Details of the model are provided in Marzban et al.37 and computer codes are available at https://github.com/beards-lab/Rat-Cardiac-Energetic. In brief, the cardiac mechanics model is based on the Lumens et al. Triseg model.36 Tension development in the LV free wall, septum, and RV free wall of the model is driven by a model for rat ventricular calcium activation of Campbell et al.41 and crossbridge kinetics and mechanics of Tewari et al.29 The rate of ATP hydrolysis in each heart wall segment is assumed proportional to myosin ATPase flux. The estimated ATP hydrolysis rate and myocardial metabolite pool concentrations are used with a model of mitochondrial ATP synthesis35 to predict myocardial ATP, ADP, and inorganic phosphate (Pi) concentrations, which are fed back to determine their influence on crossbridge kinetics and muscle mechanics. The model components and process of parameterization are illustrated in Figure 1, showing how the model is simultaneously matched to the metabolic, anatomic, and cardiovascular data on an individual rat.
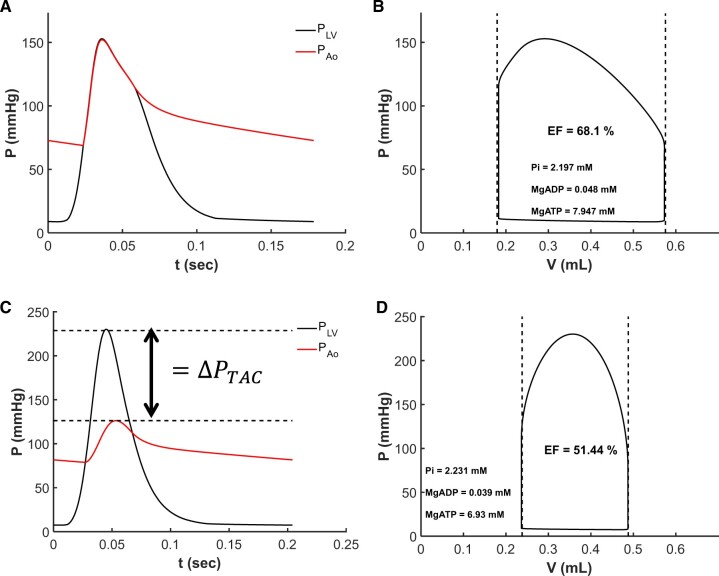
Figure 7 shows model-predicted left-ventricular and aortic pressures through the cardiac cycle and the LV pressure volume loops for sham-operated rat #3 (Panels A and B) and TAC rat #2 (Panels C and D). Solid black lines correspond to the model fit for the individual animals, and dashed lines indicate the measured end-systolic and end-diastolic volumes. Simulated mean arterial pressure is 93 mmHg for both animals. The large pressure difference between ventricular and aortic pressures during systolic in the TAC rat is a reflection of the resistance associated with the TAC, which is ΔPTAC = 102.4 mmHg for this animal.
Figure 7.
Multiscale Model Fits Echocardiography Data. (A and B) Model predicted left-ventricular and aortic pressure over the cardiac cycle and left-ventricular pressure–volume loop for control sham rat #3. (C and D) shows model predicted left-ventricular and aortic pressure over the cardiac cycle and left-ventricular pressure–volume loop for TAC rat #2. Vertical dashed lines in (B) and (D) represent measured end-systolic and end-diastolic left-ventricular volumes. Horizontal dashed lines in (C) represent the estimated pressure drop across the aortic constriction.
Myocardial Metabolic Energetics in Heart Failure Model
The raw metabolic data reported in Table 2 and Figure 3 were obtained from in vitro measurements using suspensions of purified mitochondria and from metabolite extractions from flash-frozen tissue. In order to investigate how the observed differences in these metabolic parameters may affect metabolic state in vivo, we used a previously developed and validated model of mitochondrial ATP synthesis35 to estimate cytoplasmic ATP, ADP, Pi, CrP, and Cr concentrations based on the raw data on metabolite pools, mitochondrial oxidative capacity, and resting myocardial work. In brief, simulations were parameterized by setting myocardial cardiomyocyte cellular metabolite pools to values measured for each animal and the model used to predict concentrations of cytoplasmic phosphate metabolites and the cytoplasmic ATP hydrolysis potential ΔGATP. Details are provided in Marzban et al.37
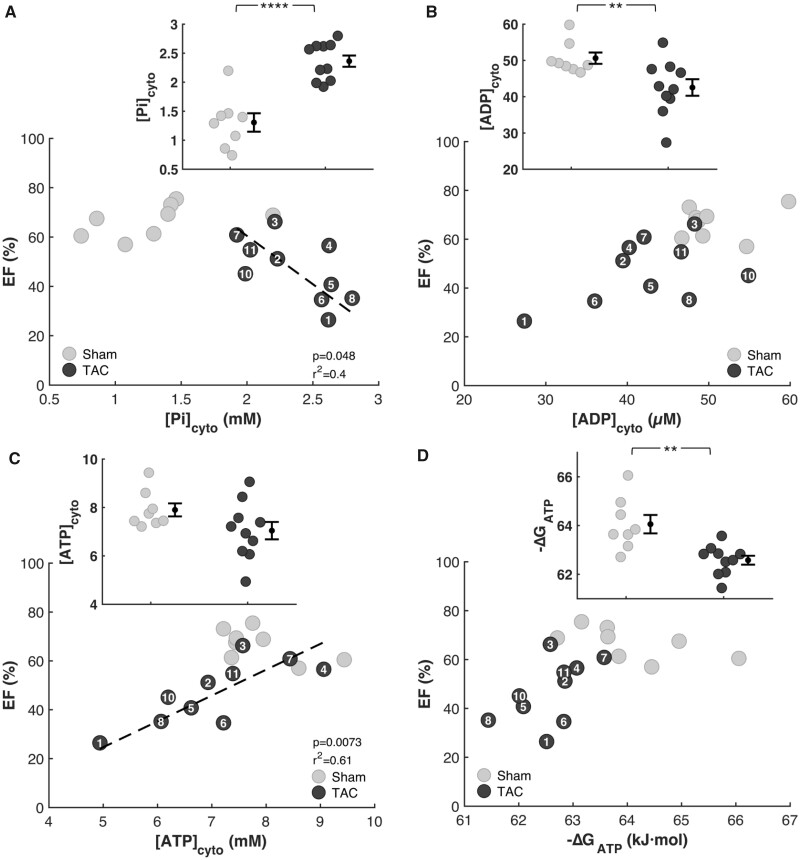
Model-derived estimates of phosphate metabolite levels show increases in cytoplasmic phosphate concentration (Figure 8A), decreases in cytoplasmic ADP (Figure 8B), and cytoplasmic ATP (Figure 8C), and a decreased magnitude of ΔGATP (Figure 8D) in TAC compared to sham-operated control animals. Changes in these three variables are predictive of changes to mechanical function. In particular, increasing levels of Pi, predicted by Tewari et al.30 and Gao et al.23 to impair normal mechanical function in both the failing and the aging heart, are tightly correlated with reduced EF. Thus, these model-derived results, like relationships observed in Figures 3 and 4, are consistent with the hypotheses that change in the metabolic state of heart during disease causes an impairment mechanical function of the heart. (Simulation results for one of the eleven TAC rats for which we were not able to obtain pressure gradient estimates for the aortic stenosis are not included in Figure 8 or subsequent results.)
Figure 8.
Myocardial Energetics Is Predicted by Multiscale Computational Model. Model predictions of myocardial phosphate metabolites are plotted against EF for every animal in the study. (A) Cytoplasmic inorganic phosphate [Pi]cyto is predicted to be higher in TAC rats compared to sham and to be inversely correlated with EF. (B) The predicted concentration of cytosolic ADP is lower in the TAC compared to the control group, without a statistically significant correlation with EF. (C) The mean model-predicted concentration of cytosolic ATP in the TAC group was lower than in the control group. However, the difference is not statistically significant. There is, however, as statistically significant correlation between predicted [ATP]cyto and EF. There was no observable change in cytosolic ATP. There was a strong correlation between cytosolic ATP and EF. (D) The predicted free energy of ATP hydrolysis DGATP is lower in the TAC compared to the control group, without a statistically significant correlation with EF (sham n = 8; TAC n = 10; error bars: SEM; Pi P-value: 1.0E-04; ADP P-value: 0.01; ΔGATPP-value: 0.005).
Restoring Mechanical Function in Failing Hearts
To quantify the effect of the pathological metabolic state on the phenotypes, a second set of simulation was performed for these animals in which the myocardial metabolic models for TAC rats is parameterized to match the sham rats and the metabolic models for sham rats is parameterized to match the TAC rats. Thus, these simulations represent predictions of how the metabolic status of the myocardium influences mechanical function in vivo.
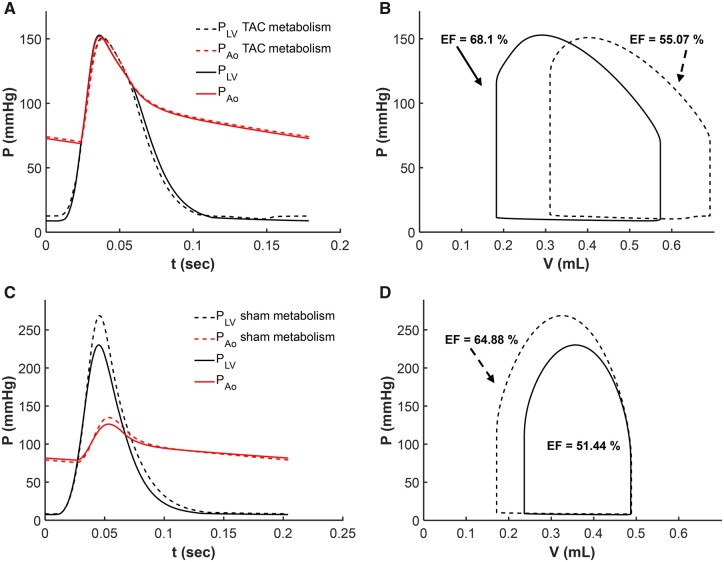
Resting left ventricular and aortic pressures and the LV pressure–volume loop from simulations of resting myocardial energetics and cardiovascular dynamics are illustrated for sham rat #3 as black curves in Figure 9A and B. The resting left ventricular and aortic pressures and the LV pressure–volume loop from simulation of resting myocardial energetics and cardiovascular dynamics are illustrated for TAC rat #2 as black curves in Figure 9C and D. Imposition of the mean TAC rat metabolic profile on the sham rat simulation results in a shift in the pressure–volume loop to the right, with an increase in end-diastolic pressure from approximately 8.8 to 12.6 mmHg and a decrease in EF from 68% to 55%. The impairment of mechanical function in the simulation of this sham rat with TAC rat metabolism driven primarily by an increase in myocardial cytosolic inorganic phosphate concentration from 1.2 mM in the control sham case to 2.3 mM in the simulation with the TAC energetics.
Figure 9.
Analysis of Effects of Metabolic State on Mechanical Function. Simulations of left-ventricular and aortic pressure (A and C) and left-ventricular pressure–volume loops (B and D) are shown for sham rat #3 and TAC rat #2. The baseline simulations (solid lines) are equivalent to those shown in Fig. 7. Dashed lines in (A) and (B) illustrate model predictions associated with replacing the metabolic model parameter values for sham rat #3 with values representing the mean TAC rat. Imposition of the TAC rat metabolic phenotype on the sham rat results in an increase in inorganic phosphate concentration, diminished systolic contractility, and reduction in EF. Dashed lines in (C) and (D) illustrate model predictions associated with replacing the metabolic model parameter values for TAC rat #2 with values representing the mean sham rat. Imposition of the control sham metabolic phenotype on the TAC rat results in a decrease in inorganic phosphate concentration, improved systolic contractility, and increase in EF.
The lower panel of Figure 9 shows analogous results for simulations where the metabolic profile of an individual TAC rat is replaced with that of the mean sham rat. Replacing this animal’s metabolic profile with the healthy control values of the sham group results in a marked decrease in end-diastolic pressure, an increase in EF, and a decrease in cytosolic Pi from 2.1 to 1.4 mM.
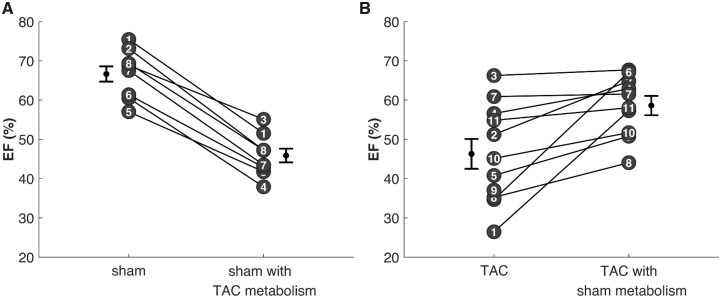
Figure 10 reports the results of repeating these predictions for all sham and TAC rats studied. Panel A shows how EF is predicted to change in each sham rat when the energetic model representing the average TAC rat is used in the context of the models representing the sham group. Panel B shows analogous results for replacing TAC metabolic profiles with that of the average sham rat. Restoration of the healthy control myocardial energetics in the TAC rats is predicted to uniformly increase EF from 46 ± 2% to 59 ± 2%. Imposition of the disease-sate myocardial energetics of TAC rats in the simulation of sham rats is predicted to uniformly decrease EF from 67 ± 2% to 50 ± 4%.
Figure 10.
Predicted Impact of Metabolic Dysfunction in Resting Systolic Mechanical Function. The multiscale computational model of myocardial mechanoenergetic coupling was used to predict the effects of changing metabolic status of the myocardium on cardiac mechanical function. (A) The effect of switching the parameterization of the component of the model representing metabolic function for each control sham rat to values of mitochondrial capacity and metabolic pools associated with the mean TAC rat. Predicted EF drop from 67% for the original data to 50% for sham rats with TAC metabolism. (B) The effect of switching the parameterization of the component of the model representing metabolic function for each TAC rat to values of mitochondrial capacity and metabolic pools associated with the mean sham rat. Predicted EF increase from 46% for the original data to 59% for TAC rats with sham metabolism.
Discussion
In this study, we quantitatively tested the relationships between mechanical function and the metabolic/energetic status of the myocardium in a rat TAC model of hypertrophy and decompensation using multiscale computational model of cardiac mechanoenergetic coupling. Observations reveal predictive relationships between depletion of cytoplasmic metabolite pools and systolic dysfunction and between reductions in myocardial ATP synthesis capacity and systolic dysfunction. Analysis of these data reveals how changes in energetic state affect mechanical function in heart failure and how restoration of normal metabolic/energetic state may improve pump function in the failing heart.
Metabolic data obtained from this study were analyzed using a computational model that captures the general mechanism that feedback of ATP hydrolysis products ADP and inorganic phosphate (Pi) drive oxidative ATP synthesis. This mechanism is consistent with in vitro42,43 and in vivo1,7,44 data on cardiac energetics and is supported by theoretical investigations from several groups.45–47 Based on this model, reduced mitochondrial capacity in the myocardium of TAC compared to control animals causes an increase in myocardial Pi because with reduced ATP synthesis capacity higher levels of ADP and Pi are needed to maintain ATP synthesis to match a given hydrolysis rate. Furthermore, at a given ATP hydrolysis rate, higher Pi levels are needed to compensate for the reduction in ADP caused by the reduced adenine nucleotide pool in myocardium from TAC animals. Thus, both diminished mitochondrial ATP synthesis capacity and depletion of the adenine nucleotide pools are predicted to cause an increase in myocardial Pi in the disease model compared to control. The increased [Pi] is, in turn, predicted to impair systolic function. This prediction is similar to simulations of Ghosh et al.46 of cardiac mechanoenergetic coupling in acute ischemia, in which increases in both ADP and Pi are found to slow crossbridge cycling rates, slowing tension development and relaxation in a theoretical model of myocardial mechanics.
On average the experimental TAC group in this study shows a mean 27% reduction in mitochondrial capacity to synthesize ATP compared to control. This level of reduction is similar to the 19% reduction observed by Holzem et al. in failing versus age-matched control hearts from humans.20 The reduction observed by Holzem et al. was not found to be statistically significant, while other studies have shown that there is an increase in mitochondrial respiratory capacity in human heart failure.21 The lack of a consistent picture of potential mitochondrial dysfunction in heart failure is likely a reflection of the heterogeneous nature of the disease, which arises from multiple etiologies and manifests in numerous changes to gross morphology (e.g., dilation), tissue-level structure (e.g., fibrosis), and cellular-level function (e.g., calcium handling). Still, metabolic dysfunction appears to be general feature of the failing heart, regardless of etiology: concentrations of ATP, its hydrolysis products ADP and Pi, and the related metabolite creatine phosphate (CrP) are altered in the diseased and failing heart compared to normal.6,11,12,16,17,24,48 Our analysis predicts a roughly 2-fold increase in Pi/ATP ratio in the disease model compared to control, consistent with recent in vivo measurement in hypertrophic cardiomyopathy patients compared to healthy controls.49 Thus, regardless of the complexity and variability in the clinical presentation of heart failure, the animal model employed here captures the two common features of energetic dysfunction in failing hearts, reduced adenine nucleotides and increased [Pi], that we predict to be the direct metabolic drivers of mechanical dysfunction in heart failure.
While the overall reduction in mitochondrial ATP synthesis capacity in the TAC compared to control group is modest, the data (Figure 6) reveal a striking relationship between the capacity for myocardial mitochondrial ATP synthesis and resting cardiac power output in TAC rats. The fact that this relationship is observed only for the TAC group, which is operating with higher overall power output and lower ATP synthesis capacity, suggests that resting mechanical power output becomes limited by the capacity to synthesize ATP in this animal model of cardiac decompensation. One of the defining characteristics of heart failure is exercise intolerance, a pathological limitation to reserve cardiac output and power to meet the demands of the periphery in exercise. Because the relative cardiac reserve is much lower in rodents than in humans—for example, maximum exercise elicits maximal heart rates of less than 150% of resting value in rats and mice50 while in humans heart rates can increase in exercise to as much as four times the resting value—rodent models cannot ideally capture this defining feature of heart failure in humans. If, as suggested by the close relationship between resting power output and ATP synthesis capacity in the TAC group, resting cardiac power output is energetically limited, then these animals would be expected to exhibit an impaired reserve of cardiac power output.
The observations on ATP synthesis capacity shown in Figure 6 should be compared to results of previous studies using the rat model employed here, which have shown more drastic reductions in mitochondrial capacity. For example, Doenst et al.19 report a mean 4-fold reduction in overall capacity to oxidize carbohydrates and fatty acids at 20 weeks postsurgery.19 Thus, while we observe the same trend in reduction of ATP synthesis capacity, Doenst et al. report much more drastic reductions than we observe. Our model simulations predict that with decreases as drastic as that reported by Doenst et al. mitochondrial ATP supply would fall far short of that needed to drive cardiac pumping.
Furthermore, the observed reductions in the TAN and CRtot metabolic pools in the TAC group compared control are as important as the reductions in mitochondrial capacity in determining the energetic phenotype. These reductions in metabolite pools have been observed in humans and large-animal models,7–11,51 but have not been previously quantified in rodent models, and have not been measured in concert with measurements of mitochondrial function in a hypertrophy/decompensation model. Using the data on these metabolite pools and mitochondrial capacity from the present study to inform our computational model of myocardial energetics,30 we are able to predict cytosolic ATP, ADP, and inorganic phosphate concentrations (Figure 6). Furthermore, we used the models to probe the causal relationships underlying these predictions by swapping the energetic phenotypes in the models representing rats from the TAC and the sham groups (Figure 8A). Simulations predict that restoration of the normal energetic profile in TAC hearts results in a restoration of normal feedback control of myocardial ATP synthesis,1 reducing pathologically elevated [Pi], removing the impediment to crossbridge cycling associated with elevated [Pi], and thereby improving systolic function. Similarly, imposition of the TAC/disease energetic profile in simulation of control animals results in elevated [Pi], and the associated impaired mechanical function. Because the potential effects of energetic state on the function of other ATP-dependent processes (for example, sodium-potassium and calcium pumping) are not considered in the model, these simulations provide predictions of the isolated impact of energetic function/dysfunction on crossbridge dynamics.
Therefore, the multiscale model introduced here provides a vehicle not only for analyzing experimental data on cardiac energetics and mechanical function, but also to make predictions of how one component (i.e., the metabolic phenotype) influences another (whole-organ mechanical function and whole-body cardiovascular phenotype). These predictions yield new hypotheses than can potentially be experimentally tested. For example, we predict that systolic function in heart failure may be improved by inhibiting or reversing adenine nucleotide pool depletion. The adenine nucleotide pool is maintained by a balance of degradation and novo synthesis and salvage pathways, with two major degradation pathways: (1) dephosphorylation of AMP to adenosine and permeation of adenosine out of the myocardium; and (2) deamination of AMP to IMP, which can be converted to other downstream products (inosine and hypoxanthine) that permeate out of cardiomyocytes. We hypothesize that in the chronically overloaded myocardium (as in the TAC pressure–overload animal model studied here), the elevated work rate leads to elevated levels of AMP, shifting the balance of nucleotide synthesis and degradation pathways to maintaining lower TAN levels than in the normal energetic state.
Indeed, previous studies have shown that hypoxanthine,52 AMP deaminase expression,52 xanthine oxidase expression,53 and uric acid levels52,53 are increased in heart failure patients compared to controls, pointing to a role of the AMP deaminase pathway in degradation and depletion of the adenine nucleotide pool in heart failure. Our data (Figure 4) indicate that the TAC rat model shares these aspects of the metabolic phenotype with heart failure patients. Expression of purine specific nucleotidase NT5c1a,54 which catalyzes the conversions of AMP to adenosine, does not appear to be altered in the disease model, while other 5′-nucleotidase isoforms are downregulated. The commonalities between the TAC rat model and the failing human myocardium suggest that our predictions associated with restoration of metabolite pools rescuing mechanical function may translate to humans and points to AMP deaminases and 5′-nucleotidases as potential targets to inhibit nucleotide degradation and depletion. Inhibiting AMP deaminases and 5′-nucleotidases would potentially slow the conversion of AMP into either inosine or adenosine, slowing the degradation and depletion of adenine nucleotides from the myocardium, and also potentially increasing AMP-mediated signaling. Potential negative effects of targeting these enzymes and the details of the roles these enzymes play in disease are not fully understood.
The computer codes for the computational model are available for download at https://github.com/beards-lab/Rat-Cardiac-Energetic. A detailed description of the operation of the codes and instructions for reproducing the simulation results presented here are provided in a companion paper.37 Although this multiscale model (Figure 1) integrates function from the sub-cellular molecular level of crossbridge dynamics and mitochondrial ATP production up to the whole-body level of flows and pressures throughout the cardiovascular system, the level of detail becomes increasingly simplified at higher functional scales. The TriSeg heart model represents cardiac anatomy in a way that accounts for ventricular–ventricular mechanical interaction and the evolution of stress and strain in a way that represents average quantities over each heart wall.36 The simple lumped circulatory model does not explicitly account for anatomical arrangement of vessels, neurohumoral regulation, or fluid filtration/volume regulation. Therefore, it does not account for chronic remodeling of cardiac anatomy or preload, for example, that would occur following acute imposition of a metabolic defect such as is simulated in by imposing the disease metabolic profile in a model otherwise representing the healthy case (Figures 9 and 10). Nor have we used this modeling framework to explore the impacts of changes to passive mechanical properties of the myocardium, such as caused by pathological fibrosis, on cardiac function. The model components, and associated computer codes, provide a platform for further development of these aspects of cardiovascular systems function and their contributions to physiological regulation and the pathophysiology of cardiovascular disease.
Summary of Findings
The major findings from this study are:
Myocardial energetic dysfunction in a rat model of hypertrophy and decompensation is driven by a depletion of cytoplasmic adenine nucleotide and creatine metabolic pools and by a reduction in the capacity for oxidative ATP synthesis.
Consistent with the hypothesis that changes in ATP, ADP, inorganic phosphate that are associated with decompensation and failure have direct roles in impeding contractile function of the myocardium in heart failure, the degree of metabolic dysfunction is predictive of the degree of mechanical dysfunction.
Computer modeling of coupled myocardial energetics and mechanics informed by these data predict that since ATP synthesis is stimulated by both ADP and inorganic phosphate levels, the reduced adenine nucleotide pool causes an increase in inorganic phosphate in failing hearts compared to healthy controls. Increased phosphate, in turn, impairs the kinetics of myosin ATPase crossbridge cycling in the myocardium, causing systolic dysfunction.
Computer simulations further predict that mechanical function in heart failure can be reversed by restoring phosphate metabolite concentrations to levels observed in healthy myocardium.
Acknowledgments
The authors are grateful to Coert Zuurbier (Academic Medical Center, Amsterdam) for advice on the creatine and creatine-phosphate assays. The authors also thank Dr. Manuel Rosa Garrido for helpful discussions. Graphical abstract was created with BioRender.com.
Funding
This work was supported by NIH grants HL144657 and HL122199. R.L.’s training has been supported by GM08626208 and GM0083229.
Conflict of Interest
None declared.
References
- 1. Wu F, Zhang EY, Zhang J, et al. Phosphate metabolite concentrations and ATP hydrolysis potential in normal and ischaemic hearts. J Physiol 2008;586(17):4193–4208. [DOI] [PMC free article] [PubMed] [Google Scholar]
- 2. Lassers BW, Kaijser L, Wahlqvist ML, et al. Relationship in man between plasma free fatty acids and myocardial metabolism of carbohydrate substrates. Lancet 1971;2(7722):448–450. [DOI] [PubMed] [Google Scholar]
- 3. Gertz EW, Wisneski JA, Stanley WC, et al. Myocardial substrate utilization during exercise in humans. Dual carbon-labeled carbohydrate isotope experiments. J Clin Invest 1988;82(6):2017–2025. [DOI] [PMC free article] [PubMed] [Google Scholar]
- 4. Viscarra JA, Ortiz RM. Cellular mechanisms regulating fuel metabolism in mammals: role of adipose tissue and lipids during prolonged food deprivation. Metabolism 2013;62(7):889–897. [DOI] [PMC free article] [PubMed] [Google Scholar]
- 5. Liepinsh E, Makrecka M, Kuka J, et al. The heart is better protected against myocardial infarction in the fed state compared to the fasted state. Metabolism 2014;63(1):127–136. [DOI] [PubMed] [Google Scholar]
- 6. Ventura-Clapier R, Garnier A, Veksler V, et al. Bioenergetics of the failing heart. Biochim Biophys Acta 2011;1813(7):1360–1372. [DOI] [PubMed] [Google Scholar]
- 7. Wu F, Zhang J, Beard DA. Experimentally observed phenomena on cardiac energetics in heart failure emerge from simulations of cardiac metabolism. Proc Natl Acad Sci U S A 2009;106(17):7143–7148. [DOI] [PMC free article] [PubMed] [Google Scholar]
- 8. Conway MA, Allis J, Ouwerkerk R, et al. Detection of low phosphocreatine to ATP ratio in failing hypertrophied human myocardium by 31P magnetic resonance spectroscopy. Lancet 1991;338(8773):973–976. [DOI] [PubMed] [Google Scholar]
- 9. Neubauer S, Horn M, Cramer M, et al. Myocardial phosphocreatine-to-ATP ratio is a predictor of mortality in patients with dilated cardiomyopathy. Circulation 1997;96(7):2190–2196. [DOI] [PubMed] [Google Scholar]
- 10. Stanley WC. Myocardial energy metabolism in dilated cardiomyopathy. Heart Metab 2011;49:5–8. [Google Scholar]
- 11. Ingwall JS. Energy metabolism in heart failure and remodelling. Cardiovasc Res 2009;81(3):412–419. [DOI] [PMC free article] [PubMed] [Google Scholar]
- 12. Neubauer S. The failing heart–an engine out of fuel. N Engl J Med 2007;356(11):1140–1151. [DOI] [PubMed] [Google Scholar]
- 13. Beer M, Seyfarth T, Sandstede J, et al. Absolute concentrations of high-energy phosphate metabolites in normal, hypertrophied, and failing human myocardium measured noninvasively with (31)P-SLOOP magnetic resonance spectroscopy. J Am Coll Cardiol 2002;40(7):1267–1274. [DOI] [PubMed] [Google Scholar]
- 14. Neubauer S, Horn M, Pabst T, et al. Contributions of 31P-magnetic resonance spectroscopy to the understanding of dilated heart muscle disease. Eur Heart J 1995;16(Suppl O):115–118. [DOI] [PubMed] [Google Scholar]
- 15. Hardy CJ, Weiss RG, Bottomley PA, et al. Altered myocardial high-energy phosphate metabolites in patients with dilated cardiomyopathy. Am Heart J 1991;122 (3 Pt 1):795–801. [DOI] [PubMed] [Google Scholar]
- 16. Ingwall JS. On the control of metabolic remodeling in mitochondria of the failing heart. Circ Heart Fail 2009;2(4):275–277. [DOI] [PubMed] [Google Scholar]
- 17. Bottomley PA, Panjrath GS, Lai S, et al. Metabolic rates of ATP transfer through creatine kinase (CK Flux) predict clinical heart failure events and death. Sci Transl Med 2013;5(215):215re213. [DOI] [PMC free article] [PubMed] [Google Scholar]
- 18. Brown DA, Perry JB, Allen ME, et al. Expert consensus document: mitochondrial function as a therapeutic target in heart failure. Nat Rev Cardiol 2017;14(4):238–250. [DOI] [PMC free article] [PubMed] [Google Scholar]
- 19. Doenst T, Pytel G, Schrepper A, et al. Decreased rates of substrate oxidation ex vivo predict the onset of heart failure and contractile dysfunction in rats with pressure overload. Cardiovasc Res 2010;86(3):461–470. [DOI] [PubMed] [Google Scholar]
- 20. Holzem KM, Vinnakota KC, Ravikumar VK, et al. Mitochondrial structure and function are not different between nonfailing donor and end-stage failing human hearts. FASEB J 2016;30(8):2698–2707. [DOI] [PMC free article] [PubMed] [Google Scholar]
- 21. Cordero-Reyes AM, Gupte AA, Youker KA, et al. Freshly isolated mitochondria from failing human hearts exhibit preserved respiratory function. J Mol Cell Cardiol 2014;68:98–105. [DOI] [PMC free article] [PubMed] [Google Scholar]
- 22. Stride N, Larsen S, Hey-Mogensen M, et al. Decreased mitochondrial oxidative phosphorylation capacity in the human heart with left ventricular systolic dysfunction. Eur J Heart Fail 2013;15(2):150–157. [DOI] [PubMed] [Google Scholar]
- 23. Gao X, Jakovljevic DG, Beard DA. Cardiac metabolic limitations contribute to diminished performance of the heart in aging. Biophys J 2019;117(12):2295–2302. [DOI] [PMC free article] [PubMed] [Google Scholar]
- 24. Cowan DW. The creatine content of the myocardium of normal and abnormal human hearts. Am Heart J 1934;9(3):378–385. [Google Scholar]
- 25. Herrmann G, Decherd GM. The chemical nature of heart failure. Ann Intern Med 1939;12(8):1233–1244. [Google Scholar]
- 26. Ardehali H, Sabbah HN, Burke MA, et al. Targeting myocardial substrate metabolism in heart failure: potential for new therapies. Eur J Heart Fail 2012;14(2):120–129. [DOI] [PMC free article] [PubMed] [Google Scholar]
- 27. Doenst T, Nguyen TD, Abel ED. Cardiac metabolism in heart failure: implications beyond ATP production. Circ Res 2013;113(6):709–724. [DOI] [PMC free article] [PubMed] [Google Scholar]
- 28. Ashrafian H, Frenneaux MP, Opie LH. Metabolic mechanisms in heart failure. Circulation 2007;116(4):434–448. [DOI] [PubMed] [Google Scholar]
- 29. Tewari SG, Bugenhagen SM, Palmer BM, et al. Dynamics of cross-bridge cycling, ATP hydrolysis, force generation, and deformation in cardiac muscle. J Mol Cell Cardiol 2016;96:11–25. [DOI] [PMC free article] [PubMed] [Google Scholar]
- 30. Tewari SG, Bugenhagen SM, Vinnakota KC, et al. Influence of metabolic dysfunction on cardiac mechanics in decompensated hypertrophy and heart failure. J Mol Cell Cardiol 2016;94:162–175. [DOI] [PMC free article] [PubMed] [Google Scholar]
- 31. Eigentler A, Draxl A, Gnaiger W et al. Laboratory protocol: citrate synthase. Mitochondrial marker enzyme. Mitochondr Physiol Network 2015;17.04(3):1–11. [Google Scholar]
- 32. Lorenz MA, El Azzouny MA, Kennedy RT, et al. Metabolome response to glucose in the β-cell line INS-1 832/13. J Biol Chem 2013;288(15):10923–10935. [DOI] [PMC free article] [PubMed] [Google Scholar]
- 33. Lorenz MA, Burant CF, Kennedy RT. Reducing time and increasing sensitivity in sample preparation for adherent mammalian cell metabolomics. Anal Chem 2011;83(9):3406–3414. [DOI] [PMC free article] [PubMed] [Google Scholar]
- 34. Sato Y, Nakamura T, Aoshima K, et al. Quantitative and wide-ranging profiling of phospholipids in human plasma by two-dimensional liquid chromatography/mass spectrometry. Anal Chem 2010;82(23):9858–9864. [DOI] [PubMed] [Google Scholar]
- 35. Bazil JN, Beard DA, Vinnakota KC. Catalytic coupling of oxidative phosphorylation, ATP demand, and reactive oxygen species generation. Biophys J 2016;110(4):962–971. [DOI] [PMC free article] [PubMed] [Google Scholar]
- 36. Lumens J, Delhaas T, Kirn B, et al. Three-wall segment (TriSeg) model describing mechanics and hemodynamics of ventricular interaction. Ann Biomed Eng 2009;37(11):2234–2255. [DOI] [PMC free article] [PubMed] [Google Scholar]
- 37. Marzban B, Lopez R, Beard DA. Computational modeling of coupled energetics and mechanics in the rat ventricular myocardium. Physiome 2020. DOI:10.36903/phys-iome.12964970 [Google Scholar]
- 38. Mohammed SF, Storlie JR, Oehler EA, et al. Variable phenotype in murine transverse aortic constriction. Cardiovasc Pathol 2012;21(3):188–198. [DOI] [PMC free article] [PubMed] [Google Scholar]
- 39. Lee HJ, Kremer DM, Sajjakulnukit P, et al. A large-scale analysis of targeted metabolomics data from heterogeneous biological samples provides insights into metabolite dynamics. Metabolomics 2019;15(7):103. [DOI] [PMC free article] [PubMed] [Google Scholar]
- 40. Dini FL, Mele D, Conti U, et al. Peak power output to left ventricular mass: an index to predict ventricular pumping performance and morbidity in advanced heart failure. J Am Soc Echocardiogr 2010;23(12):1259–1265. [DOI] [PubMed] [Google Scholar]
- 41. Campbell KS, Janssen PML, Campbell SG. Force-dependent recruitment from the myosin off state contributes to length-dependent activation. Biophys J 2018;115(3):543–553. [DOI] [PMC free article] [PubMed] [Google Scholar]
- 42. Vinnakota KC, Bazil JN, Van den Bergh F, et al. Feedback regulation and time hierarchy of oxidative phosphorylation in cardiac mitochondria. Biophys J 2016;110(4):972–980. [DOI] [PMC free article] [PubMed] [Google Scholar]
- 43. Vinnakota KC, Singhal A, Van den Bergh F, et al. Open-loop control of oxidative phosphorylation in skeletal and cardiac muscle mitochondria by Ca(2). Biophys J 2016;110(4):954–961. [DOI] [PMC free article] [PubMed] [Google Scholar]
- 44. Bakermans AJ, Bazil JN, Nederveen AJ, et al. Human cardiac (31)P-MR spectroscopy at 3 tesla cannot detect failing myocardial energy homeostasis during exercise. Front Physiol 2017;8:939. [DOI] [PMC free article] [PubMed] [Google Scholar]
- 45. Saito R, Takeuchi A, Himeno Y, et al. A simulation study on the constancy of cardiac energy metabolites during workload transition. J Physiol 2016;594(23):6929–6945. [DOI] [PMC free article] [PubMed] [Google Scholar]
- 46. Ghosh S, Tran K, Delbridge LMD, et al. Insights on the impact of mitochondrial organisation on bioenergetics in high-resolution computational models of cardiac cell architecture. PLoS Comput Biol 2018;14(12):e1006640. [DOI] [PMC free article] [PubMed] [Google Scholar]
- 47. Tran K, Loiselle DS, Crampin EJ. Regulation of cardiac cellular bioenergetics: mechanisms and consequences. Physiol Rep 2015;3(7):e12464. [DOI] [PMC free article] [PubMed] [Google Scholar]
- 48. Bertero E, Sequeira V, Maack C. Hungry hearts. Circ Heart Fail 2018;11(12):e005642. [DOI] [PubMed] [Google Scholar]
- 49. Valkovic L, Clarke WT, Schmid AI, et al. Measuring inorganic phosphate and intracellular pH in the healthy and hypertrophic cardiomyopathy hearts by in vivo 7T (31)P-cardiovascular magnetic resonance spectroscopy. J Cardiovasc Magn Reson 2019;21(1):19. [DOI] [PMC free article] [PubMed] [Google Scholar]
- 50. Lujan HL, Janbaih H, Feng HZ, et al. Ventricular function during exercise in mice and rats. Am J Physiol Regul Integr Comp Physiol 2012;302(1):R68–R–74.. [DOI] [PMC free article] [PubMed] [Google Scholar]
- 51. Ventura-Clapier R, Moulin M, Piquereau J, et al. Mitochondria: a central target for sex differences in pathologies. Clin Sci (Lond) 2017;131(9):803–822. [DOI] [PubMed] [Google Scholar]
- 52. Hisatome I, Ishiko R, Miyakoda H, et al. Excess purine degradation caused by an imbalance in the supply of adenosine triphosphate in patients with congestive heart failure. Br Heart J 1990;64(6):359–361. [DOI] [PMC free article] [PubMed] [Google Scholar]
- 53. Chrysohoou C, Pitsavos C, Barbetseas J, et al. Serum uric acid levels correlate with left atrial function and systolic right ventricular function in patients with newly diagnosed heart failure: the Hellenic heart failure study. Congest Heart Fail 2008;14(5):229–233. [DOI] [PubMed] [Google Scholar]
- 54. Hunsucker SA, Mitchell BS, Spychala J. The 5'-nucleotidases as regulators of nucleotide and drug metabolism. Pharmacol Ther 2005;107(1):1–30. [DOI] [PubMed] [Google Scholar]


