Abstract
We describe a new template-based method for docking flexible ligands such as macrocycles to proteins. It combines Monte-Carlo energy minimization on the manifold (MCMM), a fast manifold search method, with BRIKARD for complex flexible ligand searching, and with the MELD accelerator of Replica-Exchange Molecular Dynamics (MD) simulations for atomistic degrees of freedom. Here we test the method in the Drug Design Data Resource (D3R) blind Grand Challenge competition. This method was among the best performers in the competition, giving sub-angstrom prediction quality for the majority of the targets.
Keywords: D3R, protein-ligand docking, template-based docking, macrocycles, BACE-1
2. Introduction
Over the last few years, our team has successfully participated [1, 2] in several rounds of the Drug Design Data Resource (D3R) community-wide blinded prediction challenge. Each round had a variety of prediction tasks — prediction of poses, binding affinity, and free energy of binding for the interactions of small molecular compounds with proteins. In the last round, D3R 2018 Grand Challenge 4 (GC4), the participants were asked to predict poses and affinities for ligands of beta-secretase 1 (BACE1), a protease implicated in the production of beta-amyloid peptides in patients with Alzheimer’s disease [3]. We took part in stages 1a and 1b of GC4. Stage 1a included prediction of the binding poses of 20 ligands, in which the participants were provided with nothing but the protein sequence and the ligand SMILES strings. Stage 1b included a pose prediction task for the same 20 ligands, but this time the participants were given the corresponding receptor cocrystal structures, including water molecules and, in some cases, sulfate ions and glycerol molecules, but without the target ligand. Previous rounds of D3R had motivated us to develop new tools and to modify existing protocols to satisfy the needs of the proposed tasks; GC4 was no exception. In this round, we used a combination of template modeling, inverse kinematics sampling, restrained local minimization (RM), Monte-Carlo energy minimization on the manifold (MCMM), conventional molecular dynamics (MD), and Modeling Employing Limited Data accelerated molecular dynamics (MELD × MD) simulation.
BACE1 is a well-studied system, which, together with its sequence homologs, has had several hundred crystallized structures deposited in PDB, many of which contain a bound small-molecule ligand. We collected and integrated the existing information on the bound compounds and used it throughout the whole pipeline: generation of initial poses, their refinement, and the final scoring.
Nineteen of the 20 proposed compounds were cyclic molecules, which made sampling difficult because the loop closure conditions of the cycles must be satisfied. To overcome this issue, we used an inverse kinematics approach designed to exhaustively sample the conformations of the compounds and to satisfy the multiple closure conditions at the same time [4].
We sampled multiple structures for each target and then subjected them to preliminary filtering. The remaining structures were refined with several algorithms: full-atomic relaxation, MCMM [2, 5, 6], and conventional and accelerated MD [7, 8]. This pipeline resulted in very successful predictions, with 0.76 Å average pose-1 RMSD poses, and sub-angstrom accuracy for 15 out of 20 compounds, according to the official evaluation by the D3R organizers.
3. Methods
3.1. Workflow overview
For Stage 1a, the input data consisted of the receptor sequence (as a FASTA string) and ligand structures (as SMILES strings). In total, 20 receptor-ligand pairs, or targets, were given, named BACE_1 to BACE_20. The BRIKARD algorithm [4] (for cyclic molecules BACE_1 to BACE_19) and the ETKDG [9] algorithm (for the only non-cyclic target, BACE_20) were used to generate multiple initial conformations for the ligands. The similarity search was performed in the PDB database to find templates – highly-homologous proteins with similar ligands. Out of all generated conformations, only those closest to the templates were retained. This way, for each target, we created an ensemble of starting poses containing between 4 and 402 structures. These structures were subjected to restrained full-atomic energy minimization (RM) to remove possible clashes and to “relax” the ligand. Out of the resulting minimized poses, four to five were manually chosen for submission.
For Stage 1b, the D3R organizers provided X-Ray structures of the receptor cocrystallized with each of the ligands. We aligned the submitted results from Stage 1a to these receptor molecules and applied various refinement protocols: restrained full-atomic minimization (RM), Monte Carlo on manifold minimization (MCMM), molecular dynamics (MD), and Modeling Employing Limited Data accelerated molecular dynamics (MELD × MD). For each target, five structures were manually selected for submission. The high-level overview of the workflow is presented in Fig. 1.
Fig. 1.
The general outline of the protocol used by our team in D3R GC4. Yellow elements indicate the stages of the pipeline; green elements indicate the data provided by the organizers; blue indicates publicly-available databases; and purple indicates the final submitted results. The MCMM, MD, and MD × MELD refinement stages were only used for refining with a cocrystallized receptor in Stage 1b and were skipped in Stage 1a
3.2. Template search
The first step of the protocol in Stage 1a was finding known structures of closely related complexes. We did a BLAST search for sequence-similar (e-value = 10−20, sequence identity ≥ 95%, resolution ≤ 3 Å) chain structures in the Protein Data Bank (PDB). Then, the following procedure was conducted independently for each of the 20 target ligands. For each sequence-similar structure, only the ligand with the best Tanimoto score located within 8 Å of the sequence-similar chain structure was retained, with the two thus forming a protein-ligand template. The Tanimoto score was calculated using Daylight molecular fingerprint with RDKit [10]. All templates with Tanimoto scores less than two-thirds of the maximal Tanimoto score for the current target were discarded. The Maximum Common Substructure (MCS) was calculated between the target ligand and each of the remaining template ligands. For each target, two MCS were calculated using RDKit with different tolerance criteria: “weak” MCS (atoms and valences should be the same; allow chiral centers to be different; single and aromatic bonds should match each other) and “strict” MCS (allowances mentioned before are prohibited). Several templates with the highest MCS coverage for the given target were taken as final. A special case was BACE_20, for which we additionally constructed a “chimera” built from two templates. Each of these two templates covers a different part of the BACE_20 ligand, with some intersection between them forming a common “core.”
3.3. Starting poses preparation
Despite the advancements in refinement protocols, having a good starting pose is still a prerequisite for achieving a low-RMSD result. For the initial stage of the competition (Stage 1a), the starting poses were prepared using the following multi-stage approach. First, we generated 104 conformers for each target ligand.
For BACE_1 through BACE_19 (macrocyclic molecules), conformer generation was carried out using the robotics-inspired BRIKARD [4] loop closure algorithm. Using inverse kinematics, BRIKARD rigorously samples “driver” torsions according to prescribed intervals and frequencies, while “driven” or “pivot” torsions [4] are computed by recursive ring closure consistently for all interconnected rings. This allows for uniform sampling of all dihedral angle values. BRIKARD allows the manual specification of the order of solving the rings. However, for this study, we used a ring perception algorithm [11] to carry out the recursive ring generation and to find solutions automatically.
For BACE_20 (a non-macrocyclic molecule), we used the ETKDG method [9] from RDKit for the conformer generation. All conformers were minimized in vacuum using Merck Molecular Force Field (MMFF) [12, 13]. Then, for each template (a protein-ligand pair from the template, only one chain from each PDB structure was taken), for both “weak” and “strict” MCS, all possible MCS mappings were generated, taking into account 1) all possible impositions of the MCS on the template and target ligands and 2) internal symmetry of the MCS itself. For each mapping generated this way, we aligned all conformers of the target ligand to the template ligand and retained only the conformer with the best MCS-mapping RMSD. The resulting structures were used as starting poses for the refinement.
In Stage 1b of the competition, we used our Stage 1a submissions as starting poses.
3.4. Refinement
In Stage 1a, the starting poses were subjected to a simplistic restrained energy minimization (RM), in which harmonic restraints were pulling the ligand closer to the template. The RM results were scored and used for the Stage 1a submission.
In Stage 1b, we started from the ligand structures (4 or 5 per target) that we had submitted in Stage 1a. We aligned them to the X-Ray structures of the receptor provided by the organizers. In this stage, we employed four different refinement protocols – restrained minimization (RM, same as in Stage 1a), Monte Carlo on manifold minimization (MCMM), conventional Molecular Dynamics (MD), and MELD-accelerated molecular dynamics (MELD × MD). The resulting structures from all refinement approaches were pooled together and scored for the Stage 1b submission. Details of the refinement protocols follow.
3.4.1. Restrained Minimization
In both Stages 1a and 1b, we employed a straightforward restrained minimization protocol to refine the starting poses. The protocol was based on full-atom energy minimization using a CHARMM-based energy function with a GBSA (ACE) solvation term, described in Ref. [14] and implemented in the libmol2 library (https://bitbucket.org/bu-structure/libmol2/). In Stage 1b, an explicit hydrogen bonding term [15, 16] was added to the energy function. During the minimization procedure, all receptor atoms except hydrogens were fixed, while ligand atoms matching the template were restrained with a harmonic potential to the positions of the corresponding template atoms. Applying the restraints allowed us to overcome the limitations of the general forcefield, and to implicitly harness the details of known BACE1-ligand interactions. Minimization was carried out using the L-BFGS algorithm [17]. Two variations of the minimization protocol, which we term RM_1 and RM_2, were used for each target.
RM_1 had three stages: (1) 500 steps without restraints to remove possible clashes; (2) 500 steps with harmonic restraints (10 kcal/mol/Å2); (3) 500 steps without restraints to allow the structure to settle in the pocket.
RM_2 had five stages: (1) 500 steps of minimization with harmonic restraint (10 kcal/mol/Å2), but without van der Waals, electrostatic, or dihedral potentials to pull the target close to the template structure; (2) same as (1), but the dihedral potential was enabled; (3) same as (2), but all the receptor atoms in the interface were movable; (4) same as (3), but electrostatics and van der Waals potential were enabled; (5) same as (4), but without restraints. RM_2 tends to allow more drastic changes to the ligand structure, making it closer to the template, but sometimes it results in unnaturally twisted dihedrals.
3.4.2. Monte Carlo on Manifold Minimization
The Monte Carlo on manifold minimization algorithm was based on the protocol described previously [1, 2, 6, 14, 18]. MCMM relies on the assumption that covalent bonds and angles can be considered fixed, and thus the molecular flexibility is achieved through the rotation of dihedral angles alone. The molecule in this framework is described as a set of rigid molecular clusters connected by rotatable bonds. While full-atom minimization takes place in a 3N-dimensional space, where N is the number of atoms, the manifold representation reduces this dimensionality to D+6, where D is the number of rotatable dihedrals, and 6 degrees of freedom are responsible for the rigid body movements of the molecule as a whole. Drastic reduction in the dimensionality of the problem allows significant speed-up [5].
In the current version of the protocol, we did not implement the rotations of the internal dihedrals of the cyclic part of the ligand, treating it as a single rigid cluster. However, because the cyclic part was sampled during the generation of the conformers, its flexibility was partially accounted for during the selection of starting poses and the following full-atom RM refinement. During the minimization procedure, we used the same energy function as for the RM refinement, including harmonic restraints [15, 16]. For each starting conformation, we performed 10,000 Monte Carlo steps (kT = 2.0 kcal/mol), from which the pose with the lowest energy was selected and additionally minimized without restraints. The MMCM approach was used only in Stage 1b.
3.4.3. Molecular Dynamics
This refinement procedure, used only in Stage 1b, was reserved for targets for which templates were similar to each other, suggesting a high degree of certainty in the starting model. The starting configuration for the refinement MD simulations was the top-1 pose from our Stage 1a submission, according to our ranking. We used the Amber ff14SB force field [19] to model the protein, and the GAFF force field [20] to model the ligand. The protonation state of the ligand was determined based on the experimental conditions provided by the organizers. Ligand atom partial charges were assigned using the AM1-BCC method [21] implemented in the antechamber module of Amber [20]. Each structure (this includes protein, ligand, crystallographic water molecules, and, in some cases, sulfate ions and glycerol molecules) was solvated using Leap [22] with a TIP3P [23] octahedral water box and at least a 10 Å buffer region between any atom of the system and the edge of the box. Na+ or Cl− ions were added as needed to neutralize the total charge of the system [24].
The MD refinement procedure was similar to the one described in Ref. [2]. For each system, first, a multistage minimization and equilibration protocol was carried for 2.05 ns [25]. Then, an MD production run was carried out for 200 ns with 4.0 fs timesteps, at 300 K and 1 atm. Hard restraints (50 kcal/mol/Å2) were applied to protein heavy atoms, sulfate ions, and glycerol molecules; crystallographic waters were restrained with stronger springs (100 kcal/mol/Å2). Soft restraints (2.5 kcal/mol/Å2) were used for the ligand. This kept the protein close to the crystallographic structure while allowing some degree of relaxation for the side-chains and the ligand.
3.4.4. MELD-accelerated Molecular Dynamics
This refinement procedure was used only in those Stage 1b cases where the chosen templates were significantly different from each other. MELD-accelerated MD (MELD × MD) uses external information to reduce the phase space of physics-based simulations [7, 8]. This is achieved by energetically penalizing the regions of the phase space that do not agree with the information. Since no energetic bias is applied to areas of the phase space that agree with external information, the relative population of these basins is consistent with the relative population of unbiased simulations and can, therefore, be used as a proxy for free energy. To jump between the different basins created by the introduction of the information, energy-bias replica exchange simulations are necessary. For each MELD × MD refinement target, structural information for each of the five starting poses was incorporated into the simulation in two ways:
Ligand heavy atoms positions shared by all the poses were restrained using MELD cartesian restraints (delta = 1 Å, k = 5 kcal/mol/Å2). Other ligand atoms were left unrestrained. Visual inspection was used to identify which ligand heavy atoms are shared between all the poses (and therefore were restrained during the MELD × MD simulation).
Protein and crystallographic water heavy atoms were restrained using hard MELD cartesian restraints (delta = 0.5 Å, k = 5 kcal/mol/Å2).
To reduce the convergence time of the simulations, the five starting poses were seeded along the replica ladder. To further reduce the simulation time, only part of the receptor was simulated in MELD. This part was selected by searching for receptor residues, cofactors, or crystal waters having a heavy atom within 10 Å from the ligand. The system was subjected to the same minimization and equilibration protocol as in the MD protocol before refining with MELD. The MELD simulation was run in a TIP3P explicit solvent environment with a REST2 solute-tempering technique [26]. The effective temperature was scaled from 300 K to 400 K with the MELD Geometric Temperature Scaler. Hydrogen mass repartition was applied. The simulation time step was 4.5 fs. An 8 Å cut-off was used for all interactions.
3.4.5. Clustering Protocol
The following procedure was used to analyze the MD and MELD trajectories. The trajectories were clustered without using any information about starting poses, and the cluster centroids were chosen as final predictions. In the case of MD refinements, the trajectories (one per target) were clustered using the whole 200 ns of trajectory. In the case of MELD simulations, trajectories of only the three lowest replicas were clustered. We used the DBSCAN clustering algorithm [27] implemented in scikit-learn [28]. The distance cut-off was 5.0 Å, and the population cut-off for identifying the core point was 20. The distance metric was the ligand RMSD (LRMSD) computed on all ligand heavy atoms after aligning the receptor Cα’s.
3.5. Scoring and ranking
For each target, the results of all refinement methods (RM for Stage 1a; RM, MCMM, MD, and MELD for Stage 1b) were combined in a single pool and scored together. The results were clustered using the Butina algorithm [29] from RDKit. For each obtained cluster centroid, the AutoDock Vina-based score [30], the CHARMM-based energy score, and the cluster size were calculated. The final model selection was made manually based on these scores and on the fit of the model to known crystallographic ligands binding to the same pocket.
4. Results and discussion
In the analysis of the results below, we used native crystallographic poses provided by the organizers as a reference for RMSD calculation. A custom comparison tool was used, which caused minor discrepancies between the RMSD values reported here and in the official D3R GC4 rankings.
4.1. Macrocycle sampling
One of the main challenges of the current D3R round was a conformational sampling of 19 macrocyclic target ligands (BACE_1 to BACE_19). Their main ring contained 14 to 16 atoms, one (BACE_8, 9, 10, 12–19) or two (BACE_1–7, 11) peptide bonds, up to two fused planar aromatic benzene rings, and up to three flexible sidechains. Besides that, in two ligands (BACE_2 and BACE_13) one of the sidechains additionally included an independent flexible six-atom ring.
Although it is important to have an overall good conformer as a refinement starting point, we wanted to focus our efforts on the conformational sampling of the main rings. The main reason to do so is the relative complexity of the conformational space and energy landscape of the macrocyclic parts compared to those of the sidechains, caused by the loop-closure condition. Unlike the macrocyclic parts, sidechains can be efficiently sampled by the refinement protocols, thus increasing the value of the conformational sampling success for macrocyclic parts. We compared two conformer generators, ETKDG from RDKit [10] and BRIKARD [4], to determine their effectiveness for sampling macrocycles. For each of the macrocyclic targets, we generated 105 conformers with each generator and minimized them in vacuum using Merck Molecular Force Field (MMFF).
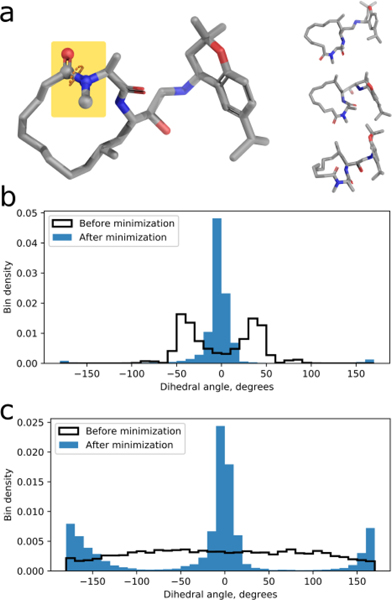
Several generated conformers for target BACE_2, which contains two peptide bonds in the man ring, are shown in Fig. 2a. For the peptide bonds highlighted in Fig. 2a, we found that the structures produced by ETKDG highly over-represented cis conformations. The distribution of the dihedral angle is shown in Fig. 3b, with most of the samples being in a near-cis state. We attribute this bias to the relaxation associated with loop closure via fragment assembly, employed by ETKDG; thus, the sampling exhaustiveness is compromised in favor of a loop-closure condition satisfaction. After MMFF minimization, almost all generated conformers were in a cis state with the trans state being undersampled. In Fig. 2c, we can see that the inverse-kinematic approach of BRIKARD allows broad uniform sampling of all dihedral rotations. After performing MMFF minimization, both cis and trans states are populated.
Fig. 2.
(a) Left: Structure of one of the submitted BACE_2 ligand poses. One of the peptide bond dihedrals is highlighted. Right: Three of the alternative structures for BACE_2 sampled by BRIKARD. (b) The distribution of the peptide bond dihedral in structures generated by ETKDG, before (white bars) and after (blue bars) MMFF energy minimization. (c) The distribution of the peptide bond dihedral in structures generated by BRIKARD in broad sampling mode, before (white bars) and after (blue bars) MMFF energy minimization
Fig. 3.
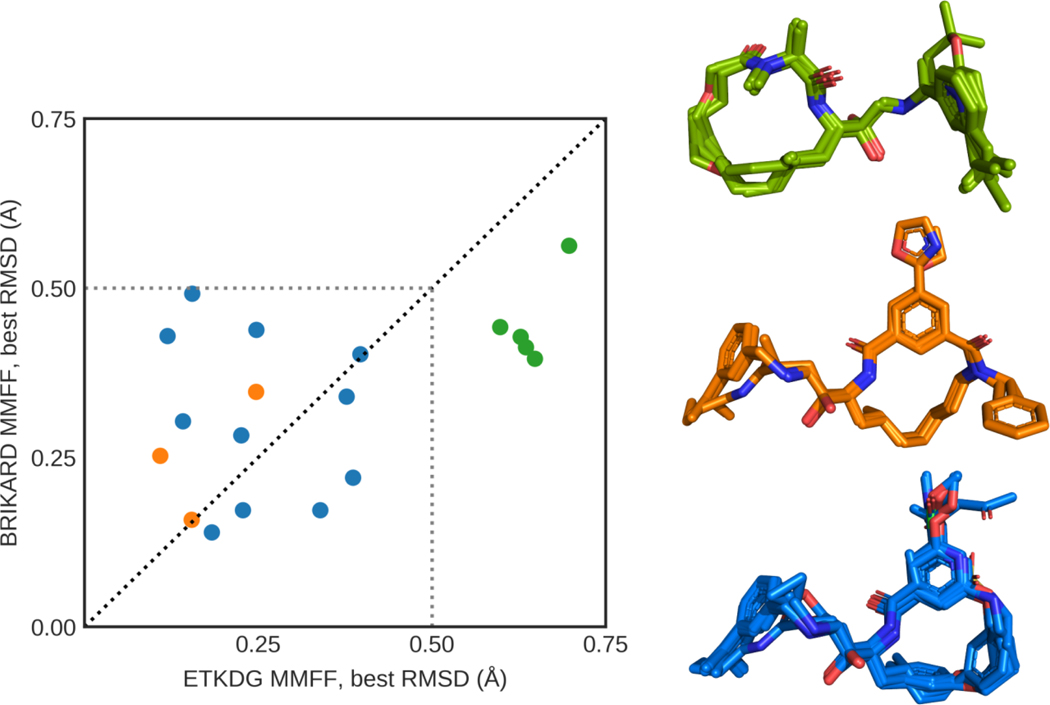
Left: Best macrocyclic RMSD achieved by ETKDG and BRIKARD for each macrocyclic target ligand (BACE_1 to BACE_19). The color of the points reflects the “group” of the macrocycles. Right: Native structures of the macrocyclic target ligands, grouped by the properties of their main ring. “Green” ligands (BACE_2– 5, 11) have two peptide bonds (one of them near a small nitrogen-sidechain); “orange” ligands (BACE_1, 6, and 7) have two peptide bonds (one of them near a large nitrogen-sidechain); “blue” ligands (BACE_8, 9, 10, 12–19) have one peptide bond
After the competition ended and the crystallographic structures of the complexes were released, we calculated RMSDs of all the generated conformers to the native structures, using only macrocyclic parts – all atoms rigidly attached to the main ring – of the molecules (macrocyclic RMSD). The result of the comparison is presented in Fig. 3, where we plot the lowest generated macrocyclic RMSD from the BRIKARD against corresponding value from ETKDG. We divided target ligands into three subgroups based on the number and type of peptide bonds within the macrocycle, indicated by the color of the point. Peptide bonds represent a significant challenge for the sampling of macrocycles by introducing energetic barriers, further complicating the already nontrivial energy landscape of macrocycles. The “blue” macrocycles have only one plain peptide bond with trans native conformation. The “orange” group has an additional peptide bond in cis native conformation, with massive and flexible nitrogen-sidechain. This sidechain prevents the second peptide bond from being in trans conformation because of possible steric clashes with the macrocycle itself, thus simplifying sampling. In terms of best macrocyclic RMSD for “blue” and “orange” subgroups of targets, the performance of both ETKDG MMFF and BRIKARD MMFF is comparable (Fig. 3, left).
A significantly different situation is for the “green” subgroup, where macrocycles contain an additional peptide bond, but with a small sidechain and in trans native conformation (Fig. 3, right). For these peptide bonds (which include the one presented in Fig. 2), we found that the structures produced by ETKDG over-represented cis conformation, while BRIKARD uniformly sampled both cis and trans states. This allowed BRIKARD MMFF to out-perform ETKDG MMFF in terms of best macrocyclic RMSD on all targets in the “green” group (Fig. 3, left).
We believe that for even more complex macrocyclic systems with multiple dihedral barriers and multiple fused rings the ability of BRIKARD to uniformly sample all flexible macrocyclic dihedrals intrinsically taking into account multiple loop closure conditions is of high significance and helps to improve results as, for example, was demonstrated in [4].
We are planning to make BRIKARD publicly available as an automated server. Users will be able to upload the starting cyclic structure or amino acid sequence (in case of a peptidic macrocycle) and specify the desired number of conformers (up to 105). Users will also be able to minimize the energy of each generated conformation, optionally including distance restraints derived from the NMR spectrum or using direct optimization of the 2D NMR spectrum (NOESY). The user will be able to download all the sampled minimized/non-minimized conformers or only the cluster representatives.
4.2. Restrained Minimization
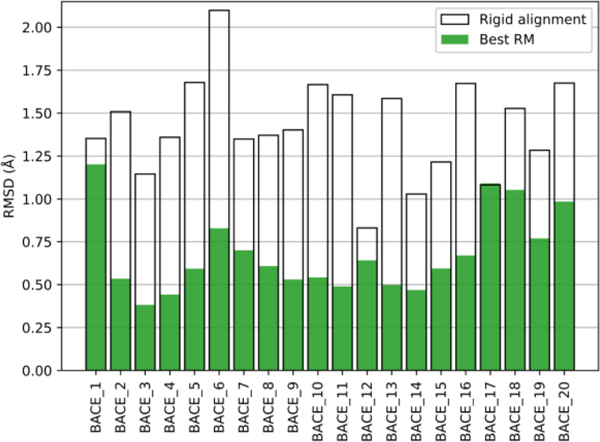
Despite its simplicity, the restrained minimization protocol did significantly improve starting poses in Stage 1a. The results can be seen in Fig. 4, where we show the RMSD values for the best-refined pose (with the lowest RMSD to the reported native structure) and the corresponding starting pose. While in all cases except BACE_12 the starting pose had an RMSD over 1 Å, in most cases energy-based RM succeeded in lowering the RMSD into the sub-angstrom range.
Fig. 4.
Comparison of RM refinement results and starting conformations. The RMSD of the best RM refined pose (green bar) and the corresponding starting pose (white boxes) against the native pose
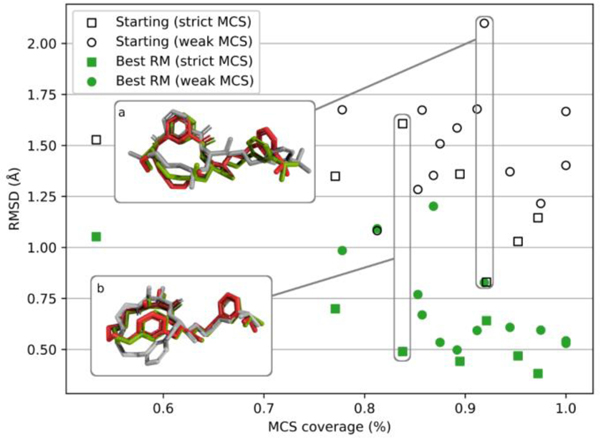
As expected for a template-based method, the accuracy of the refined structure tends to improve with higher template similarity. This effect can be seen in Fig. 5, where we compare the RMSD for the best (lowest RMSD) Stage 1a predictions versus the corresponding MCS coverages. Filled points correspond to the refined structures, while empty points with the same MCS coverages correspond to the starting structures. We also visually separated “weak” MCS (shown as circles) and “strict” MCS (shown as squares). We see that finding a good template, with high MCS coverage, is an important step for obtaining high-quality models with the protocol used.
Fig. 5.
The dependency between the lowest obtained RMSD and the corresponding MCS coverage. For each of the 20 target ligands, two points are shown: a filled one for the best (lowest RMSD) RM-refined pose, and an empty one for the corresponding starting pose. The shape of a point indicates used MCS “flavor”: square for “strict” and circle for “weak.” Inset (a) shows an example of RM refinement for BACE_6, while inset (b) shows RM refinement for BACE_11. In both cases, the native structure is shown in red, the starting structure in gray, and the RM-refined structure in green
Insets (a) and (b) in Fig. 5 showcase examples of the refinements achieved by the RM approach for targets BACE_6 and BACE_11. In the case of BACE_6 (inset a), significant changes in both “tail” and macrocycle are observed, leading to the RMSD reduction from 2.10 Å to 0.83 Å. In the case of BACE_11 (inset b), the tail is relatively constant, but a ring flip happens in the macrocyclic part, reducing the RMSD from 1.61 Å to 0.49 Å.
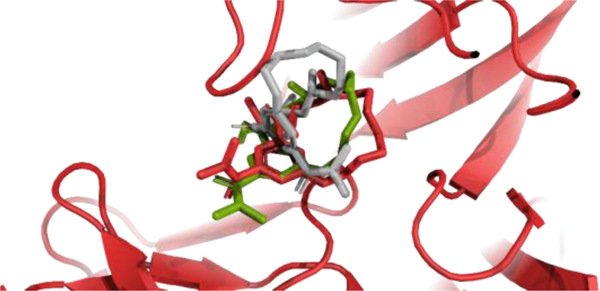
Because the starting poses were built by aligning conformers to the template without taking into account the pocket environment, clashes between the small molecule and protein could occur. One of the structures for BACE_18 might serve as an example of such a situation, as shown in Fig. 6. The clash between a protein loop and the starting macrocycle pose was resolved by RM, reducing the RMSD from 4.10 Å to 1.80 Å.
Fig. 6.
Example of macrocycle refinement with the RM protocol for target BACE_18. The starting pose, obtained by rigid alignment of the sampled structure to the template, is shown in gray. The native pose and RM refined pose are shown in red and green, respectively. The receptor backbone in the native structure is shown in red and is very similar to the backbone in the refined and starting structures
4.3. Monte Carlo on Manifold Minimization
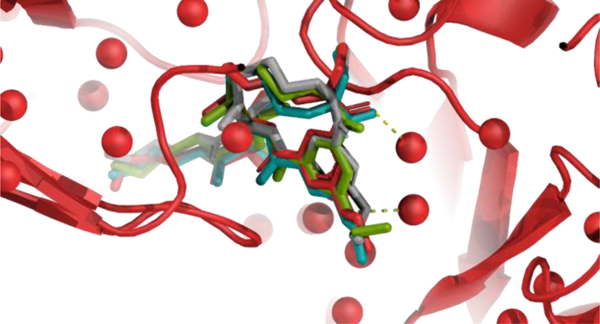
While RM refinement could produce a significant conformational change, it was limited to exploring only local minima. Although perturbations on a manifold did not affect the macrocycles, they did extensively sample side-chains, and subsequent full-atom relaxation led to adjustments of the macrocycle structure as well. For example, Fig. 7 shows the comparison of MCMM and RM refinement for ligand BACE_1 in Stage 1b of the competition. While RM reduced the RMSD from 1.20 Å (starting pose, shown in gray licorice) to 0.94 Å (green licorice), it failed to establish hydrogen bonds with nearby water molecules, despite hydrogen-bonding terms being included in the forcefield. MCMM, on the other hand, sampled ligand side-chains well enough to find the conformation (teal licorice) with these hydrogen bonds, reducing the RMSD to 0.64 Å.
Fig. 7.
Comparison of the MCMM refinement result (teal) and the RM refinement result (green) for BACE_1 in the presence of crystallographic water. The starting pose is shown in gray; the native pose, including receptor and water oxygens, is shown in red. Two hydrogen bonds, formed by native and MCMM-refined poses, and not formed by starting and RM-refined poses, are shown as black dashed lines
However, extensive conformational sampling combined with the general forcefield often led to suboptimal results, and MCMM outperformed RM, in terms of closest RMSD, on only six targets.
4.4. Molecular Dynamics
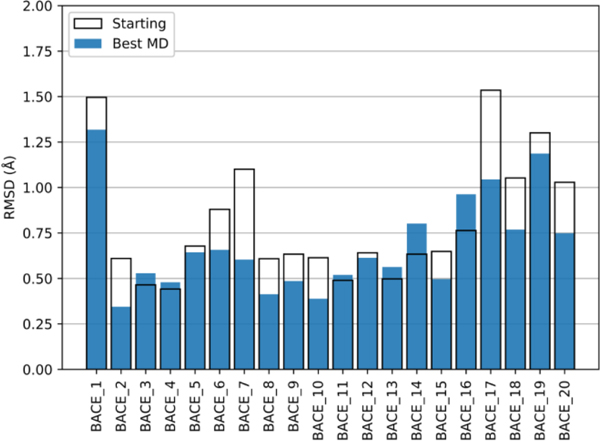
During the competition, conventional MD refinement was not used for systems BACE_8, 9, 17, 18, 19, and 20. However, to make the discussion of the results more complete, the MD refinement protocol was run afterward for the MELD-refined systems as well. We find that MD can slightly refine (most) poses.
Fig. 8 shows the quality of the initial structures (i.e., the top-1 structure from the Stage 1a submission), and how restrained MD can improve the structure of 14 systems. Of these, BACE_2, 6, 7, 10, 17, and 20 have improvements of 0.2 Å or more. In only two (BACE_14 and BACE_17) of the seven remaining systems was the quality of the refined structure slightly worse than the starting structures. This shows that, in most cases, restrained MD simulations can slightly improve the quality of good starting structures. Because the positions of the heavy atoms of the ligand are restrained, the final structures of our simulations cannot deviate significantly from the initial ones. Improvements using this approach are therefore limited to fractions of angstroms. This is still a helpful step for systems where there is a consensus between starting poses because it allows the physics of the system to “relax.”
Fig. 8.
Comparison of MD refinement results and starting conformations. The RMSD of the best MD refined pose (blue bars) and the starting pose (white boxes) against the native pose
4.5. MELD-accelerated Molecular Dynamics
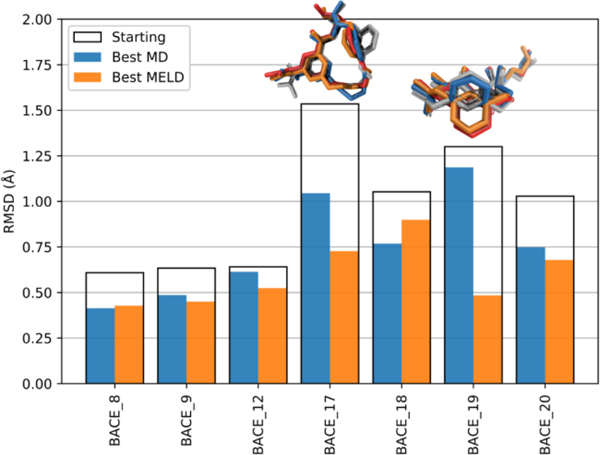
During Stage 1b of the competition, MELD was run only for targets with starting poses that had relatively different structures, namely BACE_8, 9, 12, 17, 18, 19, and 20. In these cases, MELD × MD is able to recognize the best structure and refine it. Fig. 9 shows that, for the seven systems for which alternative poses are available, MELD × MD simulations consistently identified and refined the best pose. For two of the systems, BACE_8 and BACE_9, the top-1 starting pose was already pretty close to native. MELD correctly identified it and refined it. That is, both MD refinement and MELD refinement yielded poses that are similar to each other and to the top-1 starting structure. For BACE_17, the top-1 pose (gray licorice in the structural representation) is not the correct one. MELD × MD correctly identified and refined the correct pose (orange licorice). In this case, MD was also able to relax the incorrect top-1 pose to one closer (blue licorice) to the native one (red licorice), because we left that portion of the ligand unrestrained. For the BACE_19 system, the ring in the top-1 pose was flipped (gray licorice) compared to the native pose (red licorice). MD was not able to relax its orientation (blue licorice). MELD was able to identify the pose with the correct ring orientation and refine it (orange licorice). For BACE_18, MELD gave a slightly worse pose compared to MD. Visualizing the whole trajectory shows that MELD does sample better poses, but the clustering protocol failed to extract them (Supplementary Fig. S1). Clustering with a stricter cut-off might yield better poses.
Fig. 9.
Comparison of MELD refinement results, MD refinement results, and top-1 starting conformations. The best MELD refined pose, best MD refined pose, and top-1 starting pose are shown in orange bars, blue bars, and white boxes, respectively. The corresponding structures for BACE_17 and BACE_19 are shown above the bars in the same colors; the native structure is shown in red
5. Summary
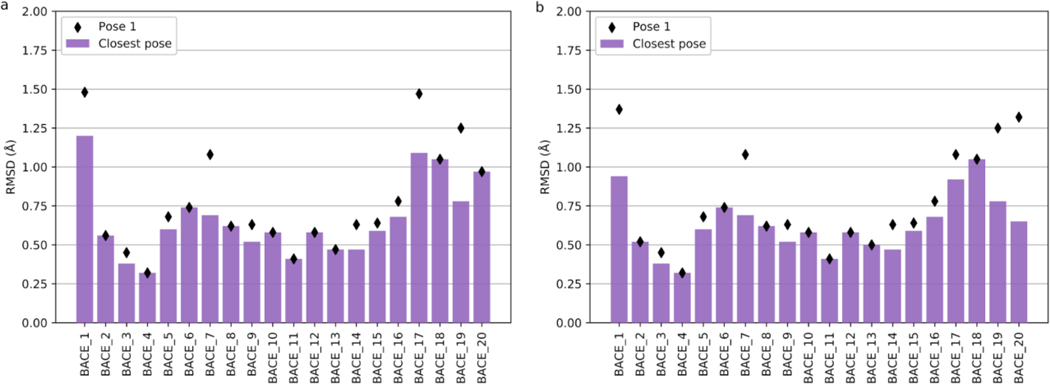
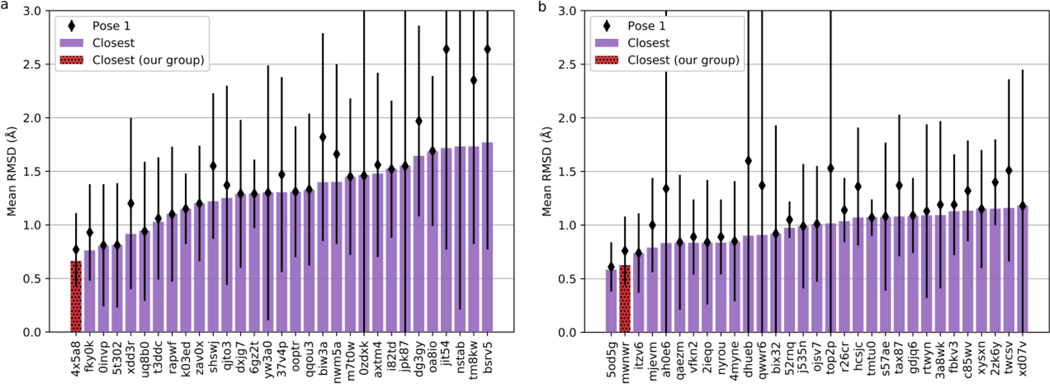
Template search and restrained minimization were enough to achieve low-RMSD scores in Stage 1a of D3R GC4. As evaluated by the organizers, our mean closest RMSD (best of five for each target) value was 0.65 Å, with 18 targets having a sub-angstrom accuracy. Our mean pose-1 RMSD was 0.77±0.34 Å, with 15 targets in the sub-angstrom range (Fig. 10a). This placed our group first in the official Stage 1a rankings by both mean closest and mean pose-1 RMSDs (Fig. 11a).
Fig. 10.
The closest RMSD (bars) and pose-1 RMSD (diamonds) of submitted structures in Stages 1a (a, left) and 1b (b, right), as calculated by the D3R GC4 organizers
Fig. 11.
The top-20 predictors by mean closest RMSD (bars) in official D3R GC4 rankings. Corresponding mean pose-1 RMSD’s with standard deviations are shown in diamonds above the bars. Results for Stage 1a are shown in (a, left); results for Stage 1b are shown in (b, right). The scores of our submissions are shown as hatched red bars
In Stage 1b, with crystallographic receptor structures and a higher number of refinement protocols, the accuracy was further improved. MCMM, MD, and MELD refinement protocols were used to refine the ligand starting conformation, which often resulted in drastic RMSD improvements. Unfortunately, due to technical issues, we were unable to analyze and submit all refinement results in the time allotted. Therefore, not all the results discussed above were included in the official submission, and the overall improvement was marginal compared to Stage 1a. Still, for some targets, we did improve RMSD drastically. For example, the closest RMSD for BACE_20 was 0.97 Å in Stage 1a, and 0.65 Å in the Stage 1b submission. According to the official evaluation, we achieved the mean closest RMSD 0.63 Å, and mean pose-1 RMSD 0.76±0.32 Å (Fig. 10b). Among all participants, we were ranked second in terms of mean closest RMSD, and third in terms of mean pose-1 RMSD (Fig. 11b).
6. Conclusion
A template-based approach has been used in previous rounds of D3R Grand Challenge for protein-ligand docking [31–33], as well as in community-wide protein-protein docking competitions [34–37], and in protein-RNA docking [38, 39]. Our team has developed a novel approach for template-based small molecular docking to proteins and has demonstrated its efficiency in D3R GC4, where we predicted the poses of 20 compounds with 0.76 Å mean pose-1 RMSD and 0.66 Å mean closest (best of five) RMSD. In terms of pose-1, 15 out of 20 compounds were predicted with sub-angstrom accuracy. This has placed us among the best performers in the pose prediction challenge. In our approach, we incorporated ample existing information on the bound ligands for the system of interest with tools we had previously developed. Armed with this data, we were able to produce low-RMSD poses even with a simplistic local refinement method. More advanced structure refinement protocols were able to reduce RMSD even further in Stage 1b, although no single refinement method is clearly superior to others. In particular, a better scoring function would be crucial for ranking the obtained poses. While, for example, the Vina scores did not exhibit a high correlation with RMSD even within multiple poses of the same ligand (see Supplementary Fig. S2), we believe that an automated scoring method can be devised instead of relying on human experts as we did in this competition. Of particular interest are the knowledge-based scoring functions due to their good performance in D3R ranking stages in this and previous years [40–43]. Another possible direction for scoring function optimization is the inclusion of a density-based score, which measures the similarity of the structure to known crystallographic complexes of related compounds.
Supplementary Material
7. Acknowledgments
This work was supported by National Institutes of Health grants R21 GM127952 and 1R01GM125813–01; National Science Foundation grants AF 1816314, AF 1645512, and DBI 1759277; and the National Science Foundation PRAC Award ACI-1713695. Part of this research has been enabled by the Blue Waters sustained-petascale computing project, which is supported by the National Science Foundation (Awards OCI-0725070 and ACI-1238993) and the state of Illinois. Blue Waters is a joint effort of the University of Illinois at Urbana−Champaign and its National Center for Supercomputing Applications.
Footnotes
Publisher's Disclaimer: This Author Accepted Manuscript is a PDF file of an unedited peer-reviewed manuscript that has been accepted for publication but has not been copyedited or corrected. The official version of record that is published in the journal is kept up to date and so may therefore differ from this version.
8.References
- 1.Padhorny D, Hall DR, Mirzaei H, et al. (2018) Protein–ligand docking using FFT based sampling: D3R case study. J Comput Aided Mol Des 32:225–230. 10.1007/s10822-017-0069-7 [DOI] [PMC free article] [PubMed] [Google Scholar]
- 2.Ignatov M, Liu C, Alekseenko A, et al. (2019) Monte Carlo on the manifold and MD refinement for binding pose prediction of protein–ligand complexes: 2017 D3R Grand Challenge. J Comput Aided Mol Des 33:119–127. 10.1007/s10822-018-0176-0 [DOI] [PMC free article] [PubMed] [Google Scholar]
- 3.Vassar R, Bennett BD, Babu-Khan S, et al. (1999) Beta-secretase cleavage of Alzheimer’s amyloid precursor protein by the transmembrane aspartic protease BACE. Science 286:735–741. 10.1126/science.286.5440.735 [DOI] [PubMed] [Google Scholar]
- 4.Coutsias EA, Lexa KW, Wester MJ, et al. (2016) Exhaustive Conformational Sampling of Complex Fused Ring Macrocycles Using Inverse Kinematics. J Chem Theory Comput 12:4674–4687. 10.1021/acs.jctc.6b00250 [DOI] [PMC free article] [PubMed] [Google Scholar]
- 5.Mirzaei H, Beglov D, Paschalidis IC, et al. (2012) Rigid Body Energy Minimization on Manifolds for Molecular Docking. J Chem Theory Comput 8:4374–4380. 10.1021/ct300272j [DOI] [PMC free article] [PubMed] [Google Scholar]
- 6.Mirzaei H, Zarbafian S, Villar E, et al. (2015) Energy Minimization on Manifolds for Docking Flexible Molecules. J Chem Theory Comput 11:1063–1076. 10.1021/ct500155t [DOI] [PMC free article] [PubMed] [Google Scholar]
- 7.Perez A, MacCallum JL, Dill KA (2015) Accelerating molecular simulations of proteins using Bayesian inference on weak information. Proc Natl Acad Sci U S A 112:11846–11851. 10.1073/pnas.1515561112 [DOI] [PMC free article] [PubMed] [Google Scholar]
- 8.MacCallum JL, Perez A, Dill KA (2015) Determining protein structures by combining semireliable data with atomistic physical models by Bayesian inference. Proc Natl Acad Sci U S A 112:6985–6990. 10.1073/pnas.1506788112 [DOI] [PMC free article] [PubMed] [Google Scholar]
- 9.Riniker S, Landrum GA (2015) Better Informed Distance Geometry: Using What We Know To Improve Conformation Generation. J Chem Inf Model 55:2562–2574. 10.1021/acs.jcim.5b00654 [DOI] [PubMed] [Google Scholar]
- 10.Landrum G (2019) RDKit: Open-source cheminformatics https://rdkit.org/
- 11.Coutsias EA, Wester MJ (2019) Multiple Loop Closure and Ring Perception (unpublished) [Google Scholar]
- 12.Halgren TA (1996) Merck molecular force field. I. Basis, form, scope, parameterization, and performance of MMFF94. J Comput Chem 17:490–519 [Google Scholar]
- 13.Tosco P, Stiefl N, Landrum G (2014) Bringing the MMFF force field to the RDKit: implementation and validation. J Cheminform 6:37 10.1186/s13321-014-0037-3 [DOI] [Google Scholar]
- 14.Moghadasi M, Mirzaei H, Mamonov A, et al. (2015) The impact of side-chain packing on protein docking refinement. J Chem Inf Model 55:872–881. 10.1021/ci500380a [DOI] [PMC free article] [PubMed] [Google Scholar]
- 15.Kortemme T, Morozov AV, Baker D (2003) An Orientation-dependent Hydrogen Bonding Potential Improves Prediction of Specificity and Structure for Proteins and Protein–Protein Complexes. J Mol Biol 326:1239–1259. 10.1016/S0022-2836(03)00021-4 [DOI] [PubMed] [Google Scholar]
- 16.Wedemeyer WJ, Baker D (2003) Efficient minimization of angle-dependent potentials for polypeptides in internal coordinates. Proteins 53:262–272. 10.1002/prot.10525 [DOI] [PubMed] [Google Scholar]
- 17.Liu DC, Nocedal J (1989) On the limited memory BFGS method for large scale optimization. Math Program 45:503–528. 10.1007/BF01589116 [DOI] [Google Scholar]
- 18.Mamonov AB, Moghadasi M, Mirzaei H, et al. (2016) Focused grid-based resampling for protein docking and mapping. J Comput Chem 37:961–970. 10.1002/jcc.24273 [DOI] [PMC free article] [PubMed] [Google Scholar]
- 19.Maier JA, Martinez C, Kasavajhala K, et al. (2015) ff14SB: Improving the Accuracy of Protein Side Chain and Backbone Parameters from ff99SB. J Chem Theory Comput 11:3696–3713. 10.1021/acs.jctc.5b00255 [DOI] [PMC free article] [PubMed] [Google Scholar]
- 20.Wang J, Wolf RM, Caldwell JW, et al. (2004) Development and testing of a general amber force field. J Comput Chem 25:1157–1174. 10.1002/jcc.20035 [DOI] [PubMed] [Google Scholar]
- 21.Jakalian A, Bush BL, Jack DB, Bayly CI (2000) Fast, efficient generation of high-quality atomic charges. AM1-BCC model: I. Method. J Comput Chem 21:132–146 [DOI] [PubMed] [Google Scholar]
- 22.Case DA, Betz RM, Cerutti DS, et al. (2016) AMBER 2016 Reference Manual [Google Scholar]
- 23.Jorgensen WL, Chandrasekhar J, Madura JD, et al. (1983) Comparison of simple potential functions for simulating liquid water. J Chem Phys 79:926–935. 10.1063/1.445869 [DOI] [Google Scholar]
- 24.Joung IS, Cheatham TE 3rd (2008) Determination of alkali and halide monovalent ion parameters for use in explicitly solvated biomolecular simulations. J Phys Chem B 112:9020–9041. 10.1021/jp8001614 [DOI] [PMC free article] [PubMed] [Google Scholar]
- 25.Hornak V, Okur A, Rizzo RC, Simmerling C (2006) HIV-1 protease flaps spontaneously open and reclose in molecular dynamics simulations. Proc Natl Acad Sci U S A 103:915–920. 10.1073/pnas.0508452103 [DOI] [PMC free article] [PubMed] [Google Scholar]
- 26.Wang L, Friesner RA, Berne BJ (2011) Replica exchange with solute scaling: a more efficient version of replica exchange with solute tempering (REST2). J Phys Chem B 115:9431–9438. 10.1021/jp204407d [DOI] [PMC free article] [PubMed] [Google Scholar]
- 27.Ester M, Kriegel H-P, Sander J, Xu X (1996) A density-based algorithm for discovering clusters in large spatial databases with noise. In: Proceedings of the Second International Conference on Knowledge Discovery and Data Mining AAAI Press, pp 226–231 [Google Scholar]
- 28.Pedregosa F, Varoquaux G, Gramfort A, et al. (2011) Scikit-learn: Machine Learning in Python. J Mach Learn Res 12:2825–2830 [Google Scholar]
- 29.Butina D (1999) Unsupervised Data Base Clustering Based on Daylight’s Fingerprint and Tanimoto Similarity: A Fast and Automated Way To Cluster Small and Large Data Sets. J Chem Inf Comput Sci 39:747–750. 10.1021/ci9803381 [DOI] [Google Scholar]
- 30.Trott O, Olson AJ (2010) AutoDock Vina: improving the speed and accuracy of docking with a new scoring function, efficient optimization, and multithreading. J Comput Chem 31:455–461. 10.1002/jcc.21334 [DOI] [PMC free article] [PubMed] [Google Scholar]
- 31.Duan R, Xu X, Zou X (2018) Lessons learned from participating in D3R 2016 Grand Challenge 2: compounds targeting the farnesoid X receptor. J Comput Aided Mol Des 32:103–111. 10.1007/s10822-017-0082-x [DOI] [PMC free article] [PubMed] [Google Scholar]
- 32.da Silva Figueiredo Celestino Gomes P, Da Silva F, Bret G, Rognan D (2018) Ranking docking poses by graph matching of protein-ligand interactions: lessons learned from the D3R Grand Challenge 2. J Comput Aided Mol Des 32:75–87. 10.1007/s10822-017-0046-1 [DOI] [PubMed] [Google Scholar]
- 33.Fradera X, Verras A, Hu Y, et al. (2018) Performance of multiple docking and refinement methods in the pose prediction D3R prospective Grand Challenge 2016. J Comput Aided Mol Des 32:113–127. 10.1007/s10822-017-0053-2 [DOI] [PubMed] [Google Scholar]
- 34.Lensink MF, Velankar S, Kryshtafovych A, et al. (2016) Prediction of homoprotein and heteroprotein complexes by protein docking and template-based modeling: A CASP-CAPRI experiment. Proteins 84 Suppl 1:323–348. 10.1002/prot.25007 [DOI] [PMC free article] [PubMed] [Google Scholar]
- 35.Kundrotas PJ, Anishchenko I, Badal VD, et al. (2018) Modeling CAPRI targets 110–120 by template-based and free docking using contact potential and combined scoring function. Proteins 86 Suppl 1:302–310. 10.1002/prot.25380 [DOI] [PMC free article] [PubMed] [Google Scholar]
- 36.Peterson LX, Shin W-H, Kim H, Kihara D (2018) Improved performance in CAPRI round 37 using LZerD docking and template-based modeling with combined scoring functions. Proteins 86 Suppl 1:311–320. 10.1002/prot.25376 [DOI] [PMC free article] [PubMed] [Google Scholar]
- 37.Porter KA, Padhorny D, Desta I, et al. (2019) Template-Based Modeling by ClusPro in CASP13 and the Potential for Using Co-evolutionary Information in Docking. Proteins: Struct Funct Bioinf (in press) 10.1002/prot.25808 [DOI] [PMC free article] [PubMed] [Google Scholar]
- 38.Zheng J, Kundrotas PJ, Vakser IA, Liu S (2016) Template-Based Modeling of Protein-RNA Interactions. PLoS Comput Biol 12:e1005120. 10.1371/journal.pcbi.1005120 [DOI] [PMC free article] [PubMed] [Google Scholar]
- 39.Zheng J, Hong X, Xie J, et al. (2019) P3DOCK: a protein-RNA docking webserver based on template-based and template-free docking. Bioinformatics. 10.1093/bioinformatics/btz478 [DOI] [PubMed] [Google Scholar]
- 40.Kadukova M, Grudinin S (2017) Convex-PL: a novel knowledge-based potential for protein-ligand interactions deduced from structural databases using convex optimization. J Comput Aided Mol Des 31:943–958. 10.1007/s10822-017-0068-8 [DOI] [PubMed] [Google Scholar]
- 41.Jiménez J, Škalič M, Martínez-Rosell G, De Fabritiis G (2018) KDEEP: Protein–Ligand Absolute Binding Affinity Prediction via 3D-Convolutional Neural Networks. J Chem Inf Model 58:287–296. 10.1021/acs.jcim.7b00650 [DOI] [PubMed] [Google Scholar]
- 42.Nguyen DD, Cang Z, Wu K, et al. (2019) Mathematical deep learning for pose and binding affinity prediction and ranking in D3R Grand Challenges. J Comput Aided Mol Des 33:71–82. 10.1007/s10822-018-0146-6 [DOI] [PMC free article] [PubMed] [Google Scholar]
- 43.Sunseri J, King JE, Francoeur PG, Koes DR (2019) Convolutional neural network scoring and minimization in the D3R 2017 community challenge. J Comput Aided Mol Des 33:19–34. 10.1007/s10822-018-0133-y [DOI] [PMC free article] [PubMed] [Google Scholar]
Associated Data
This section collects any data citations, data availability statements, or supplementary materials included in this article.


