

SUMMARY
Mitochondrial-driven alterations of the epigenome have been reported, but whether they are relevant at the organismal level remains unknown. The viable yellow agouti mouse (Avy) is a powerful epigenetic biosensor model that reports on the DNA methylation status of the Avy locus, which is established prior to the three-germ-layer separation, through the coat color of the animals. Here we show that maternal exposure to rotenone, a potent mitochondrial complex I inhibitor, not only changes the DNA methylation status of the Avy locus in the skin but broadly affects the liver DNA methylome of the offspring. These effects are accompanied by altered gene expression programs that persist throughout life, and which associate with impairment of antioxidant activity and mitochondrial function in aged animals. These pervasive and lasting genomic effects suggest a putative role for mitochondria in regulating life-long gene expression programs through developmental nuclear epigenetic remodeling.
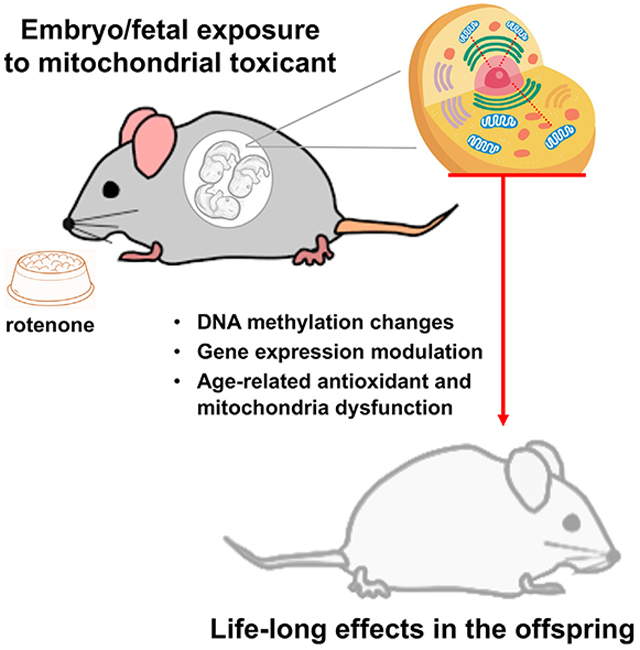
Graphical Abstract
In Brief
Lozoya et al. provide in vivo evidence of the epigenetic effects of mitochondrial dysfunction. Developmental-only exposure to rotenone through the mother’s diet inhibits mitochondrial complex I in the dams and results in lifelong nuclear DNA methylation and gene expression changes in the offspring. Aged offspring also show functional outcomes.
INTRODUCTION
Mitochondrial function broadly affects cell biology, including the epigenome. Over a decade ago, changes in DNA methylation as a function of mitochondrial DNA (mtDNA) content were first reported (Smiraglia et al., 2008), and more recently, alterations in histone methylation and acetylation were found upon mitochondrial dysfunction (Ansó et al., 2017; Lozoya et al., 2018a, 2019). In this context, we showed that the epigenetic changes associated with progressive mitochondrial DNA depletion influenced gene expression programs, which notably could be reversed by modulating the tricarboxylic acid (TCA) cycle through genetic or pharmacological means (Lozoya et al., 2018a, 2019). Activation of methionine salvage was involved in altered DNA methylation while mitochondrial-derived acetyl-CoA influenced the histone acetylation landscape (Lozoya et al., 2018a, 2019). Other links between mitochondrial metabolism and the epigenome involving reactive oxygen species (ROS) or TCA metabolites such as α-ketoglutarate or 2-hydroxyglutarate have been proposed (Ansó et al., 2017; Hitchler and Domann, 2012). Still, the physiological relevance of the effects of mitochondrial dysfunction on epigenetics at the organismal level remains ill defined.
The viable yellow agouti mouse (Avy) is an epigenetic biosensor model widely used in the field of environmental epigenetics. One of its advantages is that the DNA methylation status of the Avy locus influences the coat color of the animals, which can be used as a visual screen to evaluate changes in DNA methylation in vivo (Waterland and Jirtle, 2003). Also, because the epigenetic state of this locus is established before the three-germ-layer separation (Dolinoy et al., 2006,2007; Michaud et al., 1994), the DNA methylation status of Avy in the skin reflects the methylation state of the locus in other tissues (Michaud et al., 1994). Notably, work on this model showed that maternal exposure to different diets and physical or chemical agents, such as bisphenol A, alter the DNA methylation state of the Av locus in the offspring from the exposed mothers, impacting health outcomes in adulthood such as cancer risk or obesity (Dolinoy et al., 2006, 2007; Jirtle, 2014). These results support the concept of Developmental Origins of Health and Disease (DOHaD) in demonstrating that epigenome remodeling by early developmental exposures can have long-term health outcomes. However, the mechanism(s) underlying the epigenetic changes that lead to the variable penetrance of the Avy allele remains unknown but cannot be attributed to variability in the genetic background of animals since experiments were conducted on an inbred strain. It is also unclear how the treatments of the mothers during pregnancy lead to changes in the epigenetic status of the Avy allele in the offspring.
Here, we tested the hypothesis that subtle modulation of mitochondrial function in early development underlies the changes in DNA methylation in the Avy locus, which we also hypothesize extends beyond Avy. To modulate mitochondrial function, we exposed animals to rotenone, a widely studied pesticide that specifically inhibits the site of NADH oxidation on mitochondrial complex I. Since detoxification of rotenone in the liver by cytochrome P450s leads to the formation of two major metabolites that are also mitochondrial complex I inhibitors (Caboni et al., 2004; Fukami et al., 1967; Unai et al., 1973), the overall outcome of rotenone exposure (or its metabolism) is mitochondrial inhibition. Finally, given the absorption and distribution rates of rotenone (Fukami et al., 1967; Unai et al., 1973), maternal exposure through the diet is expected to affect the whole body, including the pregnant uterus (Durkin, 2008; Spencer, 1981; Spencer and Sing, 1982), the embryo, and the fetus (Krishna and Muralidhara, 2018).
RESULTS
Maternal Modulation of Mitochondrial Function Leads to Hypomethylation of the Avy Locus in the Offspring
A previous report by the National Toxicology Program (NTP) demonstrated that a 2-year dietary exposure of B6C3F1 mice to 600- or 1,200-ppm rotenone had no adverse health effects (Abdo et al., 1988). Thus, we started by exposing C57BL6/J mice, the predominant genetic background of the Avy animals, to 300-ppm and 600-ppm dietary rotenone. However, these concentrations were highly toxic to this strain, with severe effects observed within two days of feeding with the highest dose and multiorgan toxicity observed after 15 days of 300-ppm rotenone (Figure S1A; Data S1). Thus, a series of additional experiments involving lower doses and parameters such as feed palatability, food consumption, fertilization, and pregnancy rates were undertaken, leading to the selection of 10-ppm and 150-ppm dietary rotenone. Considering the daily food consumption of C57BL6/J mice, these values are estimated as 2 mg/Kg and 30 mg/Kg, respectively. Feasibility of formulating feed with rotenone at these concentrations and its stability over the eight experimental weeks were established in advance.
Dams (180 females, 8 weeks old) received control- or rotenone-supplemented diets starting 2 weeks prior to mating, during gestation and lactation; males carrying the Avy mutation were only exposed during the mating period. Offspring from control or treated females were coat color-scored at weaning, at which point they were put on the control diet until ~24 months of age (Figure 1A). A total of 669 offspring were generated, about half of which carried the Avy mutation (Table 1). The 150-ppm feeding significantly altered most parameters evaluated (Fisher’s exact test: p < 0.0001) including pregnancy rate, litter size, and pup survival rate relative to the control group despite no signs of overt toxicity. Control and the 10 ppm-cohort were indistinguishable although rotenone increased survival rate (p < 0.0001; Table 1). Visual inspection of the Avy offspring revealed a change in coat-color distribution in the treated cohorts relative to control (Pearson p < 0.03) with an increase in the frequency of fully yellow-coated animals at both 10 and 150-ppm when the offspring was pooled (Figure 1B) or sex was scored separately (Figure S1B). Coat color can be arranged in order of increasing methylation from yellow, to lightly mottled, to mottled, to highly mottled and to pseudoagouti, and Somers’ test revealed a significant correlation (p = 0.005) between this order and rotenone at 150-ppm (Figure 1B). Coat color of individual animals did not change as they aged, confirming stability of the DNA methylation status of the Avy locus in the hair follicle as in earlier studies (Dolinoy, 2008). Also, animals with varying degrees of yellow coat became obese within eight weeks, as previously found (Duhl et al., 1994; Michaud et al., 1994, 1997)—an effect that was not modulated by rotenone. These results provide unequivocal evidence that developmental exposure to rotenone impacted the nuclear epigenome in a way that affected the coat-color distribution of the Avy offspring.
Figure 1. Maternal Rotenone Exposure Alters Mitochondria Function and Offspring DNA Methylation at the Avy Locus.

(A) Schematic representation of experimental design.
(B) Frequency of Y (yellow), LM (lightly mottled), M (mottled), HM (heavily mottled), or PA (pseudoagouti) animals in each experimental group; n = 212; an asterisk (*) depicts statistical significance.
(C) Polarographic traces of oxygen consumption through complex I (malate + glutamate; upper left panel) or II (succinate + rotenone, middle panel). Coupled respiration (graph) was calculated based on CCCP (carbonyl cyanide m-chlorophenyl hydrazone) measurements; n = 4/group; data are means ± SD.
(D) Western blots of OXPHOS complexes.
(E) MnSOD activity was measured in isolated liver mitochondria (n = 4); data are means ± SD.
(F) Representative liver images of anti-DMPO staining at 50-μm scale.
(G) DMPO-trapped free radical intermediates in isolated liver mitochondria or whole liver lysates from control or rotenone-treated dams, with same animals as used for (F); n = 5; data are means ± SD.
(H) Coat-color distribution in the offspring of mCAT transgenics crossed with Avy mutants; n = 164.
See also Figure S1.
Table 1.
Characteristics of Litters across the Cohorts
| Endpoint | Control | 10 Ppm | 150 Ppm |
|---|---|---|---|
| Pregnancy rate | 47/60 (80%) | 50/60 (85%) | 43/60 (72%) |
| Days to delivery | 25 ± 4.8 | 25.8 ± 6.3 | 29 ± 9 |
| Number of litters | 40 | 39 | 28 |
| Litter size | 6.96 ± 1.3 | 6.92 ± 1.6 | 4.3 ± 1.6 |
| Number of pups | 278 | 270 | 121 |
| Pup survival rate | 76.5% | 84.3% | 50.05% |
| A/a offspring | 47.62% | 51.36% | 41% |
| Male offspring | 48.81% | 47.27% | 66% |
| Weight at weaning | 8.37 ± 1.7 | 7.58 ± 1.08 | 5.65 ± 0.44 |
| AloDecia | 0 | 1 (0.3%) | 6 (4.96%) |
By inhibiting complex I, rotenone impairs cellular respiration and increases mitochondrial superoxide (O2·−) levels. As some epigenetic enzymes are redox sensitive (Hitchler and Domann, 2012) and O2·− can deprotonate DNA favoring DNA methylation (Shrishrimal et al., 2019), increased ROS could underlie the rotenone effects on the Avy locus. To address this, we monitored oxygen consumption in isolated liver mitochondria from exposed dams, which showed a dose-dependent decrease in complex I- and complex II-driven respiration relative to controls (Figure 1C); no changes in oxidative phosphorylation (OXPHOS) protein abundance were identified (Figure 1D). Importantly, a dose-dependent enhancement in mitochondrial superoxide dismutase (MnSOD) activity was observed in the rotenone-fed animals (Figure 1E), indicating increased O2·− levels as a byproduct of complex I inhibition. However, this increase in ROS was not sufficient to cause oxidative damage as use of an antibody against the spin trapper 5,5-dimethyl-1-pyrroline N-oxide (DMPO), which traps free radical intermediates in membrane, proteins, and DNA (Mason, 2016), did not reveal differences between control and treated damns in situ (Figure 1F), in whole liver homogenates or in isolated mitochondria (Figure 1G).
The lack of differential DMPO signal between controls and treated samples does not fully rule out a role for O2·−, as mitochondrial ROS can be used for signaling without inducing oxidative damage. Thus, to test whether more physiological changes in the levels of mitochondrial ROS could affect coat-color distribution, we next crossed Avy males with females from the mCAT model (Schriner et al., 2005). mCAT animals express mitochondrial-targeted catalase, a potent detoxifier of hydrogen peroxide (H2O2) that is the byproduct of O2·− dismutation, either spontaneously or through MnSOD. Decreasing physiological levels of mitochondrial ROS in this model showed to significantly improve tissue function and increase animal lifespan (Schriner et al., 2005). However, expression of the mCAT transgene had no impact in coat-color distribution in the viable yellow mice (Figure 1H). Given the data showing robust MnSOD activation, and no signs of oxidative damage but significant changes in the frequency of yellow animals, these results suggest that redox changes may not mediate the effects of rotenone on DNA methylation at the Avy locus.
Maternal Rotenone Exposure Alters Genome-wide DNA Methylation in the Offspring
Next, we defined if the rotenone-driven DNA methylation changes went beyond the Avy locus in the skin by performing whole genome bisulfite sequencing (WGBS; 7× coverage/animal) at a single nucleotide resolution in the livers of the offspring. For this analysis, we only used black mice from control or 10-ppm cohorts to avoid confounding effects associated with the metabolic syndrome of yellow animals and the toxicities associated with 150-ppm treatment (Table 1). Livers were chosen because rotenone is metabolized by hepatic P450s with a half-life of three to five days (Caboni et al., 2004; Fukami et al., 1967; Unai et al., 1973). Thus, effects observed later in life would not derive from residual rotenone or its metabolites. WGBS of males and females at PND22 (D22) and at six months showed no evidence of sex-specific DNA methylation differences (Figure S2A); thus, we sequenced females-only at D22-, 6-, 12-, and 18 months. Analysis of differentially methylated regions (DMRs) identified several loci that did not follow the same patterns between the groups, which was obvious at D22 and extended throughout life (Figure 2). Consistent with the absence of contemporaneous rotenone, MnSOD activity was not different between groups at D22 (Figure S2B). Each line on the heatmaps displays DMRs that were different at any given time in each group; the same locus is displayed across to show the dynamics of DNA methylation over time (Figure 2). Data were clustered (1–6) and plotted based on patterns followed by the DMRs in each group separately, which included increased hypermethylation, hypomethylation, or mixed patterns over time. Here, DMRs represented <0.5% of the liver autosomal DNA methylome (Figure S2C), in line with a recent report (Grimm et al., 2019).
Figure 2. Perinatal Rotenone Exposure Modulates Changes in the Aging Liver DNA Methylome.

Heatmap displays DMRs: blue, hypermethylated; yellow, hypomethylated. Colored bars depict clusters (numbered 1–6); amount of DMRs that follow the cluster pattern is shown on the right. Time in months; D22 = post-natal day 22.
(A) DMRs on control animals (left panel); same loci in treated counterparts (right panel).
(B) DMRs found in the rotenone cohort (left panel); same loci in controls (right panel).
(C) Distance of DMRs to transcriptional start sites (TSSs) was calculated using Gencode VM18.
(D) Upper Venn diagram depicts overlap between all liver DMRs in control or rotenone-exposed offspring; lower Venn diagram shows DMR overlap at each time point relative to D22 within each group. In black, number of DMR-associated genes identified at baseline that were continuously differentially methylated over time.
We found 7,716 DMRs when analyzing the DNA methylome of the control group (Figure 2A, left panel); we call these “aging DMRs,” as they reflect changes that occur naturally with age. The status of these DMRs changed dynamically over time, an effect mostly dampened in the rotenone-exposed offspring (Figure 2A, right panel). A similar number of DMRs (7,558 loci) was identified when analyzing the treated cohort (Figure 2B, left panel), but most of the loci, other than those following the pattern of cluster 4, were not identified as DMRs in control animals (Figure 2B, right panel). These data show that rotenone blunted the normal aging-related DNA methylation changes in some liver loci; it also induced new changes in others. Collectively, these results show that the effects of perinatal rotenone exposure extended beyond the Avy locus in the skin and the time of toxicant exposure, persisting through the lifespan of the animals.
DNA Methylation Changes Occur in Loci that Are Relevant to Liver Physiology
We next defined whether DMRs occurred in gene desert areas or close to genes, where they could influence biological outcomes. We found that most DMRs were located between 1 and 100 Kb of genes’ transcriptional start sites (TSSs; Figure 2C), which led us to arbitrarily assign a DMR to the closest TSS allowing the identification of genes putatively influenced by those regions. A full list of the DMRs, their coordinates, the name of the closest gene and TSS, and their methylation status after rotenone exposure, are presented in Table S1. The degree of overlap of each individual DMR between the two groups was not very high (Figure S2D), but at the DMR-gene-assigned level it reached ~60% (all genes, Figure 2D, upper panel) or 20% to 30% at each time point (Figure 2D, lower panel). We then performed pathway enrichment analysis using KEGG (Kyoto Encyclopedia of Genes and Genomes) and found that most pathways, while common between the two groups, ranked differently (Table S1). For instance, the top category associated with aging DMRs was cholesterol metabolism followed by bile secretion, which ranked 29 and 6, respectively, when considering DMRs from the exposed cohort (Table S1). Conversely, drug metabolism was ranked first in the rotenone-exposed animals while Hippo signaling, which regulates organ size through cell proliferation and apoptosis, was ranked third. In the controls, Hippo signaling was ranked 69 while drug metabolism was ranked 18th (Table S1). Because ranking is a function of gene representation within a pathway, these results are consistent with the liver DMRs responding to aging or to the early rotenone challenge by affecting biology to different degrees.
DMRs can impact transcription factor (TF) binding. Likewise, genomic DNA sequences within a group of select TF binding sites can influence local DNA methylation (Grimm et al., 2019). Thus, we next applied a motif analysis algorithm (HOMER) to determine which TFs were enriched by the DMRs. We found significant enrichment for several TFs, including some associated with the regulation of mitochondrial function, e.g., NRF-1 (Nuclear Respiratory Factor 1) and some whose binding could be affected by DNA methylation (Grimm et al., 2019). TFs relevant to the liver and/or to xenobiotic exposure were also identified, including ARNT (aryl hydrocarbon receptor nuclear translocator), a protein that binds to ligand-bound aryl hydrocarbon receptor and aids in its nuclear localization to promote the expression of genes involved in xenobiotic metabolism; EGR1 (early growth response element 1), which is involved in differentiation and mitogenesis; and HNF6 (hepatocyte nuclear factor 6), which is a liver-specific TF (Figure S2E).
Early Developmental Rotenone Exposure Alters the Normal Age-Related Liver Gene Expression Program with Functional Outcomes
The concept of DOHaD posits that early life exposures influence late life health outcomes, and epigenetic alterations may be central for such protracted effects (Harvey, 2019; Safi-Stibler and Gabory, 2020). Hence, we next interrogated whether developmental rotenone exposure also impacted the transcriptome. By performing RNA sequencing (RNA-seq) in the livers of the pups at PND22, 6-, 12-, and 18-month old animals, we found that early rotenone exposure resulted in a unique transcriptional profile (Table S2). For example, 252 differentially expressed genes (DEGs) were found at baseline (PND22 control versus rotenone; Table S2) and >2,000 DEGs were identified in 6-, 12-, or 18-month-old animals (Figure 3A). Up to 87% of the genes differentially expressed with age were shared between the two groups (Table S2), reflecting a highly coordinated gene expression program in the liver that occurs with age. Ingenuity Pathway Analysis (IPA) of these common DEGs indicated that the biological processes associated with advancing age involved cell cycle regulation, DNA repair, nucleotide synthesis, hepatic steatosis, and various signaling pathways (Table S2).
Figure 3. Perinatal Rotenone Exposure Leads to Life-Long Changes in the Liver Transcriptome.

(A) Venn diagram depicts the overlap of DEGs at each time point; baseline DEGs stem from comparisons between at D22.
(B) Heatmap of DEG-enriched biological pathways.
(C) SOD activities were measured in livers from control- or 10-ppm rotenone-exposed offspring; n = 4; data are means ± SD.
(D) Oxygen consumption through complex I (malate + glutamate) or II (succinate + rotenone) was determined in isolated mitochondria; n = 4; data are means ± SD.
(E) RNA-seq counts for actin, succinate dehydrogenase, and the SOD genes; data were normalized to actin.
(F) Representative immunoblot in whole liver homogenates.
(G) Animals were probed for the lipid peroxidation product 4HNE.
The pathways enriched at baseline involved cholesterol and mevalonate pathways among signaling changes (Table S2; Figure 3B in gray). This is noteworthy since these pathways were also enriched when using DMRs (Table S1). Pronounced transcriptomic changes occurred at the 6-, 12-, and 18-month time points when hundreds of genes uniquely altered in the rotenone-exposed group were found (Figure 3A). This is remarkable, as rotenone exposure ceased at weaning. DEGs in the control animals enriched primarily for signaling and the immune response (Figure 3B in purple; Table S5). Expression of these genes was not changed in the perinatally exposed animals, so we interpreted these data to mean that rotenone treatment interferes with the normal transcriptional program associated with aging. The DEGs uniquely altered in the rotenone-exposed cohort enriched for various signaling and metabolic pathways (Table S2), most of which were identified at baseline (Figure 3B). Notably, none of the cytochrome P450 genes, which metabolize rotenone, were differentially expressed (Table S2). Likewise, no genes involving tubulin or its polymerization, the only other known target of rotenone (Heinz et al., 2017), were differentially transcribed (Table S2).
Prompted by the downregulation of many solute carriers associated with the transport of amino acids and metals (Table S2) that were also differentially methylated (Table S1), including those for Zn and Mn, we next evaluated SOD activity in the livers of the developmentally exposed offspring. Altered Zn and Mn transporters have been associated with familial forms of diseases characterized by SOD dysfunction (Anagianni and Tuschl, 2019; Kaneko et al., 2015). We evaluated 12-month-old animals, which is when the largest transcriptional changes were observed, and found decreased MnSOD and Cu,Zn-SOD enzymatic activities (Figure 3C). We also found diminished complex I- and complex II-driven respiration in isolated mitochondria (Figure 3D), an outcome previously linked to impaired MnSOD (Lustgarten et al., 2011). Altered SOD or mitochondrial function was not associated with their decreased gene transcription (Figure 3E; Table S2) nor did they reflect decreased mitochondrial content or SOD protein (Figure 3F). We did find elevated levels of 4-hydroxynonenal (4HNE), a stable byproduct of lipid peroxidation, in two out of three livers examined from the rotenone-treated cohort (Figure 3G). However, overt pathological changes in four major organs were not identified in 10 independent animals (Table S3).
Collectively, these findings show that rotenone exposure through the mother led to significant molecular (transcriptional) and functional (enzymatic activity) changes in the livers of the offspring, which were detectable long after the period of exposure.
Altered DNA Methylation and Gene Expression Correlate
Next, we took different approaches to define if the DNA methylation and transcriptome changes were correlated. First, we noticed that pathways enriched using DMR-assigned genes overlapped with many identified when using the DEG data (compare Tables S1 and S2). Second, we reasoned that if a DMR regulated expression of a DEG by occurring at its promoter, then there should be overlap between those coordinates. Interestingly, we found that ~30% of DEGs had a DMR over their TSS (Table S4; Figure 4A). Recent findings showed that in mice DMRs also overlap with enhancers (Grimm et al., 2019), which are regulatory genomic regions that can impact the expression of distant or proximal genes. As enhancers are enriched for H3K27ac and H3K4me1 and overlap with DNase-hypersensitive sites (Davie et al., 2015; Heintzman et al., 2009), we used these features to identified potential enhancers within our DMRs. Using publicly available ENCODE data from livers of C57BL6/J, we found significant overlap between DMRs and loci enriched for H3K27ac or H3K4me1 in both the control or rotenone-exposed offspring (Figures 4B and 4C); the overlap was higher when considering DMRs from specific clusters (Table S5). We also found ~50% overlap with DNase-hypersensitive sites (Figure 4D), which reached ~80% when analyzing DMRs from clusters 3 and 4 (Table S5). These values agree with or even exceed those recently identified using liver WGBS data from other animals (Grimm et al., 2019), and support the conclusion that there is an association between the identified DMRs and these regulatory genomic loci.
Figure 4. Differentially Methylated Regions Overlap with DEGs and Regulatory Genomic Regions.

(A) Venn diagram depicts the overlap between DMRs and the DEGs based on the closest TSS.
(B-D) Overlap of DMRs with regions enriched for H3K27ac- (B), H3K4me1- (C), or DNase-hypersensitive (D) sites using ENCODE data.
(E) IPA-predicted upstream regulators of common (left) or unique (right) DEGs to the control or rotenone-fed offspring. Red arrows depict TFs also identified using HACER.
(F) Heatmap of significance scores for enriched representation of DEGs with DMRs. Arrows indicate left-shift on timing of DNA methylation relative to transcriptional changes.
If DMRs that displayed enhancer features influenced gene expression under our experimental conditions, then TFs that recognize the DMRs should also carry out the transcriptional program. To test this, we started by predicting the TFs associated with the gene expression changes using IPA (Figure 4E) and used HACER, an atlas of human active and in vivo-transcribed enhancers (Wang et al., 2019), to establish DMR/enhancer overlap and identify TF-enhancer and TF-promoter relationships. Then, we compared the TFs identified with both datasets. HACER is a single data repository that integrates results from FATOM5 CAGE profiles, GRO/PRO-seq data, ENCODE chromatin immunoprecipitation sequencing (ChIP-seq), and chromosome conformation capture technologies with validated interaction from high-throughput experiments (Wang et al., 2019). By doing so, it provides high confidence in silico information on enhancer coordinates, TF-enhancer binding, and enhancer-promoter interactions. Given HACER was developed based on human data, we first obtained corresponding human coordinates to the identified mouse DMRs, which we then queried for enhancer overlap and TF-binding. We found that several DMRs in the control- or rotenone-fed cohorts overlapped with mapped enhancers (Table S6), consistent with our analysis using the ENCODE data. Most importantly, we found that seven out of the top 15 TFs predicted to regulate the gene expression program were found to bind enhancers, including MYC, SP1, KDM5B, HDAC1, FOXM1, E2F1, and E2F6 (Figure 4E). Some of the TFs were also predicted to drive the unique rotenone gene expression program, including CEBPB, STAT3, STAT5A, RELA, SMARCA4, and POU2F2 (Table S6). Thus, we conclude that DMRs that displayed enhancer features are likely to influence the transcriptional changes identified herein.
Finally, we evaluated the relationship between DNA methylation and gene expression at the genome (rather than gene) level. We hypothesized that if differential DNA methylation and transcription globally correlate, then DEGs are more likely than non-DEGs to be differentially methylated at any given time point. We statistically tested whether DMRs were significantly represented in the list of DEGs versus the rest of the transcriptome. We also tested whether such statistical significance could discriminate the relationship between differential methylation and aging- or rotenone-exposure-responsive DEGs. We found not only that DMRs and DEGs significantly enriched at each time point relative to the rest of the genome, but notably, that the significance seemed to shift to an earlier time point in the rotenone-exposed offspring (Figure 4F, upper panel). We then segregated the analysis based on “aging” (Figure 4F, middle panels) versus rotenone-unique DEGs (Figure 4F, bottom panels) and found that the correlation was stronger at an earlier time point. For example, the global methylome at six months in the rotenone-treated group resembled that of the 12-month-old in the control group (Figure 4F, see red arrows on right lower panel). These results suggest that the DNA methylation landscape was “precociously” changed by rotenone, priming loci months in advance of the changes in transcriptional output. Similar findings were previously reported for diet-induced obesity in the mouse (Li et al., 2018).
Collectively, these analyses show remarkable correlations between alterations in the methylation status of the liver genome and the changes in gene expression, leading to the conclusion that a large fraction of DEGs were directly or indirectly influenced by DMRs as a result of developmental rotenone exposure.
DISCUSSION
Our findings present strong evidence that rotenone altered mitochondrial function in the mothers and resulted in pervasive and lasting changes in DNA methylation and transcription in the offspring. As modulation of DNA methylation was observed in the skin and liver, these results uniquely demonstrate that perinatal rotenone altered the organismal epigenetic landscape. Given that the DNA methylation status of the Avy locus is set prior to the three-germ-layer separation (Dolinoy et al., 2006, 2007; Michaud et al., 1994), these data also suggest that the earliest effects of rotenone were imparted pre-implantation. This is consistent with the developmental timing when mitochondria undergo functional and structural changes with robust activation of OXPHOS capacity in the embryo (Harvey, 2019). It is also during this stage of development that the first wave of genome demethylation and re-methylation occurs, programming the epigenome of the organism (Fleming et al., 2018; Harvey, 2019). Thus, the pre-implantation stage provides a unique window in which rotenone could significantly affect mitochondrial function in a way to impact the organismal epigenetic landscape.
We did consider that rotenone could affect the embryo and the epigenome through mitochondrial-unrelated means, including interfering with placentation, with tubulin polymerization (Heinz et al., 2017) or by generating toxic metabolites in the liver. Both placentation and tubulin defects would alter litter size and pup weights, which were indistinguishable between the control and the 10-ppm-exposed cohorts (Table 1). Further, placentation is outside the developmental window when the effects in the Avy locus are typically first observed (Bernal et al., 2013). Metabolites generated by rotenone liver detoxification have been characterized and shown to inhibit the site of NADH oxidation on mitochondrial complex I as well, although with less potency than the parent compound (Caboni et al., 2004; Fukami et al., 1967; Unai et al., 1973). Thus, our data are in line with rotenone affecting mitochondrial function and, in turn, the epigenome. Nevertheless, the mechanisms by which mitochondrial inhibition by rotenone influences DNA methylation requires further investigation. Our findings are seemingly inconsistent with a role for mitochondrial-derived ROS (Figure 1), but specific experiments to address this are needed, given that DMPO is not sensitive, as employed, to detect base oxidation at the nucleotide level. For example, estimates of abundance of 5-hydroxy-methyl-cytosine, the byproduct of methyl-cytosine oxidation, and data on changes in activity of the redox-sensitive Ten eleven translocation enzymes (TETs) can provide better evidence for the involvement (or not) of ROS. Alternatively, rotenone-driven complex I dysfunction could inhibit the TETs by increasing succinate (Tretter et al., 2016) or affect methionine salvage, SAM (S-adenosyl-methionine) levels, and/or DNA methyltransferase activity as shown in vitro (Lozoya et al., 2018a). Also, O2·− has been proposed to facilitate DNA methylation by deprotonating cytosines and increasing SAM’s affinity to DNA (Afanas’ev, 2015), but this has yet to be shown in vivo. Clearly, additional experiments are needed to define what mediates the epigenetic effects of rotenone.
That maternal rotenone exposure affected DNA methylation in the offspring that persisted much later in life was clear from our analysis. However, we cannot unequivocally conclude that the DNA methylation changes drove gene expression outputs, although the data strongly support a correlation between the two. The outcomes of DNA methylation for transcription are complex and vary depending on location, i.e., CpG islands, shores, or gene body (Jones, 2012), making it difficult to establish cause-effect relationships. Likewise, assigning the “correct” gene to a DMR is still arbitrary, as the TSS of the most proximal gene may not be the one impacted in the 3D configuration of DNA. Also, epigenetic changes are combinatorial, and affect gene expression based on chromatin accessibility, histone modifications, and TF binding (Kilpinen et al., 2013). Thus, experiments including chromatin capture techniques such as Hi-C will be useful in establishing cause-effect relationships and the physiological significance of DMRs. It will also be interesting to include males in future analyses, given that our results relied mostly on females. Whether sex/hormones may differentially influence these phenotypes in the long term is unknown. Irrespective, these results raise the possibility that the mitochondrion could be a unifying molecular target of many environmental stressors that have been shown to affect the epigenome early in life, including endocrine disruptors, metals (cadmium, arsenic, nickel, chromium, methylmercury, and lead), peroxisome proliferators (trichloroethylene, dichloroacetic acid, and trichloroacetic acid), air pollutants (particulate matter, black carbon, and benzene), and cigarette smoke (Baccarelli and Bollati, 2009). Presently, it is unclear whether these different chemicals can interfere with the same cellular or molecular targets or engage different parts of the same pathway that ultimately lead to epigenetic remodeling and health outcomes (Escher et al., 2017; Grandjean et al., 2015).
In summary, we provide evidence that developmental exposure to rotenone, a well-known mitochondrial complex I inhibitor, has effects on the organismal epigenome that are relevant in vivo, building upon and significantly expanding previous data in cell culture and animal models. Given the key role for mitochondria in different physiological and pathological contexts, including development, stem cell differentiation, immune-cell activation and cancer, these data raise fundamental questions about the broad and long-term biological consequences to the organism of modulation of mitochondrial function. This seems important to better understand the heterogenous nature of mitochondrial disorders and the health outcomes of exposures to mitochondrial toxicants, estimated by the NTP to be pervasive in the environment (Attene-Ramos et al., 2015; Xia et al., 2018).
STAR★METHODS
RESOURCE AVAILABILITY
Lead Contact
Further information and requests for resources and reagents should be directed to and will be fulfilled by the Lead Contact, Janine H Santos (Janine.santos@nih.gov).
Materials Availability
This study did not generate unique reagents.
Data and Code Availability
The original WGBS and RNA-seq data described in this manuscript have been submitted to the NCBI Gene Expression Omnibus (GEO) under accession number GSE136417.
EXPERIMENTAL MODEL AND SUBJECT DETAILS
Female C57BL6/J mice, mCAT overexpressors (C57BL/6.mCAT) and B6.C3-Avy/J were purchased from the Jackson Laboratory (Bar Harbor, ME). Animals were housed under controlled and standard conditions of temperature and humidity with a 12 h light/dark cycle. After the first week on regular pelleted mouse chow, NIH-31, animals were switched to the customized AIN-93G diets containing 0, 10 or 150 ppm rotenone ad libitum. Females were about 8 weeks old at the start of the experiments. Customized diets were obtained irradiated from Envigo Inc. (Madison, WI). The B6.C3-Avy/J male breeders were sacrificed after pregnancy was confirmed while dams were euthanized after weaning. All pups were put on the control diet after post-natal day (PND) 21 until the end of the experiments (~18 months). Males and females were studied at specific time-points, including PND22, 6-, 12-and 18-months of age. Animals were treated in accordance with the NIH Guide for the Care and Use of Laboratory Animals; the study was revised and approved by the NIEHS Animal Study Proposal review board.
METHOD DETAILS
Coat color phenotyping
Coat color phenotyping occurred for all animals of both genders at PND21, and a fraction of the mice were re-phenotyped at 5 and 12 months of age. Frequency of animals in each category was calculated based on the number of animals in that category relative to the total number of alive mutant animals in the cohort in each experimental group (n = 212). For offspring resulting from the cross with the mCAT animals, coat color phenotype occurred at weaning, after which animals were euthanized and discarded. Statistical significance was calculated using Fisher’s, Somer’s and chi-square tests. A priori power analysis determined the number of animals required for statistical purposes. Mice were photographed at the time of initial phenotyping, and the images were independently evaluated and scored for coat color distribution by a total of 5 individuals; final data were reported as the average from the 5 phenotypes.
Analysis of rotenone in the feed
Rotenone was procured from Sigma (Lot No. SLBG7568V, St. Louis, MO). The identity was confirmed and the purity (~98%) was determined by mass spectrometry. Prior to final studies, the feasibility of preparing a homogeneous feed formulation and the stability of rotenone in the formulation during storage was established as follows. Rotenone was formulated in AIN-93G meal diet by Envigo (Madison, WI). Feed formulation was extracted with acetonitrile and analyzed using a qualified high-performance liquid chromatography (HPLC)-ultraviolet (UV) detection method (linearity > 0.999; relative standard deviation (RSD), ≤ 1.8%; relative error (RE), ± ≤ 2%; recovery, 103%). Formulation concentration was within 10% of target. In addition, the concentration measured in samples taken from the top, middle, and the bottom of the blender had RSD values of 2.8% demonstrating that the formulation was homogeneous. Aliquots of formulations stored at ambient and refrigerated conditions for up to day 42 were within 10% of day 0 concentration. Similar findings were obtained when simulating the animal room environment, overall demonstrating that the rotenone formulations were stable under the experimental conditions.
Tissue fractionation and processing
Livers were retrieved surgically from littermates at PND22, 6- 12- and 18-month old, frozen in dry ice, and stored at −80°C for later processing immediately after sacrifice. Following completion of time course experiment, all specimens were retrieved at once and thawed on ice. Liver tissue from each specimen (50-100 mg each, dry weight) was minced individually with a double-blade on sterile plastic 100-mm plastic dishes while submerged in 5 mL of washing buffer, consisting of chilled 1x PBS supplemented with 0.01% DEPC and 400U of NexGen RNase Inhibitor (Lucigen). Each minced specimen was collected into 15 mL conical polystyrene tubes, vortexed briefly, and spun for 10 min at 1,000 × g in a temperature-controlled centrifuge pre-cooled to 4°C. After discarding the supernatant, each sample was rinsed, spun, and cleared two additional times in 5 mL washing buffer, then resuspended in 1 mL of washing buffer, transferred to 1.5 mL tubes for fractionation, and pelleted to discard supernatant as described above. Pelleted minced tissue was homogenized further with sterile disposable pestles using a hand-held motor (Kimble) in the presence of 1 mL of Trizol reagent (Invitrogen) and fractionated according to the manufacturer’s instructions to obtain total RNA, genomic DNA, and protein fractions. Yield and purity of nucleic acid fractions were determined by absorbance measurements with a NanoDrop system (Thermo Scientific); protein contents were assessed with colorimetric assays using a commercial Bradford dye-binding method following the manufacturer’s guidelines (Bio-Rad Protein Assay).
Whole-genome bisulfite sequencing (WGBS) library preparation and sequencing
WGBS was performed in liver from animals (males and females) in the control or rotenone-exposed cohort starting with 1 μg genomic DNA spiked with 50 ng of phage λ, or λDNA (0.5% w/w, Promega), sheared to 300-800 bp size range with a BioRuptor device (Diagenode) for 12-15 cycles (low power setting, 30 s on − 90 s off) in a total volume of 100 μL inside 0.65- mL clear polystyrene tubes. After confirming shared DNA size range by gel electrophoresis, samples were subjected to bisulfite conversion (EZ DNA methylation kit; Zymo Research) following manufacturer’s instructions. Each sample was ligated and amplified into sequencing libraries with different single-indexed methylated adapters per sample (TruSeq RNA v2, Sets A and B; Illumina) combined with a low-input DNA ligation chemistry (HyperPrep kit, KAPA Biosystems) following the manufacturer’s guidelines. Each individual library was PCR-amplified in technical duplicates for no more than 12 cycles afterward, and duplicate PCR reaction volumes were collected for DNA purification with size selection by double-sided 0.6 × −0.8 × SPRI (expected fragment size: 250–450 bp inclusive of sequencing adapters) using AMPureXP magnetic beads (Beckman-Coulter). WGBS library preparation protocol was performed in duplicate, with re-assignment of samples across indices, to screen for batch effect bias and supplement low-quality mappings in bioinformatics post-processing as needed.
WGBS data processing
General quality control checks were performed with FastQC v0.11.5 (http://www.bioinformatics.babraham.ac.uk/projects/fastqc). Although some libraries were sequenced in paired-end format, only read 1 was used for consistency across datasets. Raw sequence reads were filtered to retain only those with average base quality score at least 20. Adaptor sequence was trimmed from the 3′ end of reads via Cutadapt v1.12 (parameters -a AGATCGGAAGAG -O 5 -q 0 -f fastq) (Martin, 2011). Reads less than 30nt after adaptortrimming were discarded. Filtered and trimmed datasets were aligned to a genome including of the mm10 reference assembly (GRCm38) with the genome sequence of λDNA (NC_001416.1) appended. Mapping was performed via Bismark v0.18.1 using default parameters (Krueger and Andrews, 2011) with Bowtie2 v2.3.0 as the underlying alignment tool (Langmead and Salzberg, 2012). Mapping was first attempted for full-length queries (76bp for library A preps, 151bp for library B preps, and 101bp for library C preps). To salvage failed hits due to significant quality concerns, an iterative alignment process was implemented for some datasets. For reads that were not successfully mapped at full length from the library B preps, attempted alignments were done after clipping to 100nt and again after clipping to 50nt. For reads that were not successfully mapped at full length from the library C preps, attempted alignments were done after clipping to 50nt. Mapped hits were deduplicated within libraries. Mapped hits with three or more methylated cytosines in non-CpG context were filtered out since we predicted that they represented incomplete bisulfite conversion. Additional post-alignment read clipping was performed to remove positional methylation bias as determined from QC plots generated with the ‘bismark_methylation_extractor’ tool (Bismark v0.18.1) (Krueger and Andrews, 2011). Specifically, cycle 1 (i.e., 1nt from 5′ end of read) was removed from all mapped hits from library A datasets, and cycles 146-151 (i.e., 6nt from 3′ end of read, unless already clipped prior to alignment) were removed from all mapped hits from library B datasets. Alignments for multiple libraries from the same animal were merged, then hits from mm10 and phage λ were separated. The observed bisulfite conversion rate, which was calculated based on either hits to phage λ or to mouse chrM, averaged ~99% across all animals in the study. Reads mapped to the mm10 reference genome were used for downstream analysis. All parameters of quality control can be found in Table S7.
Identification of differentially methylated regions
Differentially methylated regions (DMRs) were identified via MOABS v1.3.4 (Sun et al., 2014) using merged replicates per sample group. Input data were limited to females with at least two libraries per animal. Pairwise comparisons either between time points or between treatment conditions were performed with the ‘mcomp’ function at default parameters. DMRs identified by the M2 method were filtered to require (a) p < 0.001, (b)at least 3 CpG sites, and (c) a composite methylation difference of at least 10%, where composite methylation is defined as the total methylated base count at all CpG sites in the defined region divided by the total cytosine base count. A total of 27,562 DMRs in 32 sets were identified from 16 pairwise comparisons of sample groups, with hyper- and hypomethylated regions in each. For easier assessment of DMR trends, these individual DMR sets were collapsed into groups as follows: aging DMRs in untreated mice (i.e., regions identified as hyper- or hypo-methylated at different ages under 0-ppm treatment condition), aging DMRs in rotenone-treated mice (i.e., regions identified as hyper- or hypo-methylated at different ages under 10-ppm treatment condition), hypermethylated treatment DMRs (i.e., regions with 10ppm > 0ppm methylation level at a given time point), and hypomethylated treatment DMRs (i.e., regions with 0ppm < 10ppm methylation level at a given time point). For each DMR category, DMRs identified by the individual MOABS comparisons and filtered as described above were merged via BEDtools v2.24.0 mergeBed (Quinlan and Hall, 2010) with parameters “-d −2 -o collapse” to generate a set of non-overlapping regions. The two sets of aging DMRs were each further categorized by expression patterns over time. This was accomplished by calculating the composite methylation score for each sample group at each DMR then applying k-means clustering to the row- scaled methylation values. The optimal k for each dataset (k = 6 for untreated condition, k = 5 for rotenone-treated condition) was determined by the elbow method based on total within-cluster sum of squares tested over k = 1 through k = 25. One additional cluster was assigned for DMRs with incomplete data; specifically, DMRs with zero cytosine base counts in one or more sample groups. Gene assignments were based on Ensembl transcripts in mouse GENCODE VM18, as downloaded from the UCSC Table Browser (http://genome.ucsc.edu/cgi-bin/hgTables) for mm10 as of December 17, 2018. Each DMR was given a nearest-gene assignment based on distance to TSS, limiting to transcripts from genes with a corresponding Entrez identifier (referenced against ftp://ftp.ncbi.nlm.nih.gov/gene/DATA/GENE_INFO/Mammalia/Mus_musculus.gene_info.gz).
Motif enrichment analysis using DMRs
Enriched motif analysis was performed with HOMER v4.10.3 (Heinz et al., 2010) for query regions expanded to a minimum width of 200bp centered on the DMR midpoint; these analyses were run using the findMotifsGenome.pl tool with ‘-size given’ (all other parameters default).
Overlap of DMRs with regulatory DNA
ENCODE data from mouse liver samples was downloaded to evaluate overlap of DMRs with specific genomic marks of interest, including DNase I hypersensitive hotspots (PND0 accession ENCFF054QYT), H3K27ac peaks (PND0 accession ENCFF290MLR and adult accession ENCFF545NYE), H3K4me1 peaks (PND0 accession ENCFF165ZKL and adult accession ENCFF338OJA), H3K4me3 peaks (PND0 accession ENCFF258RQA and adult accession ENCFF420PUU), and H3K9ac peaks (PND0 accession ENCFF587BYL and adult accession ENCFF787EAZ). DNase I hypersensitive hotspots for adult 8-week male liver were downloaded from the UCSC Genome Browser (UCSC Accession wgEncodeEM001720), then converted from mm9 to mm10 coordinates with lift-Over from the UCSC utility tools at https://genome.ucsc.edu/util.html. Overlap between query DMRs and peak regions was determined via BEDtools v2.24.0 ‘intersect’. The statistical significance of each overlap was determined by Monte Carlo simulation, where BEDtools v2.24.0 ‘shuffle’ was used to select random regions size- matched to the query DMRs (defined by H3K27ac peaks) followed by overlap assessment via BEDtools v2.24.0 ‘intersect’ for 10,000 iterations. The random region selection excluded chrY, chrM, all non-canonical chromosomes, and any poly-N genomic region longer than 100nt.
HACER analysis
The list of DMR-derived intervals obtained in mm10 were converted to hg19 using web tool LiftOver at UCSC Genome browser (https://genome.ucsc.edu/). These converted intervals were then used as input for web tool HACER to obtain enhancer annotation (Wang et al., 2019). The output of HACER, was further processed to generate a summary of TFs and frequency of each TF among these intervals.
RNA-seq library preparation, sequencing, and data analysis
RNA-seq was performed in the livers of females (N = 3/group) at PND22, 6-, 12- and 18-month-old animals, starting with poly-A-selected RNA from 1 μg of DNasel-treated total RNA using a magnetic poly-dT bead hybridization capture (Illumina). This was eluted in 10μL of nuclease-free H2O by heating briefly at 80°C for 2 min, transferred as magnetically isolated supernatant to RNase-free wells of a 96-well reaction plate and used for rRNA-free library assembly using a KAPA Stranded RNA-Seq with RiboErase commercial kit (KAPA Biosystems) following the manufacturer’s guidelines. Each individual library was PCR-amplified in two technical replicates for no more than 12 cycles afterward, and duplicate PCR reaction volumes per sample were collected for DNA purification with size selection by double-sided 0.6 × −0.8 × SPRI (expected fragment size: 250–450 bp inclusive of sequencing adapters) using AMPureXP magnetic beads (Beckman-Coulter). Libraries were combined in equimolar proportions and sequenced as a single multiplexed library with a NovaSeq 6000 system using an S4 flow cell [Illumina]. Raw sequences were filtered to retain only those with average base quality score at least 20 in both reads of a given read pair. Filtered reads were mapped to the mm10 reference assembly (GRCm38) via TopHat v2.0.4 with parameters ‘–b2-sensitive–library-type fr- stranded -g 1–mate-inner-dist −40-mate-std-dev 50 (Kim and Salzberg, 2011). Resulting hits were coordinate-sorted and deduplicated with Picard tool suite v1.96, then tallied for further data analysis with SeqMonk, version 37.1 (http://www.bioinformatics.babraham.ac.uk). Composite per kilobase per million reads (RPKM) counts within genomic coordinates of genes were used to calculate gene expression differences using only sense-strand transcripts. Detection of differentially expressed genes (DEG) across time × treatment groupings was performed using weighed two-way ANOVA (gene × grouping) based on log2-transformed fold-change (log2FC) measurements relative to gene RPKM grand-means over all specimens; N = 24 (3 biological replicates per time × treatment grouping). Gene-wise log2FC values were weighed by a relative metric of sequencing representation (cumulative hazard of significance scores from gene-wise RPKM rate modeling with an exponential distribution and inverse link function) (Lozoya et al., 2018b). Genes were retained for post hoc pairwise analysis when significance level p < 0.05 after multiple comparison adjustment (Benjamini and Hochberg, 1995), then filtered against a minimum gene-wise effect size δ log2FC > 0.3 × σ log2FC and post hoc pairwise significance (Student’s t test p < 0.05) for log2FC differences at each time point against PND22 among specimens in the same treatment group, as well as log2FC differences at PND22 between treatment groups. For gene- level effect size filtering, δ log2FC = 0.3 × σ SSR is 5% of the 6σ-spread log2FC regression error with respect to a gene’s grand mean [where (σSRR)2 = (SSRlog2FC)/(N-1)] compared to 5% of the 6σ-spread in measurement error about the mean log2FC of time × treatment groupings in the gene [where (σlog2Fc) 2 = (SSElog2FC)/(N-1)].
Mitochondrial oxygen consumption measurements
Mitochondria were isolated by differential centrifugation (Darley-Usmar et al., 1987) from freshly harvested livers finely chopped into ice-cold mitochondria isolation buffer (10 mM HEPES, pH 7.4, 0.25 M sucrose, 1 mM EGTA, 0.5% BSA) using a Dounce homogenizer. Oxygen consumption was monitored using a Clark electrode and substrates for complex I (5 mM malate + 5 mM glutamate) or II (5 mM succinate + 20 μM rotenone)-driven respiration; basal mitochondrial respiration was recorded (0.5 mg/mL mitochondria) for 1-2 min before adding substrates; ADP (200 μM) and CCCP (20 μM) were also added to determine state 4/3 and maximal respiration, respectively.
Analyses of free radical intermediates using anti-DMPO
Animals were injected with the spin trapper DMPO (5,5-Dimethyl-1-pyrroline N-oxide) 2h prior to sacrifice; livers were collected and an antibody against DMPO was used to detect free-radical intermediates in situ using microscopy of different areas of the liver or an ELISA-based assay in isolated liver mitochondria or whole tissue homogenates.
Superoxide dismutase activity
Superoxide dismutase activity was measured in isolated mitochondria through inhibition of cytochrome c reduction with constant flux of superoxide radicals generated by xanthine oxidase in the presence of xanthine (McCord and Fridovich, 1969). To estimate Cu,Zn-SOD contribution in tissue homogenates, SOD activity was measured, then adjusted relative to SOD activity after specific inhibition of Cu,Zn-SOD with cyanide.
Sample size
Power analysis was performed a priori to define the number of animals required to establish the effects of rotenone on coat color distribution. Biochemical analysis of oxygen consumption, SOD activity and ROS were deemed adequate with an n = 4 to 5/sex/group based on effect size of expected data via published literature. For parsimony, genomic assays (WGBS and RNA-seq) were performed using sample sizes (n = 3), which follows ENCODE guidelines in the context of animal studies (minimum n = 2 biological replicates per experimental group; https://www.encodeproject.org/about/experiment-guidelines/). To avoid bias associated with the large number of data points inherent to each individual biological replicate, quality assessment of genomics data was carried out accounting for depth of genomic coverage, dynamic range of relative quantification (e.g., RPKM), large-scale effects, batch-dependent data dispersion and within-group variation prior to inferential statistical testing with false-discovery rate correction.
QUANTIFICATION AND STATISTICAL ANALYSIS
Data presented in graphs are means ± standard deviation unless otherwise stated in the figure legends. For all biochemical assays, each individual sample was run in technical replicates. Assessment of differences between more than two parameters was calculated using ANOVA statistics with post hoc tests based on Student’s t test. P values lower than 0.05 were considered significant.
Supplementary Material
KEY RESOURCES TABLE
| REAGENT or RESOURCE | SOURCE | IDENTIFIER |
|---|---|---|
| Antibodies | ||
| Total OXPHOS Rodent WB Antibody Cocktail | Abcam | Cat#ab110413;RRID:AB_2629281 |
| Anti-DMPO | Abcam | Cat#ab104902; RID:AB_10710413 |
| IRDye® 800 CW-conjugated anti-mouse | LI-COR Biosciences | Cat#926-32212;RRID:AB_621847 |
| Anti-SOD2 | Abcam | Cat#ab13533;RRID:AB_300434 |
| Anti-SOD1 | Abcam | Cat#ab13498;RRID:AB_300402 |
| IRDye® 680 LT-conjugated anti-mouse | LI-COR Biosciences | Cat#926-68022;RRID:AB_10715072 |
| Alexa 488-conjugated anti-mouse | Invitrogen | Cat#A11001;RRID:AB_2534069 |
| IRDye® 800 CW-conjugated anti-rabbit | LI-COR Biosciences | Cat#926-32213;RRID:AB_621848 |
| Anti-VDAC1 | Abcam | Cat#ab15895;RRID:AB_2214787 |
| Anti-4HNE | Abcam | Cat#ab46545;RRID:AB_722490 |
| Chemicals, Peptides, and Recombinant Proteins | ||
| 5,5-Dimethyl-1-pyrroline N-oxide (DMPO) | Dojindo (Japan) | Cat#D048-10 |
| rotenone | Sigma | Cat#R8875 |
| CCCP | Sigma | Cat#C2759 |
| glutamate | Sigma | Cat#S8636 |
| Xanthine oxidase | Sigma | Cat#X4376 |
| xanthine | Sigma | Cat#X4002 |
| succinate | Sigma | Cat#S2378 |
| Trizol | Sigma | Cat#T9424 |
| Critical Commercial Assays | ||
| KAPA Stranded RNA-Seq Kit with RiboErase | KAPA | Cat#KK8484 |
| KAPA Unique Dual-Indexed Adaptor Kit, (15 μM) | KAPA | Cat#KK8727 |
| Genomic DNA Buffer Set Kit | QIAGEN | Cat#19060 |
| Genomic tip 20/G | QIAGEN | Cat#10223 |
| TruSeq RNA Library Preparation Kit v2, Set A | Illumina | Cat# S-122-2001 |
| TruSeq RNA Library Preparation Kit v2, Set B | Illumina | Cat#RS-122-2002 |
| AmPureXP Beads | Beckman-Coulter | Cat#A63881 |
| EZ DNA methylation kit | Zymo Research | Cat#D5001 |
| NxGen® RNase Inhibitor | Lucigen | Cat#30281-2 |
| Hyper Prep Kit | KAPA | Cat#KK8505 |
| Deposited Data | ||
| Methylation profiling by high throughput sequencing | This paper | GSE136417 |
| Expression profiling by high throughput sequencing | This paper | GSE136417 |
| Experimental Models: Organisms/Strains | ||
| C57BL/6J | JaX Laboratories | Cat#000664 |
| B6.C3-Avy/J | JaX Laboratories | Cat#000017 |
| C57BL/6.mCAT | JaX Laboratories | Cat#016697 |
| Software and Algorithms | ||
| Ingenuity Pathway Analysis | QIAGEN | N/A |
| Bismark v0.18.1 | Krueger and Andrews, 2011 | N/A |
| Bowtie2 v2.3.0 | Langmead and Salzberg, 2012 | N/A |
| MOABS v1.3.4 | Sun et al., 2014 | N/A |
| HOMER v4.10.3 | Heinz et al., 2010 | N/A |
| HACER | Wang et al., 2019 | N/A |
| Odyssey imaging system | LiCoR | N/A |
| Other | ||
| AIN-93G diet | ENVIGO | N/A |
Highlights.
Rotenone exposure during pregnancy causes mitochondrial dysfunction in dams
Offspring show altered DNA methylation in skin and liver throughout their lifespan
Persistent transcriptome remodeling correlates with the genome methylation changes
Late-life functional outcomes result from the developmental rotenone exposure
ACKNOWLEDGMENTS
We thank members of the Animal Care Group and staff from the Genomics Cores (NIH). We thank Lorenzo and Valentina Trovero, as well as Ashlyn Jacobson for help in coat-color distribution scoring using photographs. We acknowledge Dr. Douglas Ganini da Silva’s technical help and Dr. Grace Kissling for statistical analyses, and we thank Drs. Paul Wade and Carmen Williams for critical comments. This research was supported by the NIH, NIEHS, Division of Intramural Research.
Footnotes
SUPPLEMENTAL INFORMATION
Supplemental Information can be found online at https://doi.org/10.1016/j.celrep.2020.108131.
DECLARATION OF INTERESTS
The authors declare no competing interests.
REFERENCES
- Abdo KM, Eustis SL, Haseman J, Huff JE, Peters A, and Persing R (1988). Toxicity and carcinogenicity of rotenone given in the feed to F344/N rats and B6C3F1 mice for up to two years. Drug Chem. Toxicol 11, 225–235. [DOI] [PubMed] [Google Scholar]
- Afanas’ev I (2015). Mechanisms of superoxide signaling in epigenetic processes: relation to aging and cancer. Aging Dis. 6, 216–227. [DOI] [PMC free article] [PubMed] [Google Scholar]
- Anagianni S, and Tuschl K (2019). Genetic disorders of manganese metabolism. Curr. Neurol. Neurosci. Rep 19, 33. [DOI] [PMC free article] [PubMed] [Google Scholar]
- Ansó E, Weinberg SE, Diebold LP, Thompson BJ, Malinge S, Schumacker PT, Liu X, Zhang Y, Shao Z, Steadman M, et al. (2017). The mitochondrial respiratory chain is essential for haematopoietic stem cell function. Nat. Cell Biol 19, 614–625. [DOI] [PMC free article] [PubMed] [Google Scholar]
- Attene-Ramos MS, Huang R, Michael S, Witt KL, Richard A, Tice RR, Simeonov A, Austin CP, and Xia M (2015). Profiling of the Tox21 chemical collection for mitochondrial function to identify compounds that acutely decrease mitochondrial membrane potential. Environ. Health Perspect 123, 49–56. [DOI] [PMC free article] [PubMed] [Google Scholar]
- Baccarelli A, and Bollati V (2009). Epigenetics and environmental chemicals. Curr. Opin. Pediatr 21, 243–251. [DOI] [PMC free article] [PubMed] [Google Scholar]
- Benjamini Y, and Hochberg Y (1995). Controlling the False discovery rate: a practical and powerful approach to multiple testing. J. R. Stat. Soc. B 57, 289–300. [Google Scholar]
- Bernal AJ, Dolinoy DC, Huang D, Skaar DA, Weinhouse C, and Jirtle RL (2013). Adaptive radiation-induced epigenetic alterations mitigated by antioxidants. FASEB J. 27, 665–671. [DOI] [PMC free article] [PubMed] [Google Scholar]
- Caboni P, Sherer TB, Zhang N, Taylor G, Na HM, Greenamyre JT, and Casida JE (2004). Rotenone, deguelin, their metabolites, and the rat model of Parkinson’s disease. Chem. Res. Toxicol 17, 1540–1548. [DOI] [PubMed] [Google Scholar]
- Darley-Usmar VM, Rickwood D, and Wilson MT (1987). Mitochondria, A Practical Approach (IRL Press; ). [Google Scholar]
- Davie K, Jacobs J, Atkins M, Potier D, Christiaens V, Halder G, and Aerts S (2015). Discovery of transcription factors and regulatory regions driving in vivo tumor development by ATAC-seq and FAIRE-seq open chromatin profiling. PLoS Genet. 11, e1004994. [DOI] [PMC free article] [PubMed] [Google Scholar]
- Dolinoy DC (2008). The agouti mouse model: an epigenetic biosensor for nutritional and environmental alterations on the fetal epigenome. Nutr. Rev 66 (Suppl 1), S7–S11. [DOI] [PMC free article] [PubMed] [Google Scholar]
- Dolinoy DC, Weidman JR, Waterland RA, and Jirtle RL (2006). Maternal genistein alters coat color and protects Avy mouse offspring from obesity by modifying the fetal epigenome. Environ. Health Perspect 114, 567–572. [DOI] [PMC free article] [PubMed] [Google Scholar]
- Dolinoy DC, Huang D, and Jirtle RL (2007). Maternal nutrient supplementation counteracts bisphenol A-induced DNA hypomethylation in early development. Proc. Natl. Acad. Sci. USA 104, 13056–13061. [DOI] [PMC free article] [PubMed] [Google Scholar]
- Duhl DM, Vrieling H, Miller KA, Wolff GL, and Barsh GS (1994). Neomorphic agouti mutations in obese yellow mice. Nat. Genet. 8, 59–65. [DOI] [PubMed] [Google Scholar]
- Durkin PR (2008). Rotenone Human Health and Ecological Risk Assessment Report, Syracuse Environmental Research Associates. (USDA Forest Service; ). [Google Scholar]
- Escher BI, Hackermüller J, Polte T, Scholz S, Aigner A, Altenburger R, Böhme A, Bopp SK, Brack W, Busch W, et al. (2017). From the exposome to mechanistic understanding of chemical-induced adverse effects. Environ. Int 99, 97–106. [DOI] [PMC free article] [PubMed] [Google Scholar]
- Fleming TP, Watkins AJ, Velazquez MA, Mathers JC, Prentice AM, Stephenson J, Barker M, Saffery R, Yajnik CS, Eckert JJ, et al. (2018). Origins of lifetime health around the time of conception: causes and consequences. Lancet 391, 1842–1852. [DOI] [PMC free article] [PubMed] [Google Scholar]
- Fukami JI, Yamamoto I, and Casida JE (1967). Metabolism of rotenone in vitro by tissue homogenates from mammals and insects. Science 155, 713–716. [DOI] [PubMed] [Google Scholar]
- Grandjean V, Fourré S, De Abreu DA, Derieppe MA, Remy JJ, and Rassoulzadegan M (2015). RNA-mediated paternal heredity of diet-induced obesity and metabolic disorders. Sci. Rep 5, 18193. [DOI] [PMC free article] [PubMed] [Google Scholar]
- Grimm SA, Shimbo T, Takaku M, Thomas JW, Auerbach S, Bennett BD, Bucher JR, Burkholder AB, Day F, Du Y, et al. ; NISC Comparative Sequencing Program (2019). DNA methylation in mice is influenced by genetics as well as sex and life experience. Nat. Commun 10, 305. [DOI] [PMC free article] [PubMed] [Google Scholar]
- Harvey AJ (2019). Mitochondria in early development: linking the microenvironment, metabolism and the epigenome. Reproduction 157, R159–R179. [DOI] [PubMed] [Google Scholar]
- Heintzman ND, Hon GC, Hawkins RD, Kheradpour P, Stark A, Harp LF, Ye Z, Lee LK, Stuart RK, Ching CW, et al. (2009). Histone modifications at human enhancers reflect global cell-type-specific gene expression. Nature 459, 108–112. [DOI] [PMC free article] [PubMed] [Google Scholar]
- Heinz S, Benner C, Spann N, Bertolino E, Lin YC, Laslo P, Cheng JX, Murre C, Singh H, and Glass CK (2010). Simple combinations of lineage-determining transcription factors prime cis-regulatory elements required for macrophage and B cell identities. Mol. Cell 38, 576–589. [DOI] [PMC free article] [PubMed] [Google Scholar]
- Heinz S, Freyberger A, Lawrenz B, Schladt L, Schmuck G, and Ellinger-Ziegelbauer H (2017). Mechanistic investigations of the mitochondrial complex I inhibitor rotenone in the context of pharmacological and safety evaluation. Sci. Rep 7, 45465. [DOI] [PMC free article] [PubMed] [Google Scholar]
- Hitchler MJ, and Domann FE (2012). Redox regulation of the epigenetic landscape in cancer: a role for metabolic reprogramming in remodeling the epigenome. Free Radic. Biol. Med 53, 2178–2187. [DOI] [PMC free article] [PubMed] [Google Scholar]
- Jirtle RL (2014). The Agouti mouse: a biosensor for environmental epigenomics studies investigating the developmental origins of health and disease. Epigenomics 6, 447–450. [DOI] [PubMed] [Google Scholar]
- Jones PA (2012). Functions of DNA methylation: islands, start sites, gene bodies and beyond. Nat. Rev. Genet 13, 484–492. [DOI] [PubMed] [Google Scholar]
- Kaneko M, Noguchi T, Ikegami S, Sakurai T, Kakita A, Toyoshima Y, Kambe T, Yamada M, Inden M, Hara H, et al. (2015). Zinc transporters ZnT3 and ZnT6 are downregulated in the spinal cords of patients with sporadic amyotrophic lateral sclerosis. J. Neurosci. Res 93, 370–379. [DOI] [PubMed] [Google Scholar]
- Kilpinen H, Waszak SM, Gschwind AR, Raghav SK, Witwicki RM, Orioli A, Migliavacca E, Wiederkehr M, Gutierrez-Arcelus M, Panousis NI, et al. (2013). Coordinated effects of sequence variation on DNA binding, chromatin structure, and transcription. Science 342, 744–747. [DOI] [PMC free article] [PubMed] [Google Scholar]
- Kim D, and Salzberg SL (2011). TopHat-Fusion: an algorithm for discovery of novel fusion transcripts. Genome Biol. 12, R72. [DOI] [PMC free article] [PubMed] [Google Scholar]
- Krishna G, and Muralidhara. (2018). Oral supplements of inulin during gestation offsets rotenone-induced oxidative impairments and neurotoxicity in maternal and prenatal rat brain. Biomed. Pharmacother 104, 751–762. [DOI] [PubMed] [Google Scholar]
- Krueger F, and Andrews SR (2011). Bismark: a flexible aligner and methylation caller for Bisulfite-Seq applications. Bioinformatics 27, 1571–1572. [DOI] [PMC free article] [PubMed] [Google Scholar]
- Langmead B, and Salzberg SL (2012). Fast gapped-read alignment with Bowtie 2. Nat. Methods 9, 357–359. [DOI] [PMC free article] [PubMed] [Google Scholar]
- Li R, Grimm SA, Mav D, Gu H, Djukovic D, Shah R, Merrick BA, Raftery D, and Wade PA (2018). Transcriptome and DNA methylome analysis in a mouse model of diet-induced obesity predicts increased risk of colorectal cancer. Cell Rep. 22, 624–637. [DOI] [PMC free article] [PubMed] [Google Scholar]
- Lozoya OA, Martinez-Reyes I, Wang T, Grenet D, Bushel P, Li J, Chandel N, Woychik RP, and Santos JH (2018a). Mitochondrial nicotinamide adenine dinucleotide reduced (NADH) oxidation links the tricarboxylic acid (TCA) cycle with methionine metabolism and nuclear DNA methylation. PLoS Biol. 16, e2005707. [DOI] [PMC free article] [PubMed] [Google Scholar]
- Lozoya OA, Santos JH, and Woychik RP (2018b). A leveraged signal-to-noise ratio (LSTNR) method to extract differentially expressed genes and multivariate patterns of expression from noisy and low-replication RNAseq data. Front. Genet 9, 176. [DOI] [PMC free article] [PubMed] [Google Scholar]
- Lozoya OA, Wang T, Grenet D, Wolfgang TC, Sobhany M, Ganini da Silva D, Riadi G, Chandel N, Woychik RP, and Santos JH (2019). Mitochondrial acetyl-CoA reversibly regulates locus-specific histone acetylation and gene expression. Life Sci. Alliance 2, e201800228. [DOI] [PMC free article] [PubMed] [Google Scholar]
- Lustgarten MS, Jang YC, Liu Y, Qi W, Qin Y, Dahia PL, et al. (2011). MnSOD deficiency results in elevated oxidative stress and decreased mitochondrial function but does not lead to muscle atrophy during aging. Aging Cell 10, 493–505. [DOI] [PMC free article] [PubMed] [Google Scholar]
- Martin M (2011). Cutadapt removes adapter sequences from high-throughput sequencing reads. EMBnet J. 17, 3. [Google Scholar]
- Mason RP (2016). Imaging free radicals in organelles, cells, tissue, and in vivo with immuno-spin trapping. Redox Biol. 8, 422–429. [DOI] [PMC free article] [PubMed] [Google Scholar]
- McCord JM, and Fridovich I (1969). The utility of superoxide dismutase in studying free radical reactions. I. Radicals generated by the interaction of sulfite, dimethyl sulfoxide, and oxygen. J. Biol. Chem 244, 6056–6063. [PubMed] [Google Scholar]
- Michaud EJ, van Vugt MJ, Bultman SJ, Sweet HO, Davisson MT, and Woychik RP (1994). Differential expression of a new dominant agouti allele (Aiapy) is correlated with methylation state and is influenced by parental lineage. Genes Dev. 8, 1463–1472. [DOI] [PubMed] [Google Scholar]
- Michaud EJ, Mynatt RL, Miltenberger RJ, Klebig ML, Wilkinson JE, Zemel MB, Wilkison WO, and Woychik RP (1997). Role of the agouti gene in obesity. J. Endocrinol 155, 207–209. [DOI] [PubMed] [Google Scholar]
- Quinlan AR, and Hall IM (2010). BEDTools: a flexible suite of utilities for comparing genomic features. Bioinformatics 26, 841–842. [DOI] [PMC free article] [PubMed] [Google Scholar]
- Safi-Stibler S, and Gabory A (2020). Epigenetics and the developmental origins of health and disease: parental environment signalling to the epigenome, critical time windows and sculpting the adult phenotype. Semin. Cell Dev. Biol 97, 172–180. [DOI] [PubMed] [Google Scholar]
- Schriner SE, Linford NJ, Martin GM, Treuting P, Ogburn CE, Emond M, Coskun PE, Ladiges W, Wolf N, Van Remmen H, et al. (2005). Extension of murine life span by overexpression of catalase targeted to mitochondria. Science 308, 1909–1911. [DOI] [PubMed] [Google Scholar]
- Shrishrimal S, Kosmacek EA, and Oberley-Deegan RE (2019). Reactive oxygen species drive epigenetic changes in radiation-induced fibrosis. Oxid. Med. Cell. Longev 2019, 4278658. [DOI] [PMC free article] [PubMed] [Google Scholar]
- Smiraglia DJ, Kulawiec M, Bistulfi GL, Gupta SG, and Singh KK (2008). A novel role for mitochondria in regulating epigenetic modification in the nucleus. Cancer Biol. Ther 7, 1182–1190. [DOI] [PMC free article] [PubMed] [Google Scholar]
- Spencer F (1981). Effects of post-implantation exposure to selected pesticides on reproductivity In Rats HER Laboratory, ed. (U.S. Environmental Protection Agency; ). [Google Scholar]
- Spencer F, and Sing LT (1982). Reproductive responses to rotenone during decidualized pseudogestation and gestation in rats. Bull. Environ. Contam. Toxicol 28, 360–368. [DOI] [PubMed] [Google Scholar]
- Sun D, Xi Y, Rodriguez B, Park HJ, Tong P, Meong M, Goodell MA, and Li W (2014). MOABS: model based analysis of bisulfite sequencing data. Genome Biol. 15, R38. [DOI] [PMC free article] [PubMed] [Google Scholar]
- Tretter L, Patocs A, and Chinopoulos C (2016). Succinate, an intermediate in metabolism, signal transduction, ROS, hypoxia, and tumorigenesis. Biochim. Biophys. Acta 1857, 1086–1101. [DOI] [PubMed] [Google Scholar]
- Unai T, Cheng HM, Yamamoto I, and Casida JE (1973). Chemical and biological o-demethylation of rotenone derivatives. Agric. Biol. Chem. Tokyo 37, 1937–1944. [Google Scholar]
- Wang J, Dai X, Berry LD, Cogan JD, Liu Q, and Shyr Y (2019). HACER: an atlas of human active enhancers to interpret regulatory variants. Nucleic Acids Res. 47 (D1), D106–D112. [DOI] [PMC free article] [PubMed] [Google Scholar]
- Waterland RA, and Jirtle RL (2003). Transposable elements: targets for early nutritional effects on epigenetic gene regulation. Mol. Cell. Biol 23, 5293–5300. [DOI] [PMC free article] [PubMed] [Google Scholar]
- Xia M, Huang R, Shi Q, Boyd WA, Zhao J, Sun N, Rice JR, Dunlap PE, Hackstadt AJ, Bridge MF, et al. (2018). Comprehensive analyses and prioritization of Tox21 10K chemicals affecting mitochondrial function by in-depth mechanistic studies. Environ. Health Perspect. 126, 077010. [DOI] [PMC free article] [PubMed] [Google Scholar]
Associated Data
This section collects any data citations, data availability statements, or supplementary materials included in this article.
Supplementary Materials
Data Availability Statement
The original WGBS and RNA-seq data described in this manuscript have been submitted to the NCBI Gene Expression Omnibus (GEO) under accession number GSE136417.