ABSTRACT
Cerebellar neurons are generated from the rhombic lip and the neuroepithelium. In this study, we analyze the histogenesis of the cerebellar neuroepithelium in terms of cellular kinetics. The experimental animals are the offspring of pregnant dams injected with 5-bromo-2ʹ-deoxyuridine (BrdU) on embryonic day 13. We infer the fraction of S-phase cells by examining a range of survival times after a single BrdU-exposure and a cumulative BrdU-labeling sequence, which allow for the derivation of cell-cycle parameters and phase durations. The current results indicate that the dose of BrdU employed (35 mg/kg) provides saturation S-phase labeling from at least 1 h after marker delivery. The duration of G2, mitotic phase, and G1 are 1.2, 0.5, and 6.9 h, respectively. The duration for the S-phase, growth fraction, and the whole cycle are obtained on the basis of two proliferative models, steady-state and exponential growth. Both models provided similar results. In conclusion, our results indicate that the steady-state and the cumulative S-phase labeling paradigms can be adopted to analyze cell cycle parameters in the cerebellar neuroepithelium. Current results can help in understanding the regulatory mechanisms of cerebellar histogenesis and the cell biological mechanisms of the proliferative cycle of the neuroepithelium.
KEYWORDS: Prenatal, cerebellum, bromodeoxyuridine, S-phase, cell kinetics
1. Introduction
The cerebellum is involved not only in motor coordination but also plays an important role in the processing of signals for cognition, sensory discrimination, and affective functions [1–3]. This region presents an outer laminated area, the cerebellar cortex, and a set of cerebellar nuclei neurons buried within the white matter [4]. The cerebellar cortex has a regular cytoarchitecture composed of a limited number of cell types that are characterized by a distinctive morphology and molecular markers [5].
Several studies have indicated that the cerebellum derives from the most anterior segment of the hindbrain, the rhombomere 1. Neuroembryological research has shown that the isthmic organizer, located at the mesencephalon/rhombomere 1 boundary, directs the formation of the cerebellar territory [6]. The organizing activity of the isthmic tissue is mediated by the secreted fibroblast growth factor 8, whose expression is induced by a complex cross-regulatory mechanism that involves several transcription factors [5,7]. The establishment of the cerebellar territory is followed by the formation of two germinative compartments, the ventricular neuroepithelium and the rhombic lip. Many lines of evidence indicate that the generation of cerebellar neurons is compartmentalized, with ventricular zone progenitors giving rise to GABAergic neurons and the rhombic lip precursors generating glutamatergic cells [5]. Granule cell precursors also emerge from the rhombic lip, but they migrate tangentially over the piamater to form the external granular layer [8].
The duration of each phase of the cell cycle in rodents has been estimated using methods based upon autoradiography, which requires the labeling of proliferative cells with tritiated thymidine [9]. Multiple methods have been developed to estimate the duration of different cell-cycle phases. These methods include fluorescent activated cell sorting analysis of DNA content [10], transgenic approaches such as the FUCCI system [11], and the detection of 5-ethynyl-2ʹ-deoxyuridine [12,13]. However, the most commonly used method to analyze the duration of cell-cycle parameters in fixed tissue sections is the administration of 5-bromo-2´-deoxyuridine (BrdU) [14,15]. BrdU is incorporated during the S-phase of the cell cycle, when the DNA undergoes replication. The use of immunohistochemical methods to detect the incorporation of this exogenous nucleoside into the DNA allows to calculate several parameters of the cell cycle such as S-phase and total cell cycle duration [14–16].
In the light of the above, we began a set of experiments in our laboratory to study at embryonic day (E) 13, the histogenesis of the cerebellar neuroepithelium in terms of cellular kinetics. The reason to select this embryonic day is that it corresponds, in rats, to the onset of Purkinje cells and the deep cerebellar nuclei neurons neurogenesis [4,17,18]. In particular, the following aspects were addressed in this study: (I) we used a BrdU-immunoperoxidase method to reveal the fraction of S-phase cells and we estimated some critical parameters of cytogenesis for the cerebellar neuroepithelium such as the duration of the G2 (post-DNA synthetic phase), mitotic phase, and G1 (pre-DNA synthetic phase). (II) The duration of the S-phase, growth fraction, and the duration of the whole cycle were obtained on the basis of two theoretical models of generative behavior, steady-state, and exponential growth.
2. Material and method
2.1. Animals
All the experiments were approved by the Animal Research Committee of the Universitat Autònoma de Barcelona (UAB) and the Government of Catalonia, and conducted in accordance with the legislation for the protection of animals used for scientific purposes (directive 2010/63/EU, RD 53/2013). Adult female Sprague-Dawley OFA rats were put into the home cages of individual housed male rats at 5:00 pm and were removed at 8:00 am the next morning. At that time, vaginal smears were analyzed from each female and those that had sperm were placed into separate cages. This day was considered E1. During the experimental procedures, animals were maintained in a quiet room with controlled conditions (a 12-h light/dark cycle, 22 ± 2ºC, and food and water were provided ad libitum).
2.2. Experimental design
Pregnant dams were injected, at E13, with BrdU (Sigma, St. Louis, MO, USA) (35 mg/kg b.w, intraperitoneal) dissolved in sterile saline solution with 0.007 N sodium hydroxide at 10 mg/ml. This marker was administered according to three schedules. In an initial set of experiments, embryos were allowed to survive 0.5, 1, 1.5, and 2 h after injecting BrdU. A second group of rats also received a single injection of BrdU but were sacrificed at regular, 2 h intervals during a total period of 24 h. Finally, multiple injections were delivered at successive intervals up to 13 h following the first injection. The first interinjection interval was of 4 h. The subsequents were of 3 h. For each survival time, the last injection was given 1 h before sacrifice. Single injections or the initial injection of the cumulative labeling sequence were always given at 8:00 am. A total of 72 pregnant dams were used. To prevent all the pups from a dam accumulating in the same experimental group, from each dam, one embryo was analyzed. In each survival time, four pups were used. For example, in animals sacrificed 6 h after a single BrdU injection, four different pregnant dams were used and four embryos were studied. Schedules and the number of rats per experimental group are listed in Table 1.
Table 1.
BrdU injection schedules on embryonic day 13.
| |
Survival time after initial injection (hours) |
||||||||||||||||||
|---|---|---|---|---|---|---|---|---|---|---|---|---|---|---|---|---|---|---|---|
| BrdU administration | 0 | 0.5 | 1 | 2 | 4 | 5 | 6 | 7 | 8 | 10 | 11 | 12 | 13 | 14 | 16 | 18 | 20 | 22 | 24 |
| Single injection | I | S | |||||||||||||||||
| I | S | ||||||||||||||||||
| I | S | ||||||||||||||||||
| I | S | ||||||||||||||||||
| I | S | ||||||||||||||||||
| I | S | ||||||||||||||||||
| I | S | ||||||||||||||||||
| I | S | ||||||||||||||||||
| I | S | ||||||||||||||||||
| I | S | ||||||||||||||||||
| I | S | ||||||||||||||||||
| I | S | ||||||||||||||||||
| I | S | ||||||||||||||||||
| I | S | ||||||||||||||||||
| Repeated injection | I | I | S | ||||||||||||||||
| I | I | I | S | ||||||||||||||||
| I | I | I | I | S | |||||||||||||||
| I | I | I | I | I | S | ||||||||||||||
A total of 4 rats from different dams were analyzed for each of these schedules. I: Injection; S: sacrifice
2.3. Tissue processing
Dams were weighed and anesthetized with a ketamine-xylazine mixture (90:10 mg/ml; 1 ml/kg, intraperitoneal). Embryos were removed by cesarian. They were decapitated and their heads were immediately immersed in 4% paraformaldehyde phosphate buffer for 24 h at 4°C. These were paraffin-embedded and sectioned at 10 µm in the sagittal plane using a rotary microtome (Reichert-Jung 2030, Germany). Only one in every five sections was placed on poly-(L-lysine)-coated slides in order to avoid the overestimation of cell counts. Figure 1 shows the level chosen for analysis, which corresponds to the figure number 2 (page number 100) and plate 2 (page number 101) from the Altman and Bayer atlas [19].
Figure 1.
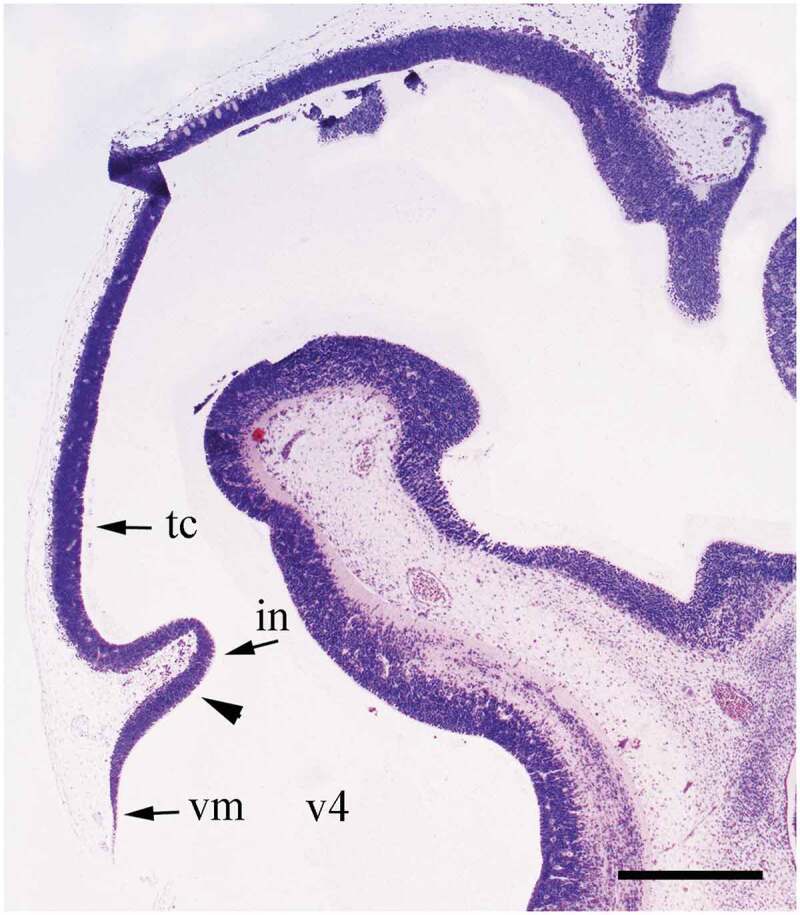
Sagittal low-power photomicrograph, at embryonic day 13, of the level used for quantitative evaluation in sagittal section. Arrowhead outlines the rostral boundary of the cerebellar neuroepithelium. The caudal one is traced by the vellum medullare. vm, vellum medullare; v4, fourth ventricle; in, isthmal neuroepithelium; tc, tectal neuroepithelium. Nissl stained. Scale bar = 500 µm.
2.4. BrdU immunohistochemistry
Immunoperoxidase staining for BrdU was performed according to previously published procedures [20,21]. Sections were deparaffinized in xylene and rehydrated through a series of graded ethanols. DNA was then partially denatured by immersing the slides in a 3 N HCl solution for 15 min at 40°C. This hydrolysis was halted with two washes in distilled water, the first one at 4°C and the second one at room temperature. Following this, the endogenous peroxidase activity was blocked with an immersion in 3% H2O2 for 10 min. The slides were then washed in 0.5% triton X-100 in PBS, and afterward, they were further rinsed with PBS and incubated with a monoclonal mouse anti-BrdU antibody (Dako, clone BU20a, Code No, M0744), which was diluted 1:150 in PBS supplemented with 1% bovine serum albumin (BSA, Boehringer Mannheim, Germany). Following incubation with the primary antibody, sections were incubated at room temperature for 1 h with a biotin conjugated goat anti-Mouse IgG antibody (Dako) 1:20 and then exposed to ExtrAvidin-peroxidase (Sigma) 1:20 for 30 min. Peroxidase activity was developed with 3,3ʹ-diaminobenzidine-H2O2 (DAB) (Sigma) for 5 min, and then the slides were finally rinsed in distilled water, dehydrated with ethanol and xylene, and coverslipped with Merckoglass. Control sections were prepared replacing the primary antibody with PBS. These routinely showed no immunolabeling.
Nuclear counterstaining was carried out with the Feulgen method. This consisted of hydrolyzing sections with 3 N HCl solution for 15 min at 40°C and then treated for 1 h in darkness with Schiff’s reagent (prepared with basic fuchsin; Fluka Chemie, Buchs, Switzerland) at room temperature. After washing them in a fresh sulfurous acid solution, the stained sections were rinsed in distilled water and postfixed in methanol at – 20°C for 15 min. Once dried at room temperature, they were exposed to trypsin (Sigma, 0.025%) and 0.1% CaCl2 solution in PBS 0.15 M for 5 min at 25°C. The slides were then washed in 0.5% triton X-100 in PBS to remove any trace of enzyme and incubated with the antibodies as previously explained.
2.5. Qualitative and quantitative analyses
The light microscopic analysis was made with a Zeiss Axiophot microscope using a 63X oil immersion objective. Two sections per pup were analyzed. Data from each section were combined to obtain a mean for each cerebellar parameter per animal. To estimate the relative number of nuclei that had incorporated BrdU at a given time, the labeling index (LI) was calculated as a percentage of BrdU-reactive interphase nuclei per total number of scored neuroepithelial cells. Moreover, mitotic figures were examined for the presence or absence of DAB reaction product in the pertinent slides. Mitotic figures were easily identified based on their typical characteristics. The mitotic index (MI) was defined as the ratio of mitotic figures to total neuroepithelial cells.
The duration and phases of the cell cycle were inferred from the graphic representation of the percentage of labeled mitoses plotted as a function of survival time after BrdU administration, which describes a sinusoidal curve [16,22,23]. A mean duration of G2 (post-DNA synthetic phase) + 1/2 mitotic phase (TM), TG2 + 1/2 TM, is equal to the time required for 50% of the mitotic figures to become BrdU-positives. The duration for the S-phase (TS, DNA synthetic phase) has been estimated from the elapsed time between the 50% intercepts of the ascending and descending limbs of Figure 4(a). The duration of the whole cycle (Tc) is the time necessary to pass from the first 50% of tagged mitosis to the third. The duration of G1 (pre-DNA synthetic phase) + 1/2 M (TG1 + 1/2 TM) is then calculated by subtracting TG2 + 1/2 TM + TS from Tc.
Figure 4.
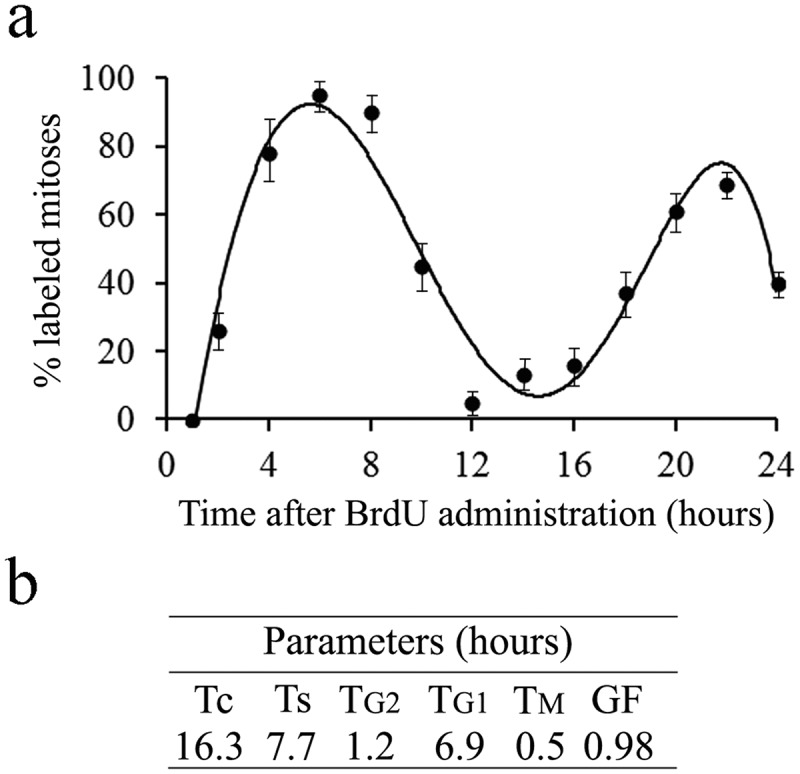
(a) Percentage of mitosis labeled in the cerebellar neuroepithelium at successive times following a single injection of BrdU. (b) Values for phase durations, growth fraction and cell cycle length of the neuroepithelial cells.
TM is found by the equation: TM = MI/100 x Tc/GF. The growth fraction (GF), defined as the ratio of proliferating cells to the whole population in study, was calculated with the equation: GF = Tc/TS x LI/100 [16,23].
2.6. Data analysis
The proportion of labeled interphasic nuclei was analyzed with the one-way ANOVA method, followed by individual comparison of means with the Student-Newman-Keuls (SNK) test. The percentages of labeled mitoses plotted as a function of survival time after BrdU exposure were analyzed adjusting a polynomial regression model of fifth order. In the experiment involving the cumulative BrdU-labeling sequence, a least square regression was performed to determine the best fit for the data. The results are expressed as mean ± SEM. Differences are considered to be significant when the “P” value is <0.05. The statistical analysis was carried out using the SPSS (version 18) statistical software.
2.7. Photographic material
The photographic material was captured with a CCD-IRIS color video camera (Sony, Japan), coupled to a Zeiss Axiosphot microscope. The digitized images were processed with the Adobe Photoshop software.
3. Results
The cerebellar neuroepithelium is composed, at E13, by a homogenous population of small and packed cells, most of which are round-like in shape. They have large nuclei that occupy much of the space within the somas. Current microscopic observations reveal that the neuroblasts that incorporated the marker can be distinguished by the presence of a brown pigment over their nuclei. The DAB reaction product is always confined to the nuclear material. When nuclear counterstain is employed, the brown tint provides an intense contrast against the color exhibited by non-immunoreactive nuclei. So, unlabeled nuclei are pink-colored with the Feulgen method (Figure 2). Tagged mitoses, i.e., mitotic figures with either all or part of each individual chromosome labeled, started to be detected 2 hours after BrdU injection (Figure 2).
Figure 2.
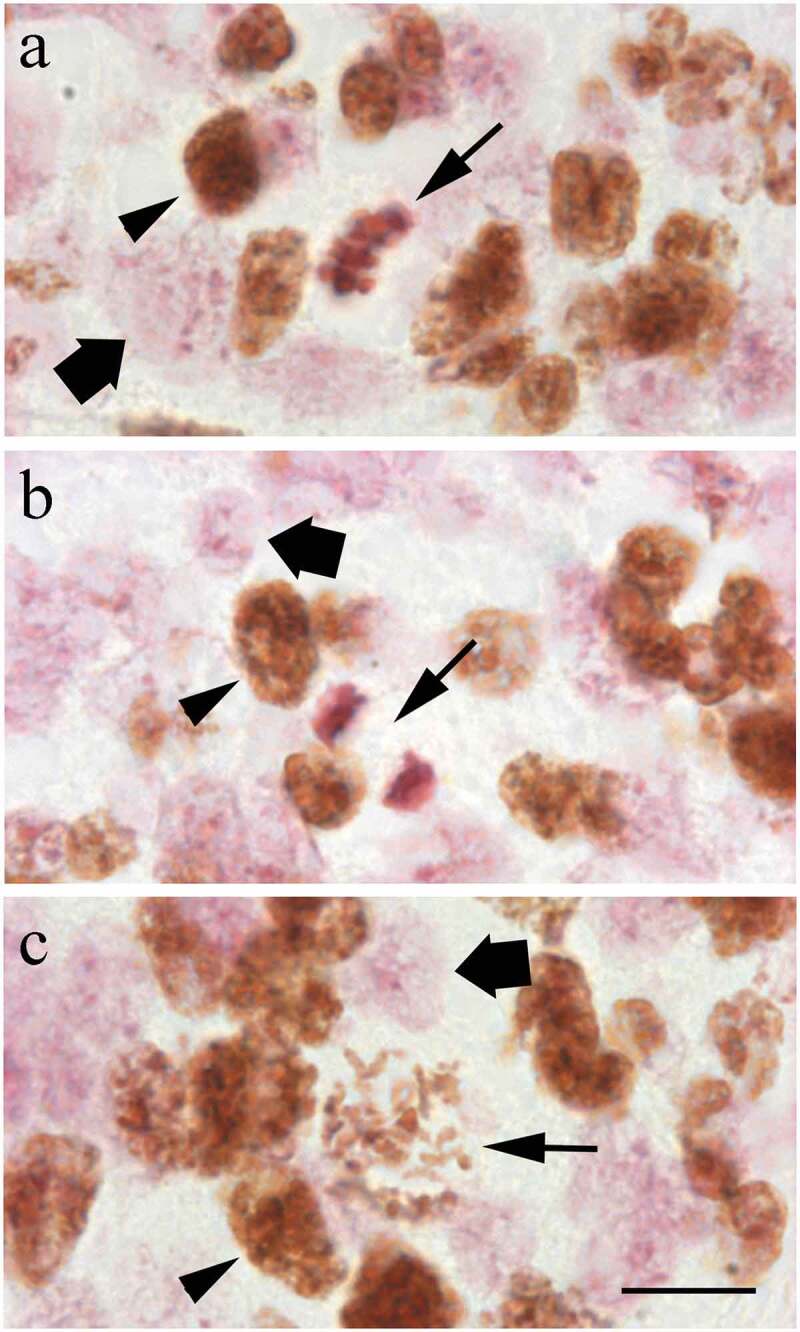
High magnification of BrdU-immunoreactive cells in the cerebellar neuroepithelium of rats allowed to survive for 4 h after marker injection. BrdU-stained cells are those presenting a brown reaction product in their nuclei (arrowhead in a to c), while unlabeled cells are stained with Feulgen (squat arrow in a to c). Long arrows indicate examples of immunolabeled cells in metaphase (a), anaphase (b) and prophase (c). Scale bar: 20 µm.
3.1. The fraction of S-phase cells
At the onset of the cerebellar development, the neuroepithelium presents a high percentage of neuron progenitors engaged in DNA synthesis. In this experiment, rats were injected with BrdU and allowed to survive for 0.5, 1, or 2 h, and the corresponding immunohistochemical method was then performed. After 0.5 h, only a small fraction of neuroepithelial cells were tagged. At 1 and 2 h following BrdU administration, more labeled cells were present. Data analysis revealed significant effects from 0.5 to 2 h after marker exposure [F(3, 16) = 19.6 (p < 0.001)]. Statistical analysis indicated that the LI increased from 0.5 to 1 h after BrdU injection. Stable values were reached from 1 to 2 h (Figure 3). Although it is possible that 0.5 h between BrdU injection and killing approximates the time that BrdU is present in the circulation [22], the measured LI after a one-hour period provides an adequate estimate of the fraction of cells in the S-phase under our working conditions.
Figure 3.
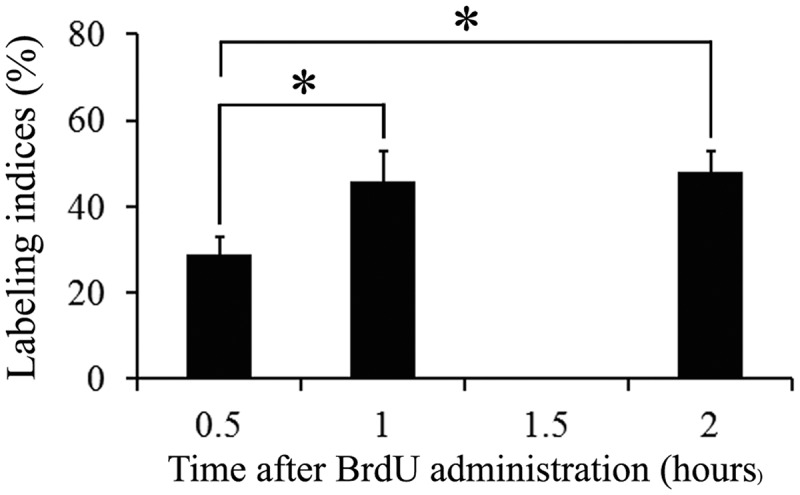
Frequency of BrdU-reactive cells in the cerebellar neuroepithelium in rats sacrificed at 0.5, 1 and 2 h after a single injection of BrdU. Note that stable values are reached from 1 h on. Asterisk indicates statistical significance, p < 0.05.
3.2. Cell cycle parameters after a single administration of BrdU
In order to determine generation times of neuroepithelial cells, a group of rats received a single BrdU injection and a wide range of survival times were examined (from 2 to 24 h). The marker labels a cohort of asynchronous cycling cells in the S-phase, and the subsequent course of division cycle can be quantitatively analyzed from the rhythmic appearance and disappearance of mitotic cells. In the appropriate histological preparations, only mitotic figures were recorded for the presence or absence of the immunoperoxidase-label. The width of the neuroepithelium is essentially stable throughout the 24-h experimental interval.
The variation that takes place in the fraction of labeled mitoses is depicted in Figure 4(a). The curve shows a rapid rise to more than 90%, the level of which is maintained from 4 to 8 h, and a slow descent until the hour 12. As survival time after BrdU exposure increased, the percent of labeled mitoses began to increase again by 14 h. This second rise peaked at 22 h. Phase durations and cell-cycle length of the neuroepithelium are represented in Figure 4(b).
3.3. Cell cycle parameters after cumulative labeling with BrdU
In the second procedure, a group of rats received multiple injections of BrdU at time intervals shorter than TS (0 and 4 h; 0, 4 and 7 h; 0, 4, 7 and 10 h; 0, 4, 7, 10, and 13 h) and were allowed to survive for 1 h after the last injection. Under these conditions of exposure to BrdU, all nuclei passing through S-phase will be labeled [15]. Animals sacrificed 1 h after a single injection were also included in this analysis. The most remarkable feature of repeated exposure to BrdU is the increasing number of labeled cells. Data analysis revealed that the LI increased linearly from 0.28 at the 0.5 h time point to 0.98 at 11.0 h (Figure 5(a)). Adopting a rationale which has often been applied under conditions of continuous BrdU supply in the cerebral wall [14,15,24], values for Ts, GF, and Tc can be calculated in Figure 5(a) from the y-intercept (=Ts/Tc*GF) and from the time at which the curve approaches the asymptote (i.e., the time required to tag the complete GF). The latter represents the extent of Tc-Ts and the GF corresponds to the maximum LI attained at Tc-Ts. Values of Ts, GF, and Tc are represented in Figure 5(b).
Figure 5.
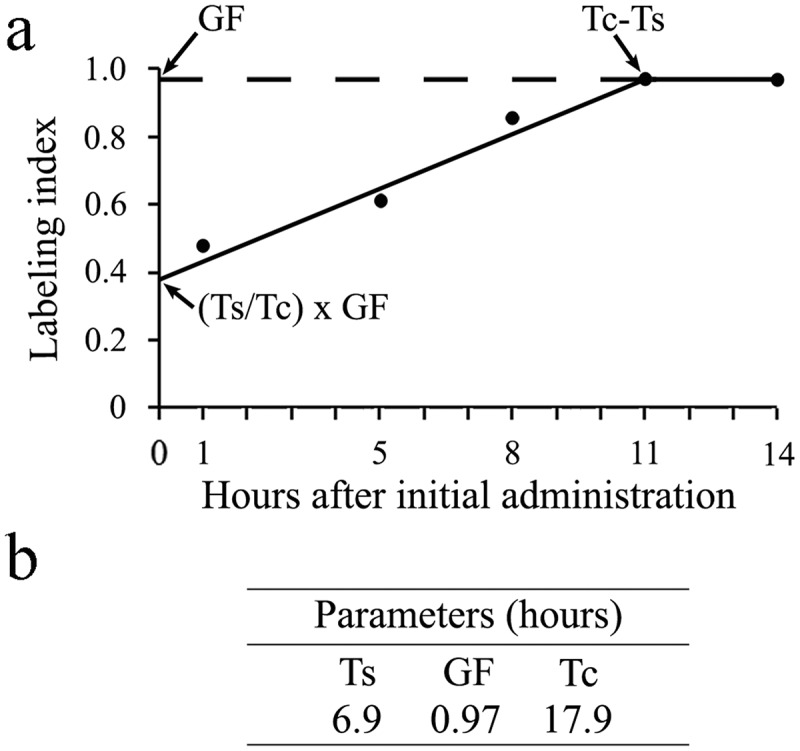
(a) Frequency of labeled cells in the cerebellar neuroepithelium throughout the time-course of a cumulative BrdU-treatment. Each data point indicates the mean LI ± SEM obtained one hour after the last injection of BrdU. (b) Values for S-phase, growth fraction and cell cycle length of the neuroepithelial cells.
Finally, in order to address the possibility that cumulative labeling with BrdU may alter the cell cycle kinetic, we compared the MI in the neuroepithelium from rats sacrificed 1 h after BrdU administration with the MI in those killed 11 h following the first administration of the marker. The results of these comparisons were values of 2.5 ± 0.2 and 2.4 ± 0.2, respectively. These data suggest that repeated administrations of BrdU (35 mg/kg) have no effect on the cell cycle progression.
4. Discussion
The administration of the halogenated pyrimidine analog BrdU can be used to determine the cell kinetics of embryonic tissues [12,25]. In this current study, we analyzed BrdU incorporation in proliferative neuroblasts and inferred the duration and phases of the cell cycle in the cerebellar neuroepithelium. We calculated the Tc, GF, and Tc on the basis of two theoretical models of generative behavior, the steady-state and the exponential growth. To our knowledge, there are no other published reports in the area of reference based upon S-phase marking with BrdU. Moreover, no data are available in the literature to compare our current results with cell kinetic data provided with thymidine radiography. Up to now, the cell cycle parameters have been inferred in the neural tube [9] and in the embryonic cerebral wall [14,15,26] but not in the cerebellar neuroepithelium.
A point that deserves attention is the choice of the optimal dose of BrdU to label cells in S-phase. Previous reports have indicated that the injection of BrdU in a cumulative labeling sequence during the gestation is well tolerated and produces neither cytotoxic effects nor alters cell cycle progression in the cerebral wall of prenatal mice [14,15,27]. This observation requires particular consideration because it has been reported that the administration of BrdU to embryos has harmful effects on the development of several regions of the nervous system [28,29], including the cerebellum [17,30]. At the dose level used in our study (35 mg/Kg), BrdU does not seem to affect the ability of neuroblasts to divide, as assessed with the measured MI when this nucleoside was administered four times over a 14 h period. Moreover, it is important to indicate that this dose provides a good BrdU-signal, which allows a confident identification of those neuron precursors engaged in DNA synthesis.
We have analyzed the incorporation of BrdU within the cerebellar neuroepithelium by examining a range of survival times after a single BrdU-administration and a cumulative BrdU-labeling sequence. Most cell cycle parameters obtained in these analyses are based on LI determination. In short-term assays, the proportion of labeled cells is stabilized after 1 h of BrdU injection, i.e., a saturation level is reached from this moment on. The availability time of BdU for proliferating neuroepithelial neuroblasts is one aspect that is taken into account for this current observation, although it should be interpreted with caution, since, when analyzed on its own, minimal labeling time can be a misleading indicator of the BrdU acquisition rate. In this context, the bulk of incorporation of 3H-BrdU tracer doses into replicating DNA of mature tissues was achieved within 1 h of exposure [31,32]. Moreover, it has been shown that, in the dorsomedial cerebral wall of embryos, a single administration of BrdU labels 100% S-phase nuclei over a period of time ranging from 15 min to 2 h [27]. These results seem to indicate that factors other than the dose of BrdU employed, such as the amount of BrdU incorporated in each S nucleus and the methodological conditions, may also be involved in the microscopic identification of BrdU-reactive cells.
The comparison of the two proliferative models used to determine the Tc, GF, and Tc, steady-state and exponential kinetics, is an interesting issue, since the growth characteristics of proliferating neuroepithelial neuroblasts are still unknown. When a cumulative BrdU-labeling protocol was carried out with an inter-injection period shorter than the length of the S-phase, the GF was close to 100% at around 11 hours after the start of the experiment. Our current results suggest that both models of generative behavior can be adopted to analyze cell cycle parameters in the cerebellar neuroepithelium. The differences between both models when Ts and Tc were calculated (0,8 h and 1.6 h, respectively) are not so striking if the following points are borne in mind: (I) the minimum BrdU-incorporation interval already discussed, (II) the existence of “false negatives,” i.e., those nuclei that did not incorporate enough BrdU to cross the immunostaining threshold for detection, and (III) the possibility that more than one proliferating cell population would be present. In this context, it has been established that, in the rat cerebellum, the generation of the neurons of the deep nuclei and Purkinje cells starts at E13 [4], just when BrdU was administered in the current study.
5. Conclusions
In summary, the high incidence of proliferative cells in the cerebellar neuroepithelium permits a determination of the cell cycle parameters of these cells on the basis of the percent-labeled mitoses and the proportion of BrdU-positive interphase nuclei. We propose that steady-state and exponential kinetics can be adopted successfully for E13 to study the proliferative behavior of the developing cerebellum.
Acknowledgments
The authors are very grateful to Drs. María del Carmen Santa-Cruz and José Pablo Hervás for providing the animals.
Disclosure statement
The authors declare that they have no conflicts of interest.
Availability of data
The data that support the findings of this study are available from the corresponding author upon reasonable request.
References
- [1].D’Angelo E. Physiology of the cerebellum. Handb Clin Neurol. 2018;154:85–108. [DOI] [PubMed] [Google Scholar]
- [2].Marien P, Borgatti R.. Language and the cerebellum. Handb Clin Neurol. 2018;154:181–202. [DOI] [PubMed] [Google Scholar]
- [3].Schmahmann JD. The cerebellum and cognition. Neurosci Lett. 2019;688:62–75. [DOI] [PubMed] [Google Scholar]
- [4].Altman J, Bayer SA. Development of the cerebellar system: in relation to its evolution, structure and functions. Boca Raton: CRC Press, Inc; 1997. [Google Scholar]
- [5].Leto K, Arancillo M, Becker EB, et al. Consensus paper: cerebellar development. Cerebellum. 2016;15:789–828. [DOI] [PMC free article] [PubMed] [Google Scholar]
- [6].Beckinghausen J, Sillitoe RV. Insights into cerebellar development and connectivity. Neurosci Lett. 2019;688:2–13. [DOI] [PMC free article] [PubMed] [Google Scholar]
- [7].Suzuki-Hirano A, Harada H, Sato T, et al. Activation of Ras-ERK pathway by Fgf8 and its downregulation by Sprouty2 for the isthmus organizing activity. Dev Biol. 2010;337:284–293. [DOI] [PubMed] [Google Scholar]
- [8].Wang L, Liu Y. Signaling pathways in cerebellar granule cells development. Am J Stem Cells. 2019;8:1–6. [PMC free article] [PubMed] [Google Scholar]
- [9].Schulze B, Korr H. Cell kinetic studies of different cell types in the developing and adult brain of the rat and the mouse: a review. Cell Tissue Kinet. 1981;14:309–325. [DOI] [PubMed] [Google Scholar]
- [10].Schorl C, Sedivy JM. Analysis of cell cycle phases and progression in cultured mammalian cells. Methods. 2007;41:143–150. [DOI] [PMC free article] [PubMed] [Google Scholar]
- [11].Sakaue-Sawano A, Kurokawa H, Morimura T, et al. Visualization spatiotemporal dynamics of multicellular cell-cycle progression. Cell. 2008;132:487–498. [DOI] [PubMed] [Google Scholar]
- [12].Harris L, Zalucki O, Piper M. BrdU/Edu dual labeling to determine the cell-cycle dynamics of defined cellular subpopulations. J Mol Hist. 2018;49:229–234. [DOI] [PubMed] [Google Scholar]
- [13].Etienne O, Bery A, Roque T, et al. Assessing cell cycle progenitor of neural stem and progenitor cells in the mouse developing brain after genotoxic stress. J Vis Exp. 2014;87:e51209. [DOI] [PMC free article] [PubMed] [Google Scholar]
- [14].Takahashi T, Nowakowski RS, Caviness JR. BUdR as an S-phase marker for quantitative studies of cytokinetic behaviour in the murine cerebral ventricular zone. J Neurocytol. 1992;21:185–197. [DOI] [PubMed] [Google Scholar]
- [15].Takahashi T, Nowakowski RS, Caviness JR. Cell cycle parameters and patterns of nuclear movement in the neocortical proliferative zone of the fetal mouse. J Neurosci. 1993;13:820–833. [DOI] [PMC free article] [PubMed] [Google Scholar]
- [16].Molina V, Rodríguez-Vázquez L, Owen D, et al. Cell cycle analysis in the rat external granular layer evaluated by several bromodeoxyuridine immunoperoxidase staining protocols. Histochem Cell Biol. 2017;148:477–488. [DOI] [PubMed] [Google Scholar]
- [17].Martí J, Santa-Cruz MC, Serra R, et al. Systematic differences in time of cerebellar-neuron origin derived from bromodeoxyuridine immunoperoxidase staining protocols and tritiated thymidine autoradiography: a comparative study. Int J Devl Neurosci. 2015;47:216–228. [DOI] [PubMed] [Google Scholar]
- [18].Martí J, Santa-Cruz MC, Serra R, et al. Hydroxyurea treatment and development of the rat cerebellum: effects on the neurogenetic profiles and settled patterns of Purkinje cells and deep cerebellar nuclei neurons. Neurotox Res. 2016;30:563–580. [DOI] [PubMed] [Google Scholar]
- [19].Altman J, Bayer SA. Atlas of prenatal rat brain development. Boca Raton: CRC Press, Inc; 1995. [Google Scholar]
- [20].Rodríguez-Vázquez L, Martí J. Effects of hydroxyurea exposure on the rat cerebellar neuroepithelium: an immunohistochemical and electron microscopy study along the anteroposterior and mediolateral axes. Neurotox Res. 2017;32:671–682. [DOI] [PubMed] [Google Scholar]
- [21].Rodríguez-Vázquez L, Vons O, Valero O, et al. Hydroxyurea exposure and development of the cerebellar external granular layer: effects on granule cell precursors, Bergmann glial and microglial cells. Neurotox Res. 2019;35:387–400. [DOI] [PubMed] [Google Scholar]
- [22].Lewis PD, Balázs R, Patel AJ, et al. The effect of undernutrition in early life on cell generation in the rat brain. Brain Res. 1975;83:235–247. [DOI] [PubMed] [Google Scholar]
- [23].Lauder JM. The effects of early hypo- and hyperthyroidism on the development of rat cerebellar cortex. III. Kinetics of cell proliferation in the external granular layer. Brain Res. 1977;126:31–51. [DOI] [PubMed] [Google Scholar]
- [24].Nowakowski RS, Lewin SB, Miller MW. Bromodeoxyuridine immunohistochemical determination of the lengths of the cell cycle and the DNA-synthetic phase for an anatomically defined population. J Neurocytol. 1989;18:311–318. [DOI] [PubMed] [Google Scholar]
- [25].Goodlad RA. Quantification of epithelial cell proliferation, cell dynamics, and cell kinetics in vivo. WIRE Dev Biol. 2017;6:e274. [DOI] [PubMed] [Google Scholar]
- [26].Lanctot AA, Guo Y, Le Y, et al. Loss of brap results in Premature G1/S phase transition and impeded neural progenitor differentiation. Cell Rep. 2017;20:1148–1160. [DOI] [PubMed] [Google Scholar]
- [27].Takahashi T, Nowakowski RS, Caviness JR. The cell cycle of the Pseudostratified ventricular epithelium of the embryonic murine cerebral wall. J Neurosci. 1995;15:6046–6057. [DOI] [PMC free article] [PubMed] [Google Scholar]
- [28].Duque A, Rakic P. Different effects of BrdU and 3H-Thymidine incorporation into DNA on cell proliferation, position and fate. J Neurosci. 2011;31:15205–15217. [DOI] [PMC free article] [PubMed] [Google Scholar]
- [29].Lehner B, Sandner B, Marschallinger J, et al. The dark side of BrdU in neural stem cell biology: detrimental effects on cell cycle, differentiation and survival. Cell Tissue Res. 2011;45:313–328. [DOI] [PubMed] [Google Scholar]
- [30].Sekerkova G, Ilijic E, Mugnaini E. Bromodeoxyuridine administered during neurogenesis of the projection neurons causes cerebellar defects in rat. J Comp Neurol. 2004;470:221–239. [DOI] [PubMed] [Google Scholar]
- [31].Packard DS, Menzies RA, Skalko RG. Incorporation of thymidine and its analog, bromodeoxyuridine, into embryos and maternal tissues of the mouse. Differentiation. 1973;1:397–405. [DOI] [PubMed] [Google Scholar]
- [32].Böswald M, Harasim S, Maurer-Schultze B. Tracer dose and availability time of thymidine and bromodeoxyuridine: application of bromodeoxyuridine in cell kinetic studies. Cell Tissue Kinet. 1990;23:169–181. [DOI] [PubMed] [Google Scholar]
Associated Data
This section collects any data citations, data availability statements, or supplementary materials included in this article.
Data Availability Statement
The data that support the findings of this study are available from the corresponding author upon reasonable request.


