

Abstract
Purpose:
To evaluate the feasibility of an empirical mathematical model (EMM) to fit dynamic contrast-enhanced MRI (DCE-MRI) data of hand and wrist synovitis and whether parameters of EMM are significantly correlated with clinical disease activity in patients with rheumatoid arthritis (RA).
Methods:
Thirty-one consecutive patients with RA prospectively underwent Institutional Review Board (IRB)- approved DCE-MRI scans with temporal resolution of 20 s using a 1.5T system. ROIs were placed where the highest signal increase was observed and the kinetic curves were analyzed using an EMM: ΔS(t) = A(1 − e−αt) e−βt, where ΔS is relative enhancement, t is time from when the signal increase was first observed, starting from baseline (ΔS = 0), A is the upper limit of signal intensity, α (s−1) is the rate of signal increase, and β (s−1) is the rate of signal decrease during washout. The initial slope of the kinetic curve (Aα), the initial area under the curve (AUC30), the time at which the kinetic curve reached its peak (Tpeak) and the signal enhancement ratio (SER) defined as the change in signal intensity between the initial and delayed time points (t = 60 and 300 s, respectively) were calculated. RA magnetic resonance imaging scores (RAMRIS) with and without contrast media were evaluated. These parameters or scores were compared with the Disease Activity Score (DAS) 28-erythrocyte sedimentation rate (ESR).
Results:
A showed a significant correlation with DAS28-ESR (r = 0.58; P = 0.0005). β, AUC30 and Tpeak were also significantly correlated with DAS28-ESR with a lesser degree (r = 0.49; P = 0.0051, r = 0.50; P = 0.0038 and r = −0.51; P = 0.0028, respectively), whereas α, Aα, SER and RAMRIS were not.
Conclusion:
EMM could fit the DCE-MRI data of hand and wrist synovitis. AUC30 obtained from the uptake phase of the kinetic curve as well as A, β and Tpeak obtained throughout the kinetic curve might be effective to predict the clinical disease activity.
Keywords: dynamic contrast-enhanced magnetic resonance imaging, mathematical model, rheumatoid arthritis
Introduction
Rheumatoid arthritis (RA) is a chronic autoimmune disease involving small joints in the skeleton, particularly of the hand, wrist, and feet. Synovitis is present from the early stages of the disease, and the degree of synovitis is known to correlate with future development of bone and joint destruction, leading to poor functional outcomes.1,2 Furthermore, the degree of synovitis in small joints, especially hand and wrist, has been reported to reflect clinical disease activity throughout the whole body.3 Therefore, detection of synovitis and monitoring of the degree of synovitis of hand and wrist might be important for appropriate management of this disease.
MRI can directly visualize the synovium and plays a major role in clinical practice for patients with RA.4–6 RA magnetic resonance imaging score (RAMRIS) has been provided by outcome measures in rheumatology Clinical Trial7,8 to evaluate the features of synovitis, bone erosion, and bone marrow edema with pre- and post-contrast T1- and T2-weighted fat saturated sequence images. RAMRIS is a well-established system with good correlations to the extent of clinical disease activity9,10; however, RAMRIS is a semi-quantitative scoring system in which synovitis is subjectively evaluated by grading synovial volume (scored 0–3) and the ability to monitor the degree of synovitis is not sufficient.
Dynamic contrast-enhanced MRI (DCE-MRI) is an alternative method to quantify the degree of the synovitis.5 DCE-MRI data might reflect the degree of synovitis because the signal changes obtained by DCE-MRI are influenced by various vascular-physiological changes, such as blood flow, blood volume, and synovial permeability.11,12 Although many previous studies have reported the usefulness of DCE-MRI, no consensus has yet been obtained about DCE-MRI analysis. Signal intensity obtained 35–55 s after injection of contrast media has been reported to be significantly correlated with clinical Disease Activity Scores (DAS) and histological findings5,13; however, this method of using the signal intensity at a single time point could lose some of the richness of data associated with the time enhancement curve. Kinetic curve-shape analysis is another approach to classify the enhancement effect into several patterns, in which fast enhancement followed by a delayed washout pattern reflects the presence of synovitis.14 Although this approach could facilitate detection of synovitis, it might be difficult to monitor the degree of synovitis quantitatively.
Recently, Fan et al.15 developed an empirical mathematical model (EMM) for the analysis of DCE-MRI data. EMM fits multiple data points throughout the contrast phases and can extract a few quantitative parameters that reflect uptake and washout behavior of contrast media. EMM facilitates relatively easy post-processing and has been applied to various conditions, including breast and prostate cancer,15–18 but not RA. We hypothesized that fitting EMM to DCE-MRI data throughout the contrast phases (until the washout phase) of hand and wrist synovitis in patients with RA could reveal the most appropriate parameters to reflect clinical disease activity.
While, DAS 28-erythrocyte sedimentation rate (DAS28-ESR) is one of the clinical DASs in patients with RA.19 DAS28-ESR has been used to verify the parameters of contrast enhancement of DCE-MRI in patients with RA.5 Therefore, we selected the DAS28-ESR as a standard parameter to verify the efficacy of EMM for DCE-MRI of hand and wrist synovitis.
The purpose of our study was to evaluate the feasibility of EMM to fit DCE-MRI data of hand and wrist synovitis and to evaluate whether EMM parameters are significantly correlated with clinical disease activity or DAS28-ESR in patients with RA.
Materials and Methods
Patients
Our Institutional Review Board approved this prospective study, and written informed consent was obtained from all patients prior to enrollment. Inclusion criteria were: (a) written informed consent, (b) RA diagnosis, (c) clinically active inflammation with DAS28-ESR higher than 2.6 and (d) evaluation of disease activity using MRI (patients newly diagnosed with RA and those who needed treatment change because their prior treatment was ineffective). RA diagnosis was performed for all patients according to the American College of Rheumatology (ACR) 1987 criteria20 or the 2010 ACR/European League against Rheumatism (EULAR) classification criteria for RA.21 Exclusion criteria was previous history of hand and wrist fracture or surgery. Between April 2017 and May 2018, 31 consecutive patients were enrolled in this study and underwent MRI scans at our hospital. The purposes of their MR scans were evaluation of disease activity for newly diagnosed RA (n = 12) and change of treatment (n = 19) including switch of biological drugs (n = 10). In addition to age, symptom duration and types of medication, the following clinical and laboratory parameters were collected: ESR (mm/h), C-reactive protein (CRP) level (mg/dL), metalloproteinases (MMP) 3 (ng/mL), tender joint count, swollen joint count, and Visual Analogue Scale (VAS) (0–100). DAS is a measure of disease activity based on a 28-joint count, which is performed on the number of joints with tenderness upon touching (TEN28), the number of swollen joints (SW28), ESR, and VAS. DAS28-ESR was calculated as follows:19
All these clinical and laboratory data were obtained within 2 weeks before the MRI scans. RA diagnosis and evaluation of DAS28-ESR were performed by an experienced orthopedic surgeon (9 years of experience in RA diagnosis) prior to the MRI scans.
MRI acquisition
All imaging was performed using a 1.5T Optima MR430s Extremity scanner (GE Healthcare, Milwaukee, WI, USA). Patients were placed in a sitting position with the hand centered in the magnetic field in an Optima 430s extremity coil (GE Healthcare). Protocols included pre- and post-contrast fat-suppressed T1-weighted images (T1WI) and DCE-MRI scanning: pre- and post-contrast fat-suppressed T1WI was acquired with following sequence (TR/TE [ms] = 600/7.1; FOV = 100 mm; slice thickness = 5 mm; matrix size = 258 × 192; bandwidth = 61 Hz; flip angle = 90°; number of slices = 20; temporal resolution = 238 s; fat suppression method, chemical shift selective [CHESS]; axial orientation for hand and wrist, respectively) and the DCE-MRI was acquired using a 3D fat-suppressed T1-weighted gradient-echo sequence (TR/TE [ms] = 72/4; FOV = 160 mm; slice thickness = 5 or 6 mm; matrix size = 258 × 128; bandwidth = 80 Hz; flip angle = 70°; number of slices = 8; phase = 20, temporal resolution = 20 s; fat suppression method, spoiled gradient echo [SPGR]; coronal orientation) with meglumine gadoterate (Magnescope, Fuji Pharma Co. Ltd., Tokyo, Japan) administered intravenously at a dose of 0.2 mmol/kg body weight, followed by a 20 mL saline flush at a rate of 2 mL/s. The post-contrast DCE-MRI acquisition (scan time of 20 s) started 10 s after the beginning of contrast injection: 20 post-contrast series of DCE-MRI were repeatedly acquired until 410 s after the beginning of contrast injection (Fig. 1).
Fig. 1.
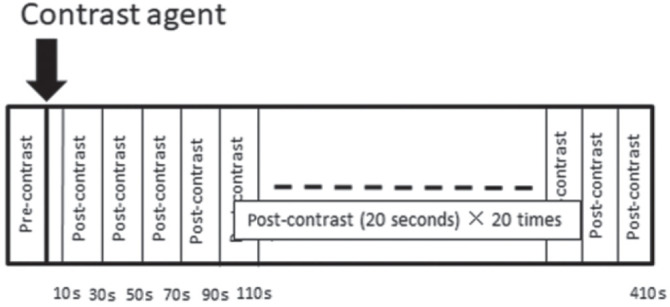
Protocols for dynamic contrast-enhanced (DCE) MRI. The DCE-MRI series include pre- and post-contrast scans. The post-contrast DCE-MRI starts 10 s after the beginning of contrast injection, and 20 post-contrast DCE-MRI scans (each scan time of 20 s) follow.
Analysis of lesion enhancement using DCE-MRI and EMM
Each set of MRI data was analyzed independently by two radiologists, J.O. and N.M. (13 and 2 years of experience in musculoskeletal MR imaging) who were blinded to the clinical information. The DCE-MR images were transferred to a clinical workstation (Aquarius NET, TeraRecon Inc., San Mateo, CA, USA) for placement of ROIs and analysis of signal intensity changes. The oval or round ROIs were manually placed inside three joints perceived to have the highest signal increase independently by the two radiologists, J.O. and N.M. (Figs. 2a and 3a). The last phase of DCE-MR images (the 20th post-contrast phase) was used to place ROIs in the same manner as our prior studies.18 When the number of enhancing joints was <3, ROIs were placed in only one or two joints. Care was taken for the ROI to occupy at least three pixels. The ROIs were copied to all DCE-MR phases to obtain the average signal intensity of the ROIs, and signal change (or increase rate of enhancement, ΔS) was calculated as follows (Figs. 2b and 3b):
| (1) |
where SIpre and SIpost indicate the average signal intensity of each ROI obtained before and after injection of contrast media, respectively.
Fig. 2.

Methods for placing a ROI (a) and acquiring kinetic curves (b) in dynamic contrast-enhanced MRI (DCE-MRI) of a 64-year-old woman diagnosed with rheumatoid arthritis. (a) Three ROIs (ROI 1–3) are placed at enhancing joints where the highest signal increase was found at the last DCE-MRI time point. The ROI was copied onto all other images to generate kinetic curves (b). (b) Kinetic curves of DCE-MRI for ROI 1 with time on the x-axis and enhancement (signal increase) on the y-axis. On the DCE-MRI kinetic curves, the real values and fitted curve are shown with blue dots and red line, respectively. t is time (s) from when the signal increase was first observed, starting from baseline (ΔS = 0). The signal intensity change (ΔS) at the initial time point (t = 60) and delayed time point (t = 300) was calculated to obtain signal enhancement ratio (SER). From the ROI 1, A, α, β, AUC30, Tpeak and SER are calculated as 312, 14.7 × 10⁻², 7.87 × 10⁻⁴, 7190, 43.7 and 1.31, respectively. All empirical mathematical model (EMM) parameters from the three ROIs are averaged, and the representative A, α, β, AUC30, Tpeak and SER are 326, 8.70 × 10⁻², 5.62 × 10⁻⁴, 5630, 33.3 and 1.17, respectively. Disease Activity Score (DAS)28-erythrocyte sedimentation rate (ESR) is 5.75. AUC, area under the curve.
Fig. 3.

Methods for placing a ROI (a) and acquiring kinetic curves (b) in dynamic contrast-enhanced MRI (DCE-MRI) of a 78-year-old woman diagnosed with rheumatoid arthritis. (a) An ROI is placed at an enhancing joint where the highest signal increase was found in DCE-MRI (ROI 1). In this case, the number of enhancing joints was two (<3), and an ROI was placed on an enhancing joint (a). The ROI 2 was placed on the other slice. The ROI was copied to all other images to generate kinetic curves (b). (b) Kinetic curves of DCE-MRI with time on the x-axis and enhancement (signal increase) on the y-axis. On the DCE-MRI kinetic curves, the real values and fitted curve are shown with blue dots and red curve, respectively. t is time (s) from when the signal increase was first observed, starting from baseline (ΔS = 0). The signal intensity change (ΔS) at the initial time point (t = 60) and delayed time point (t = 300) was calculated to obtain signal enhancement ratio (SER). From ROI 1, A, α, β, AUC30, Tpeak and SER are calculated as 61.9, 1.19 × 10⁻², 0, 297, 400 and 0.52, respectively. All empirical mathematical model (EMM) parameters from the two ROIs are averaged, and the representative A, α, β, AUC30, Tpeak and SER are 56.1, 2.65 × 10⁻², 0, 431, 400 and 0.696, respectively. Disease Activity Score (DAS)28-erythrocyte sedimentation rate (ESR) is 2.88. AUC, area under the curve.
We analyzed the kinetic curves obtained from the ROIs using the EMM following the method of Jansen et al.,22 in which three parameters were used (Figs. 2b and 3b):
| (2) |
where t is time (s) from when the signal increase was first observed, starting from baseline (ΔS = 0). A is the upper limit of signal intensity (%), α (s−1) is the rate of signal increase, and β (s−1) is the rate of signal decrease during washout. The goodness-of-fit of parameter R2 was calculated for each ROI. Then, we obtained following parameters to analyze the kinetic curve in detail.
The initial slope of the kinetic curve was calculated as the multiplied product of A and α: Aα.
- The initial area under the curve (AUCγ) was calculated by integration of the kinetic curve, as follows:
where γ is the time over which signal intensity was integrated. In this study, we used γ = 30 s following the method of Jansen et al.22(3) - The time at which the kinetic curve reached its peak (Tpeak) was the point at which the derivative of Eq. (2) was zero. Then, Tpeak can be calculated as follows:
When β < 0, the curve did not reach the peak within the duration of the experiment. In this case, we used the last point as the peak intensity.(4) - signal enhancement ratio (SER) was defined as the signal intensity change (ΔS) at the initial time point (t = 60) relative to the delayed time point (t = 300). SER was calculated as follows (Figs. 2b and 3b):
In this study, we used the time point (t = 60) as the initial time point following the method of the previous study.12 The time when the signal increase was first observed (t = 0) was ranging from 47 to 62 s after the injection of contrast media and we used the time point (t = 300) as the delayed time point. A SER value >1.0 indicates that the signal intensity decreases with respect to its value at the first time point, SER = 1.0 indicates that the signal intensity plateaus after the first time point, and SER <1.0 indicates that the signal intensity continues to rise. All EMM parameters from the three ROIs were averaged to obtain patient’s representative parameters. The EMM parameters were compared with DAS28-ESR.(5)
Conventional imaging assessment using RAMRIS system
Synovitis was assessed at seven regions (three wrist sites and the second to fifth metacarpophalangeal [MCP] joints) in the hand and scored from 0 to 3 in each region (total score, 21) by the same two radiologists, J.O. and N.M.. To evaluate the synovitis without contrast media, the synovial volume of distal radioulnar joint, radiocarpal joint, and intercarpal-carpometacarpal joint of wrist and the second to fifth MCP joints of finger was scored from 0 to 3 with reference to RAMRIS image atlas using pre-contrast T1-weighted images (scores without contrast media). Then, the contrast-enhanced synovial volume of the joints was scored from 0 to 3 with reference to RAMRIS image atlas using pre- and post-contrast T1-weighted images (scores with contrast media). The RAMRIS scores without and with contrast media were compared with DAS28-ESR.
Statistical analysis
The relationships between each EMM parameter or RAMRIS score and patient’s DAS28-ESR were analyzed using Spearman’s correlation analysis. Interobserver reliability of results of EMM and RAMRIS scores from two readers were assessed using interclass correlation coefficient (ICC). An r-value of 1.0 indicated perfect agreement; 0.81–0.99, almost perfect agreement; 0.61–0.80, substantial agreement; 0.41–0.60, moderate agreement; 0.21–0.40, fair agreement; and 0.20 or less, slight agreement.23 Statistical analyses were performed using commercial software (JMP Pro 13, SAS Institute, Cary NC, USA). P < 0.05 was considered significant. After Bonferroni correction for nine multiple comparisons, the critical value became <0.00555 (0.05/9).
Results
Patients’ characteristics are shown in Table 1. The median age was 66 years (range 46–81 years). Medication prior to enrollment in this study was prednisolone (n = 6, 5 [2–8.5] mg/day), methotrexate (n = 8, 6 [2–10] mg/week), Tumor Necrosis Factor (TNF)-α inhibitor (n = 3), Tocilizumab (n = 4), and Abatacept (n = 3). The median DAS28-ESR was 4.7 (range 2.7–6.6). EMM accurately fit the DCE-MRI curves, with R2 >0.90 for all cases. Of the relationships between each EMM parameter and patient’s DAS28-ESR, A was significantly correlated with DAS28-ESR (r = 0.58; P = 0.0005). β, AUC30 and Tpeak were also significantly correlated with DAS28-ESR, but less strongly (r = 0.49; P = 0.0051, r = 0.50; P = 0.0038 and r = −0.51, P = 0.0028, respectively), whereas α, Aα and SER were not (P = 0.044, 0.027 and 0.0095 respectively) (Table 2). There was no significant correlation between the RAMRIS scores without or with contrast media and DAS28-ESR (Table 2). In terms of agreement between readers, the ICCs of A, β and Tpeak were 0.71, 0.63 and 0.75, respectively, indicating substantial agreement. The ICC of AUC30 was 0.91, indicating almost perfect agreement.
Table 1.
Patients’ characteristics (n = 31)
| Variables | Number or median (range) |
|---|---|
| Age (years) | 66 (46–81) |
| Symptom duration median (month) | 13 (0–28) |
| Medication (n = 19) | |
| Prednisolone (n = 6) (mg/day) | 5 (2–8.5) |
| Methotrexate (n = 8) (mg/week) | 6 (2–10) |
| TNF-α inhibitor (n = 3) | |
| Tocilizumab (n = 4) | |
| Abatacept (n = 3) | |
| Disease activity (median [range]) | |
| Swollen joint count (0–28) | 4 (0–13) |
| Tender joint count (0–28) | 4 (0–9) |
| VAS (0–100) | 44 (15–86) |
| ESR (mm 1st h) | 32.5 (2–80) |
| CRP (mg/mL) | 0.5 (0.02–14.3) |
| MMP3 (mg/mL) | 94.6 (14.1–1995) |
| DAS28-ESR | 4.7 (2.7–6.6) |
VAS, Visual Analogue Scale; DAS, Disease Activity Score; ESR, erythrocyte sedimentation rate; CRP, C-reactive protein; MMP, metalloproteinases.
Table 2.
Spearman’s correlation coefficients between EMM parameters of DCE-MRI or RAMRIS scores and DAS28-ESR scores and ICCs of the parameters (n = 31)
| Valuesa | r | P | ICC | |
|---|---|---|---|---|
| EMM parameters of DCE-MRI | ||||
| A (%) | 232 ± 71.2 | 0.58 | *0.0005 | 0.71 (0.36, 0.87) |
| α (s−1) | 5.41 ± 3.97 × 10⁻² | 0.36 | 0.044 | 0.31 (−0.51, 0.68) |
| β (s−1) | 2.86 ± 3.77 × 10⁻⁴ | 0.49 | *0.0051 | 0.63 (0.19, 0.83) |
| Aα (% s−1) | 13.8 ± 13.4 | 0.39 | 0.027 | 0.78 (0.51, 0.90) |
| AUC30 | 3130 ± 1830 | 0.50 | *0.0038 | 0.91 (0.82, 0.96) |
| Tpeak (s) | 207 ± 145 | −0.51 | *0.0028 | 0.75 (0.46, 0.88) |
| SER | 0.96 ± 0.210 | 0.46 | 0.0095 | 0.73 (0.19, 0.90) |
| RAMRIS | ||||
| Scores without contrast media (median, range) | 7 (0–20) | 0.30 | 0.10 | 0.44 (−0.19, 0.74) |
| Scores with contrast media (median, range) | 10.5 (1–21) | 0.28 | 0.14 | 0.76 (0.47, 0.89) |
After Bonferroni correction of nine multiple comparisons, the critical value became P < 0.0055(0.05/9).
Values are mean ± SD. Values in parentheses are 95% confidence limits.
Statistically significant. ICC, interclass correlation coefficient; RAMRIS, rheumatoid arthritis magnetic resonance imaging score; DAS, Disease Activity Score; ESR, erythrocyte sedimentation rate; SER, signal enhancement ratio.
Discussion
Dynamic contrast-enhanced-MRI is a method to acquire kinetic curves, which are related to perfusion, capillary permeability, and diffusion of contrast media from blood vessels to the extracellular space.11 To quantitatively analyze kinetic curves, EMM was developed on the basis of physiology-related mathematical analysis,11,15 and it provides parameters that represent the characteristics of contrast uptake and washout.15,16 We showed that EMM could fit the DCE-MRI data of hand and wrist synovitis in patients with RA. In this study, A had the highest correlation coefficient with DAS28-ESR among the parameters (r = 0.58; P = 0.0005). As A is the upper limit of signal intensity, it represents the same idea as the maximum relative enhancement (MRE) in conventional non-model analysis. Some previous studies that used non-model analysis showed the correlation of MRE with several clinical DASs and histological vascularity,5 and our study reinforced their results. While, there was no significant correlation between the RAMRIS scores without or with contrast media and DAS28-ESR. Our results were consistent with the results reported previously.24,25
There are several metrics such as DAS28-ESR, DAS28-CRP, clinical disease activity index and simplified disease activity index etc. for scoring the clinical disease activity. DAS has been developed to measure the clinical disease activity and widely used in clinical trials in patients with RA.26 Some studies reported that DAS28-CRP underestimates disease activity and overestimates the treatment response compared with DAS28-ESR.27–29 Therefore, we used DAS28-ESR to verify the efficacy of EMM for DCE-MRI of hand and wrist synovitis in patients with RA in this study.
There was no significant correlation between DAS28-ESR and α as well as Aα in our study. On the other hand, there was a significant correlation between DAS28-ESR and AUC30. α is the rate of signal increase and Aα is the initial slope of the kinetic curve, both of them are parameters obtained by the uptake phase of the kinetic curve changing prominently after the injection of contrast media and might be susceptible to the temporal resolution of DCE-MRI. Our DCE-MRI protocol included 20 s scans repeatedly acquired after the injection of contrast media, and 20 s scans might be insufficient to accurately evaluate the uptake phase of the kinetic curve. While, AUC30 was calculated by integration of the kinetic curves. Although AUC30 might be affected by the error of A and α due to the insufficient temporal resolution, it might be less susceptible to the temporal resolution of DCE-MRI than α and Aα.
In this study, we defined SER as the signal intensity change at the initial time point (60 s) relative to the delayed time point (300 s). SER reflects the shape of the kinetic curve’s washout phase. The characteristic curve-shape types of DCE-MRI data include the following four patterns: slow and gradual increase, fast enhancement followed by persistent enhancement phase, fast enhancement followed by washout phase, and fast enhancement followed by plateau phase.30–32 All four types are characterized by initial enhancement, whereas only one curve pattern shows washout in a delayed phase. In 2007, Lavini et al.14 introduced a new semi-quantitative approach to analyze the curve-shape type in DCE-MRI of the knee in patients with RA. They used a large ROI covering the entire synovium in the knee and drew curve-shape maps pixel-by-pixel according to curve-shape type. They showed that “fast enhancement followed by washout phase” pattern was observed more often in patients with active RA compared with non-RA patients or patients with inactive RA.33,34 This means that the curve shape in the delayed phase or SER can distinguish between active and inactive synovitis related to RA. In this study, β was significantly correlated with clinical DASs in patients with RA, while SER tended to correlate with DAS28-ESR but was not significant (r = 0.46; P = 0.0095). Their previous reports using pixel-by-pixel method have been performed for the knee to distinguish between active and inactive synovitis.14,33–36 While synovitis in small joints, such as those in the hand and wrist, is more frequently involved in RA than the knee, and the degree of synovitis in small joints has been reported to be associated with clinical disease activity.3 The difference of the area of synovitis might affect the results, leading to the difference between our study and the previous reports. Furthermore, the curve-shape type analysis inevitably involves the delayed phase data about 6–7 min after the injection of contrast media to analyze the curve pattern. In our study, we showed that A and AUC30 were significantly correlated with clinical disease activity (DAS28-ESR). A was a parameter obtained throughout the kinetic curve of DCE-MRI in this study, while AUC30 is calculated by integration of the kinetic curve from t = 0 to 30 (the uptake phase) immediately after the injection of contrast media. Although the total scan time of DCE-MRI necessary to calculate A has not yet been known, AUC30 might be acquired in a shorter time than A. These results indicate that the uptake phase DCE-MRI might be sufficient to evaluate the clinical disease activity, and that it would be possible to simplify the protocol of the DCE-MRI or reduce the total scan time by omitting the delayed phase of DCE-MRI. DCE-MRI with higher temporal resolution (<20 s) might improve the accuracy of EMM parameters such as A and AUC30 obtained from the uptake phase. We suppose that EMM parameters from the uptake phase might substantially represent the vascular-physiological changes of synovitis in patients with RA. Furthermore, the interobserver reliability of A and AUC30 of EMM was high as well as that of RAMRIS scores with contrast media, and these EMM parameters were considered to be adequate for clinical use. Further study is needed to evaluate the optimal scanning protocol to evaluate clinical disease activity in patients with RA in the future.
Previous studies reported the significant difference of Tpeak between malignant and benign lesions in breast, head and neck area.22,37,38 Malignant lesions might have strong and rapid enhancement, whereas benign lesions might have weak and slow enhancement,37 leading to the significant difference of Tpeak between the two groups. In the same way as malignant and benign lesions, active synovitis might have strong and rapid enhancement, whereas inactive synovitis might have weak and slow enhancement.
Patients with active synovitis have been reported to have higher clinical disease activity or DAS28-ESR than patients with inactive synovitis.3 Thus, it was unsurprising that our results showed significant negative correlation between Tpeak and DAS28-ESR (r = −0.51; P = 0.0028). Regarding the calculation of β and Tpeak, β < 0 means that the curve did not reach the peak within the duration of the DCE-MRI protocol and we used the last point as the Tpeak in such cases. To calculate β and Tpeak more precisely for all patients, the total scan time of this study was not enough; however, longer scan time may be difficult in clinical practice.
Several limitations of this study should be acknowledged. First, the number of patients included in this study was small and the study population was not uniform. Our study included both patients with newly diagnosed RA and patients who had a history of treatment for RA including DMADRs (disease modifying anti-rheumatic drugs) and prednisolone. Further evaluation is needed to confirm the relationship between EMM parameters acquired by DCE-MRI and clinical disease activity in patient subgroups. Second, selection of the ROI with the strongest enhancement was subjective, although the interobserver reliability was high for the significant parameters. Third, this was a single-center study using a single MR system. A multi-center study and data from different MR systems are needed to confirm our results. Fifth, we used DCE-MRI protocol with 20 s scans. Studies to evaluate the appropriate temporal resolution for DCE-MRI of hand and wrist synovitis will be needed.
Conclusion
In conclusion, it is feasible to apply EMM to fit the DCE-MRI data of patients with RA. Among the parameters, AUC30 obtained from the uptake phase of the kinetic curve as well as A, β and Tpeak obtained throughout the kinetic curve might be effective to predict the clinical disease activity. Our preliminary results demonstrated the potential of EMM to assess DCE-MRI of hand and wrist synovitis in patients with RA.
Acknowledgments
The authors thank Tatsuo Nagasaka, RT of Tohoku University Hospital, Sendai, Japan, for his excellent technical assistance and kind support. The authors thank Yumi Fujimoto in Tohoku University Hospital and Kazufumi Watanabe, Mari Yamaoka, Hiroki Ichida and Mayu Sawaguchi in Tohoku University for their kind support.
Footnotes
Funding
This study was supported by a grant (JSPS KAKENHI 18K09052) from Japan Society for the Promotion of Science.
Conflicts of Interest
The authors declare that they have no conflicts of interest.
References
- 1.Schett G, Gravallese E. Bone erosion in rheumatoid arthritis: mechanisms, diagnosis and treatment. Nat Rev Rheumatol 2012; 8:656–664. [DOI] [PMC free article] [PubMed] [Google Scholar]
- 2.Conaghan PG, O’Connor P, McGonagle D, et al. Elucidation of the relationship between synovitis and bone damage: a randomized magnetic resonance imaging study of individual joints in patients with early rheumatoid arthritis. Arthritis Rheum 2003; 48:64–71. [DOI] [PubMed] [Google Scholar]
- 3.Glinatsi D, Baker JF, Hetland ML, et al. Magnetic resonance imaging assessed inflammation in the wrist is associated with patient-reported physical impairment, global assessment of disease activity and pain in early rheumatoid arthritis: longitudinal results from two randomised controlled trials. Ann Rheum Dis 2017; 76:1707–1715. [DOI] [PubMed] [Google Scholar]
- 4.Ostergaard M, Hansen M, Stoltenberg M, et al. Magnetic resonance imaging-determined synovial membrane volume as a marker of disease activity and a predictor of progressive joint destruction in the wrists of patients with rheumatoid arthritis. Arthritis Rheum 1999; 42:918–929. [DOI] [PubMed] [Google Scholar]
- 5.Hodgson RJ, O’Connor P, Moots R. MRI of rheumatoid arthritis image quantitation for the assessment of disease activity, progression and response to therapy. Rheumatology (Oxford) 2008; 47:13–21. [DOI] [PubMed] [Google Scholar]
- 6.Goupille P, Roulot B, Akoka S, et al. Magnetic resonance imaging: a valuable method for the detection of synovial inflammation in rheumatoid arthritis. J Rheumatol 2001; 28:35–40. [PubMed] [Google Scholar]
- 7.Bird P, Conaghan P, Ejbjerg B, et al. The development of the EULAR-OMERACT rheumatoid arthritis MRI reference image atlas. Ann Rheum Dis 2005; 64:i8–i10. [DOI] [PMC free article] [PubMed] [Google Scholar]
- 8.Østergaard M, Edmonds J, McQueen F, et al. An introduction to the EULAR-OMERACT rheumatoid arthritis MRI reference image atlas. Ann Rheum Dis 2005; 64:i3–i7. [DOI] [PMC free article] [PubMed] [Google Scholar]
- 9.Woodworth TG, Morgacheva O, Pimienta OL, Troum OM, Ranganath VK, Furst DE. Examining the validity of the rheumatoid arthritis magnetic resonance imaging score according to the OMERACT filter-a systematic literature review. Rheumatology (Oxford) 2017; 56:1177–1188. [DOI] [PMC free article] [PubMed] [Google Scholar]
- 10.Haavardsholm EA, Ostergaard M, Ejbjerg BJ, et al. Reliability and sensitivity to change of the OMERACT rheumatoid arthritis magnetic resonance imaging score in a multireader, longitudinal setting. Arthritis Rheum 2005; 52:3860–3867. [DOI] [PubMed] [Google Scholar]
- 11.Tofts PS, Brix G, Buckley DL, et al. Estimating kinetic parameters from dynamic contrast-enhanced T1-weighted MRI of a diffusable tracer: standardized quantities and symbols. J Magn Reson Imaging 1999; 10:223–232. [DOI] [PubMed] [Google Scholar]
- 12.Ostergaard M, Stoltenberg M, Løvgreen-Nielsen P, Volck B, Sonne-Holm S, Lorenzen I. Quantification of synovistis by MRI: correlation between dynamic and static gadolinium-enhanced magnetic resonance imaging and microscopic and macroscopic signs of synovial inflammation. Magn Reson Imaging 1998; 16:743–754. [DOI] [PubMed] [Google Scholar]
- 13.Cimmino MA, Innocenti S, Livrone F, Magnaguagno F, Silvestri E, Garlaschi G. Dynamic gadolinium-enhanced magnetic resonance imaging of the wrist in patients with rheumatoid arthritis can discriminate active from inactive disease. Arthritis Rheum 2003; 48:1207–1213. [DOI] [PubMed] [Google Scholar]
- 14.Lavini C, de Jonge MC, van de Sande MG, Tak PP, Nederveen AJ, Maas M. Pixel-by-pixel analysis of DCE MRI curve patterns and an illustration of its application to the imaging of the musculoskeletal system. Magn Reson Imaging 2007; 25:604–612. [DOI] [PubMed] [Google Scholar]
- 15.Fan X, Medved M, River JN, et al. New model for analysis of dynamic contrast-enhanced MRI data distinguishes metastatic from nonmetastatic transplanted rodent prostate tumors. Magn Reson Med 2004; 51:487–494. [DOI] [PubMed] [Google Scholar]
- 16.Fan X, Medved M, Karczmar GS, et al. Diagnosis of suspicious breast lesions using an empirical mathematical model for dynamic contrast-enhanced MRI. Magn Reson Imaging 2007; 25:593–603. [DOI] [PMC free article] [PubMed] [Google Scholar]
- 17.Pineda FD, Medved M, Wang S, et al. Ultrafast bilateral DCE-MRI of the breast with conventional Fourier sampling: preliminary evaluation of semi-quantitative analysis. Acad Radiol 2016; 23:1137–1144. [DOI] [PMC free article] [PubMed] [Google Scholar]
- 18.Mori N, Abe H, Mugikura S, et al. Ultrafast dynamic contrast-enhanced breast MRI: kinetic curve assessment using empirical mathematical model validated with histological microvessel density. Acad Radiol 2019; 26:e141–e149. [DOI] [PMC free article] [PubMed] [Google Scholar]
- 19.Prevoo ML, van’t Hof MA, Kuper HH, van Leeuwen MA, van de Putte LB, van Riel PL. Modified disease activity scores that include twenty-eight-joint counts. Development and validation in a prospective longitudinal study of patients with rheumatoid arthritis. Arthritis Rheum 1995; 38:44–48. [DOI] [PubMed] [Google Scholar]
- 20.Arnett FC, Edworthy SM, Bloch DA, et al. The American Rheumatism Association 1987 revised criteria for the classification of rheumatoid arthritis. Arthritis Rheum 1988; 31:315–324. [DOI] [PubMed] [Google Scholar]
- 21.Aletaha D, Neogi T, Silman AJ, et al. 2010 Rheumatoid arthritis classification criteria: an American College of Rheumatology/European League Against Rheumatism collaborative initiative. Arthritis Rheum 2010; 62:2569–2581. [DOI] [PubMed] [Google Scholar]
- 22.Jansen SA, Fan X, Karczmar GS, Abe H, Schmidt RA, Newstead GM. Differentiation between benign and malignant breast lesions detected by bilateral dynamic contrast-enhanced MRI: a sensitivity and specificity study. Magn Reson Med 2008; 59:747–754. [DOI] [PMC free article] [PubMed] [Google Scholar]
- 23.Landis JR, Koch GG. The measurement of observer agreement for categorical data. Biometrics 1977; 33: 159–174. [PubMed] [Google Scholar]
- 24.Brown AK, Quinn MA, Karim Z, et al. Presence of significant synovitis in rheumatoid arthritis patients with disease-modifying antirheumatic drug-induced clinical remission: evidence from an imaging study may explain structural progression. Arthritis Rheum 2006; 54:3761–3773. [DOI] [PubMed] [Google Scholar]
- 25.Shimizu T, Cruz A, Tanaka M, et al. Structural changes over a short period are associated with functional assessments in rheumatoid arthritis. J Rheumatol 2019; pii: jrheum.180496. [DOI] [PubMed]
- 26.Fransen J, van Riel PL. The Disease Activity Score and the EULAR response criteria. Clin Exp Rheumatol 2005; 23:S93–S99. [PubMed] [Google Scholar]
- 27.Fleischmann R, van der Heijde D, Koenig AS, et al. How much does Disease Activity Score in 28 joints ESR and CRP calculations underestimate disease activity compared with the Simplified Disease Activity Index?. Ann Rheum Dis 2015; 74:1132–1137. [DOI] [PubMed] [Google Scholar]
- 28.Inoue E, Yamanaka H, Hara M, Tomatsu T, Kamatani N. Comparison of Disease Activity Score (DAS)28- erythrocyte sedimentation rate and DAS28- C-reactive protein threshold values. Ann Rheum Dis 2007; 66:407–409. [DOI] [PMC free article] [PubMed] [Google Scholar]
- 29.Matsui T, Kuga Y, Kaneko A, et al. Disease Activity Score 28 (DAS28) using C-reactive protein underestimates disease activity and overestimates EULAR response criteria compared with DAS28 using erythrocyte sedimentation rate in a large observational cohort of rheumatoid arthritis patients in Japan. Ann Rheum Dis 2007; 66:1221–1226. [DOI] [PMC free article] [PubMed] [Google Scholar]
- 30.van Rijswijk CS, Hogendoorn PC, Taminiau AH, Bloem JL. Synovial sarcoma: dynamic contrast-enhanced MR imaging features. Skeletal Radiol 2001; 30:25–30. [DOI] [PubMed] [Google Scholar]
- 31.van Rijswijk CS, Geirnaerdt MJ, Hogendoorn PC, et al. Soft-tissue tumors: value of static and dynamic gadopentetate dimeglumine-enhanced MR imaging in prediction of malignancy. Radiology 2004; 233:493–502. [DOI] [PubMed] [Google Scholar]
- 32.Kuhl CK, Mielcareck P, Klaschik S, et al. Dynamic breast MR imaging: are signal intensity time course data useful for differential diagnosis of enhancing lesions? Radiology 1999; 211:101–110. [DOI] [PubMed] [Google Scholar]
- 33.van der Leij C, van de Sande MG, Lavini C, Tak PP, Maas M. Rheumatoid synovial inflammation: pixel-by-pixel dynamic contrast-enhanced MR Imaging time-intensity curve shape analysis—a feasibility study. Radiology 2009; 253:234–240. [DOI] [PubMed] [Google Scholar]
- 34.Hemke R, Lavini C, Nusman CM, et al. Pixel-by-pixel analysis of DCE-MRI curve shape patterns in knees of active and inactive juvenile idiopathic arthritis patients. Eur Radiol 2014; 24:1686–1693. [DOI] [PubMed] [Google Scholar]
- 35.van de Sande MG, van der Leij C, Lavini C, Wijbrandts CA, Maas M, Tak PP. Characteristics of synovial inflammation in early arthritis analysed by pixel-by-pixel time-intensity curve shape analysis. Rheumatology (Oxford) 2012; 51:1240–1245. [DOI] [PubMed] [Google Scholar]
- 36.van der Leij C, Lavini C, van de Sande MG, de Hair MJ, Wijffels C, Maas M. Reproducibility of DCE-MRI time-intensity curve-shape analysis in patients with knee arthritis: a comparison with qualitative and pharmacokinetic analyses. J Magn Reson Imaging 2015; 42:1497–1506. [DOI] [PubMed] [Google Scholar]
- 37.Szabó BK, Aspelin P, Wiberg MK, Boné B. Dynamic MR imaging of the breast. Analysis of kinetic and morphologic diagnostic criteria. Acta Radiol 2003; 44:379–386. [DOI] [PubMed] [Google Scholar]
- 38.Zhu L, Zhang C, Hua Y, et al. Dynamic contrast-enhanced MR in the diagnosis of lympho-associated benign and malignant lesions in the parotid gland. Dentomaxillofac Radiol 2016; 45:20150343. [DOI] [PMC free article] [PubMed] [Google Scholar]