Abstract
RAG endonuclease initiates V(D)J recombination in progenitor (pro)-B cells1. Upon binding a recombination center (RC)-based JH, RAG scans upstream chromatin via loop extrusion, potentially mediated by cohesin, to locate Ds and assemble a DJH-based RC2. CTCF looping factor-bound elements (CBEs) within IGCR1 upstream of Ds impede RAG-scanning3–5; but their inactivation allows scanning to proximal VHs where additional CBEs activate rearrangement and impede scanning any further upstream5. Distal VH utilization is thought to involve diffusional RC access following large-scale Igh locus contraction6–8. Here, we test the potential of linear RAG-scanning to mediate distal VH usage in G1-arrested v-Abl-pro-B cell lines9, which undergo robust D-to-JH but little VH-to-DJH rearrangements, presumably due to lack of locus contraction2,5. Through an auxin-inducible approach10, we degrade the cohesin-component Rad2110–12 or CTCF12,13 in these G1-arrested lines. Rad21 degradation eliminated all V(D)J recombination and RAG-scanning-associated interactions, except RC-located DQ52-to-JH joining in which synapsis occurs by diffusion2. Remarkably, while CTCF degradation suppressed most CBE-based chromatin interactions, it promoted robust RC interactions with, and robust VH-to-DJH joining of, distal VHs, with patterns similar to those of “locus-contracted” primary pro-B cells. Thus, down-modulation of CTCF-bound scanning-impediment activity promotes cohesin-driven RAG-scanning across the 2.7Mb Igh locus.
Cohesin is a conserved chromosome-associated multi-subunit ring-shaped ATPase complex built upon subunits of the structural maintenance of chromosomes (Smc) family and is important for diverse chromosome-based processes14–16. The cohesin complex is proposed to form contact loops by extrusion of chromatin until reaching convergent CTCF-bound CBE anchors17,18. Cohesin extrudes DNA in an NIPBL-MAU2 and ATP-hydrolysis-dependent manner in vitro19,20. The cohesin complex is implicated in chromatin loop extrusion-mediated mechanisms of physiological lymphocyte D-to-JH recombination and Igh class switch recombination2,21. To further explore cohesin role(s) in chromatin scanning in V(D)J recombination, we employed a mini auxin-inducible degron (mAID) approach10 to conditionally degrade the Rad21 core cohesin complex component in v-Abl-kinase-transformed, Eμ-Bcl2-expressing mouse pro-B cells (“v-Abl pro-B cells”). These cells can be viably arrested in the G1 cell-cycle stage by treatment with Abl kinase inhibitor (STI-571), activating RAG1/2 endonuclease and V(D)J recombination9. We targeted both mouse Rad21 alleles to introduce in-frame sequences encoding mAID and a fluorescent Clover protein marker in a RAG2-deficient v-Abl pro-B line (Extended Data Fig. 1a,b). We then introduced a transgene that over-expresses the OsTir1-V5 protein that binds mAID in the presence of auxin (Indole-3-acetic acid, IAA) to trigger proteasome-dependent degradation of the mAID-fused Rad21 protein (Extended Data Fig. 1c). The resulting RAG2-deficient v-Abl pro-B cells are referred to as “Rad21-degron cells”.
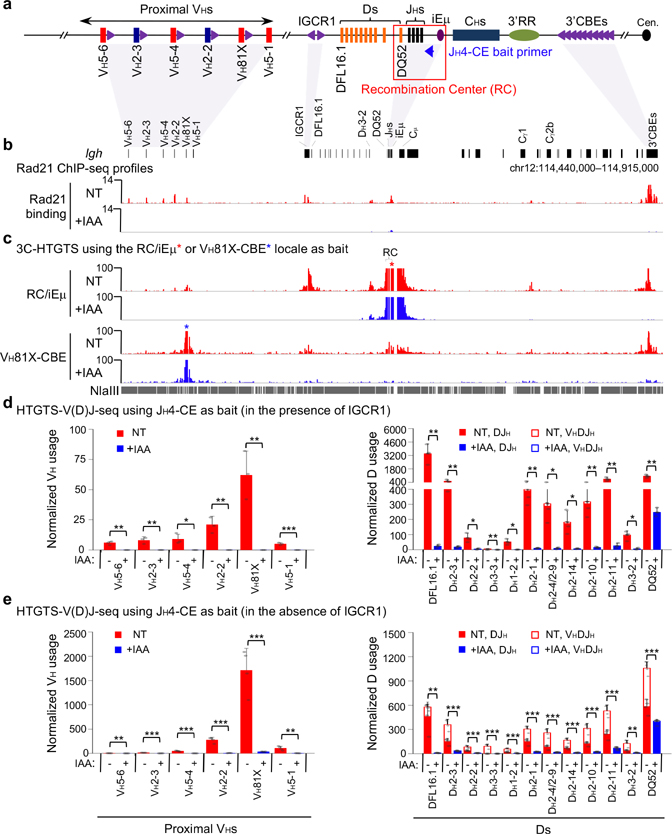
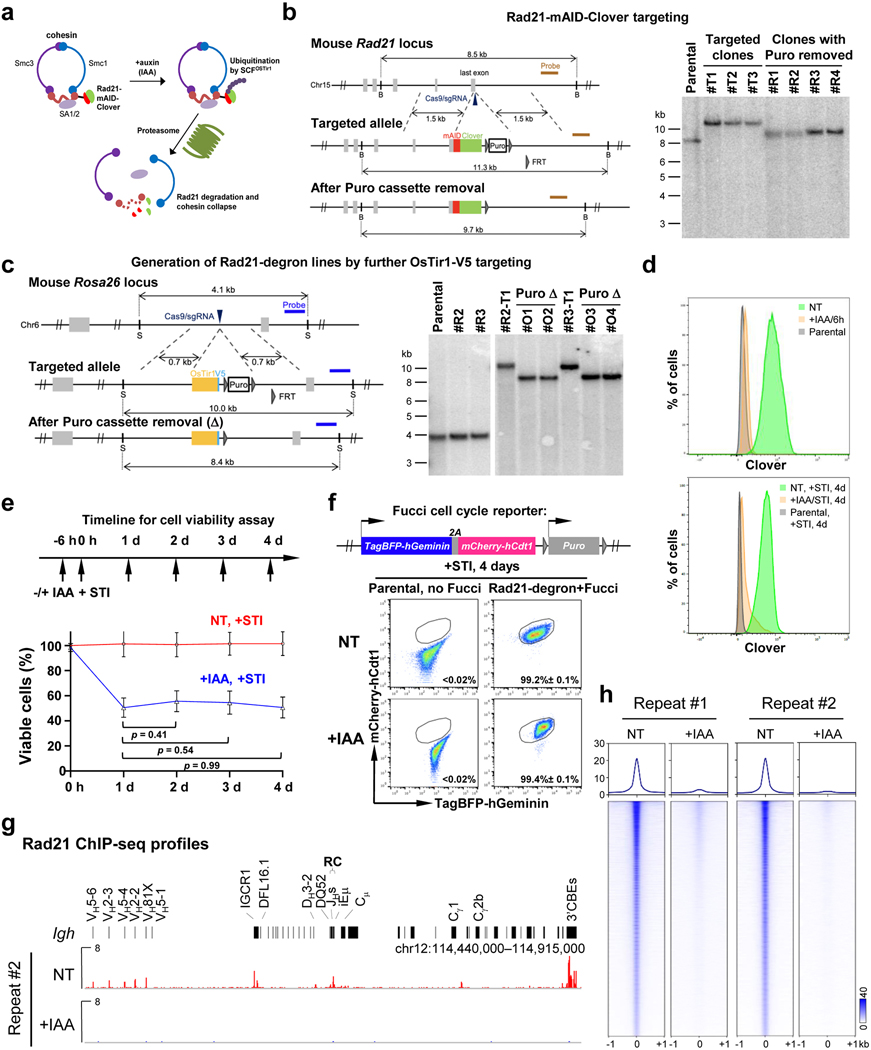
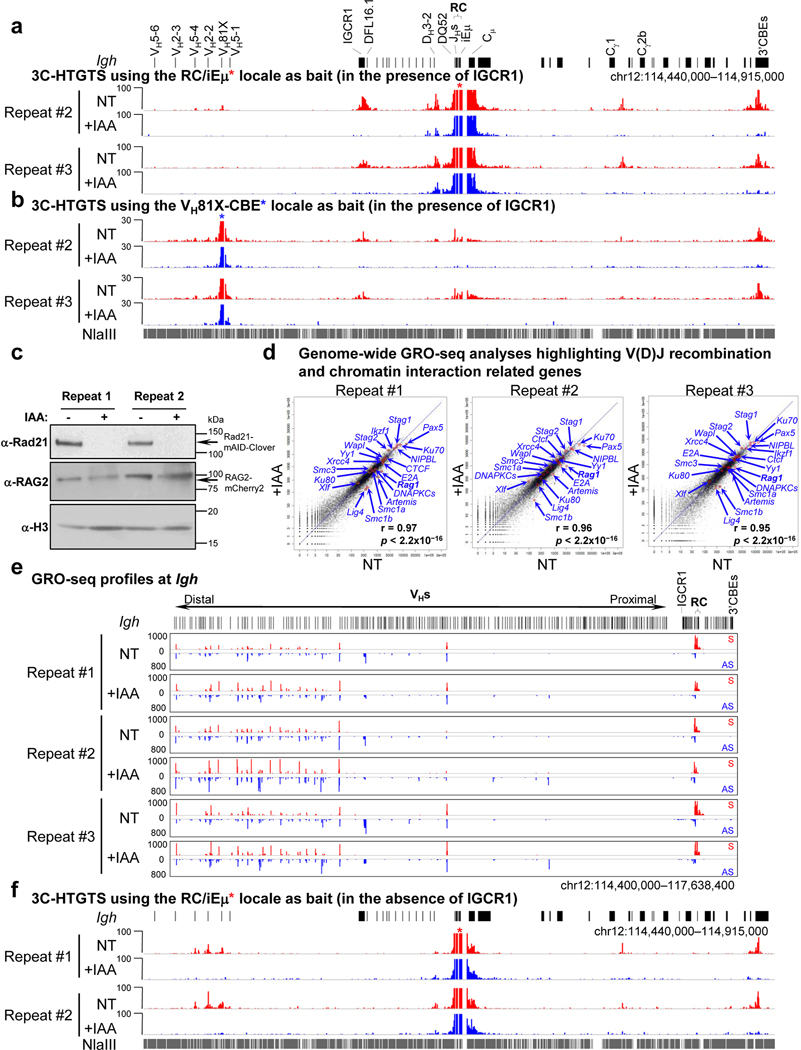
To test effects of cohesin depletion on Igh loop domain formation, we split Rad21-degron cells into two sub-populations, one non-treated (“NT”), and the other treated with IAA for 6 hours; then, both were treated with STI-571 for 4 days to induce G1 arrest. In IAA-treated, but not NT, Rad21-degron cells, the mAID-Clover-tagged Rad21 was substantially depleted after 4-days of STI-571 treatment (Extended Data Fig. 1d). While there was cell loss in the day after treatment while cells were cycling, cohesin-depleted Rad21-degron cells underwent normal STI-571-induced G1 arrest and had no further decrease in viability throughout the remaining experimental period (Extended Data Fig. 1e,f). ChIP-seq confirmed depletion of chromatin-bound Rad21 across Igh and genome-wide in G1-arrested IAA-treated Rad21-degron cells (Fig. 1a,b, Extended Data Fig. 1g,h). We applied the sensitive chromatin interaction 3C-HTGTS assay5 to G1-arrested NT and IAA-treated Rad21-degron cells at day 4 and found that cohesin loss essentially abrogated Igh chromatin loop domains mediated by the RC and by the CBE associated with the most D-proximal functional VH (VH81X-CBE)5 (Fig. 1c, Extended Data Fig. 2a,b).
Fig. 1 |. Cohesin depletion abrogates Igh loop domains and V(D)J rearrangements except RC-based DQ52-to-JH joining in G1-arrested Rad21-degron cells.
a, Schematic of the murine Igh locus (not to scale) showing proximal VHs, Ds, JHs, CHs, and regulatory elements as indicated, with recombination center (RC) that comprises the JH-proximal DQ52 segment, four JH segments, and the intronic enhancer (iEμ) highlighted. Purple arrowheads indicate organization of CBEs. Blue arrow denotes the JH4 coding-end (CE) bait primer used for generating HTGTS-V(D)J-seq libraries. Cen. centromere. b, c, Representative profiles of Rad21 ChIP-seq (b, two biological repeats with similar results) and 3C-HTGTS chromatin interactions (c) using the RC/iEμ (red asterisk) or VH81X-CBE (blue asterisk) as bait (three biological repeats with similar results for each bait) at Igh locus as diagrammed at the top in non-treated (NT) and IAA-treated (+IAA) G1-arrested Rad21-degron cells. See Extended Data Fig. 1g and 2a,b for additional biological repeats. d, e, HTGTS-V(D)J-seq analysis of utilization of indicated proximal VH (left) and D (right) segments on IGCR1-intact (d) and IGCR1-deleted (e) barcoded alleles (see Methods) in RAG2-complemented, NT and IAA-treated G1-arrested Rad21-degron cells. n=3 (d) and n=4 (e) biological repeats for each condition. D segments obtained from DJH and VHDJH joins are denoted by filled and open bars, respectively. Data are presented as mean ± s.d. p values were calculated using unpaired two-tailed t-test (*: p ≤ 0.05, **: p ≤ 0.01, and ***: p ≤ 0.001). See Supplementary Table 1 for exact p values. See Methods for details.
To test effects on Igh V(D)J recombination, we introduced RAG2 into Rad21-degron cells, with or without IAA, and treated both with STI-571 to induce G1 arrest and activation of V(D)J recombination. After four days, western blotting confirmed mAID-Clover-tagged Rad21 depletion and comparable RAG2 expression before and after IAA treatment (Extended Data Fig. 2c). We further applied HTGTS-V(D)J-seq22 to NT and IAA-treated cells using a JH4 primer bait to analyze both D-to-JH and VH-to-DJH junctions (Fig. 1a,d). Similar to V(D)J joining in other v-Abl lines, the NT Rad21-degron cells displayed robust D-to-JH rearrangements, with the JH-distal DFL16.1 having highest rearrangement frequency and JH-proximal DQ52 intermediate frequency2, along with low-level rearrangement of the most proximal VHs and little or no rearrangement of distal VHs2,5 (Fig. 1d, Supplementary Table 1). Strikingly, Rad21 depletion abolished all VH rearrangements and largely eliminated D rearrangements, except that of the RC-based DQ52 which accesses RAG by diffusion2 (Fig. 1d, Supplementary Table 1).
To better test effects of Rad21 depletion on VH-to-DJH recombination, we deleted IGCR1 in Rad21-degron lines, which as expected4,5, resulted in tremendous over-utilization of the most proximal VHs due to un-impeded RAG scanning (Fig. 1e, left panel, Supplementary Table 1). Rad21 depletion resulted in loss of D rearrangements except that of RC-based DQ52, and also essentially abrogated robust proximal VH utilization (Fig. 1e, Supplementary Table 1). Residual DQ52 rearrangement in Rad21-depleted lines provides an internal control for maintenance of RAG activity and integrity of a JH-based RC following cohesin depletion. GRO-seq analyses confirmed RAG1 expression and robust sense/anti-sense transcription through the RC after Rad21-depletion (Extended Data Fig. 2d,e). Further analyses revealed that VH to residual DQ52JH rearrangements were significantly reduced relative to predicted levels based on remaining levels of DQ52 rearrangements in IAA-treated IGCR1-deleted Rad21-degron cells (Supplementary Table 2), indicating cohesin depletion compromises VH-to-DJH as well as D-to-JH rearrangement. Consistent with impeded loop extrusion, Rad21 degradation abrogated robust Igh RC interaction with proximal VHs in the absence of IGCR1 (Extended Data Fig. 2f). Together, these findings implicate cohesin-mediated loop extrusion in mediating RC-bound RAG scanning for proximal VH-to-DJH recombination.
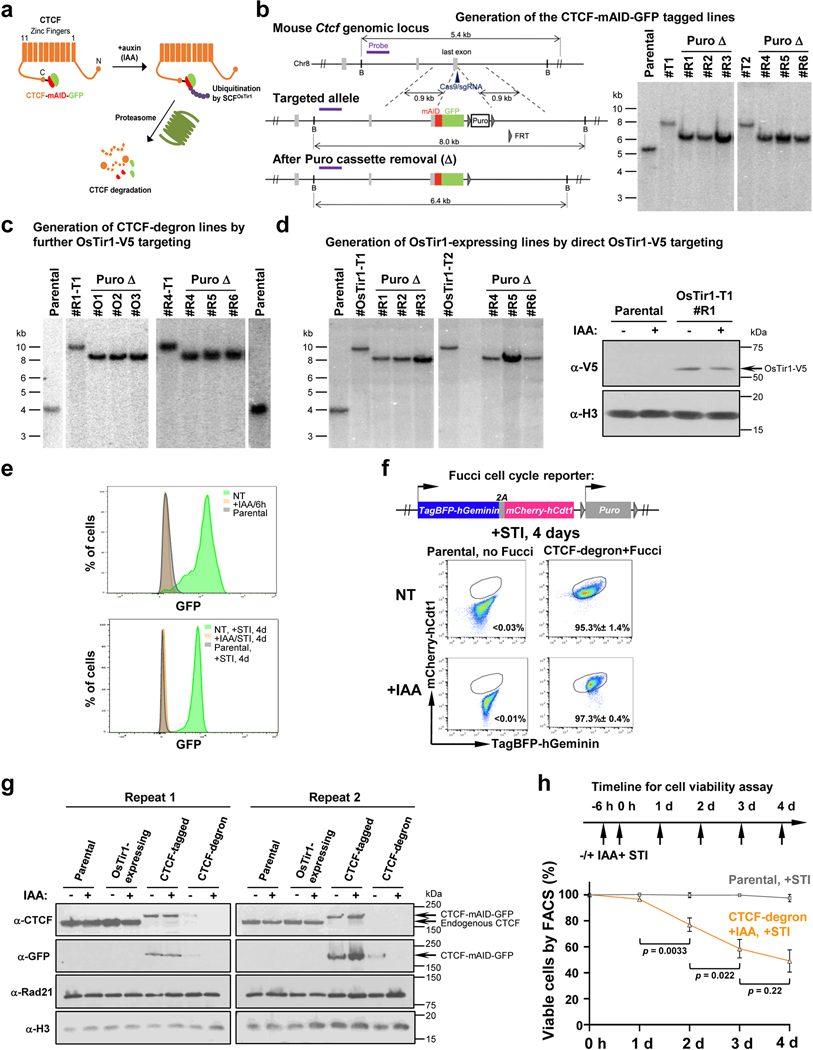
To initiate V(D)J recombination, RAG robustly cleaves only substrate gene segments flanked by complementary recombination signal sequences (RSSs), referred to as 12RSSs and 23RSSs1. The 100-plus VHs embedded over the VH locus have downstream 23RSSs in convergent orientation with the upstream 12RSS of the DJHRC. How these VHs gain access to the DJHRC for VH-to-DJH recombination has been a major question. There are four established VH domains which from proximal to distal are: 7183/Q52, Middle, J558 and J558/360923,24 (Fig. 2a,b). There are over 100 CBEs across these domains in convergent orientation with the upstream IGCR1 CBE3,6,8,25. While most CBEs are not physically adjacent to VHs, several dozen D-proximal VHs have RSS-associated CBEs that promote robust utilization of associated VHs mediated by increased interactions with the DJHRC during RAG upstream scanning5. Thus, these proximal VH CBEs are also barriers to more distal RAG scanning5. A long-standing model for utilization of more distal VHs is physical locus contraction that brings them into close orbit with the DJHRC allowing pairing of their 23RSS with the DJHRC-12RSS by diffusion6–8,26. Such a mechanism could circumvent CBE impediments to linear RAG scanning. Given that all VH-23RSS are in convergent orientation with the DJHRC-12RSS8, extrusion-mediated RAG scanning could theoretically contribute to distal VH utilization if CBE impediments were neutralized or circumvented. To address this hypothesis, we tested whether down-regulation of CTCF could activate RAG scanning to distal VHs in G1-arrested v-Abl pro-B cells. For this purpose, we generated CTCF-tagged and CTCF-degron v-Abl lines from the parental RAG2-deficient v-Abl line as described above for the Rad21-degron line (Extended Data Fig. 3a–c). We also generated the OsTir1-expressing lines from the same parental line and verified constitutive expression of OsTir1-V5 protein (Extended Data Fig. 3d).
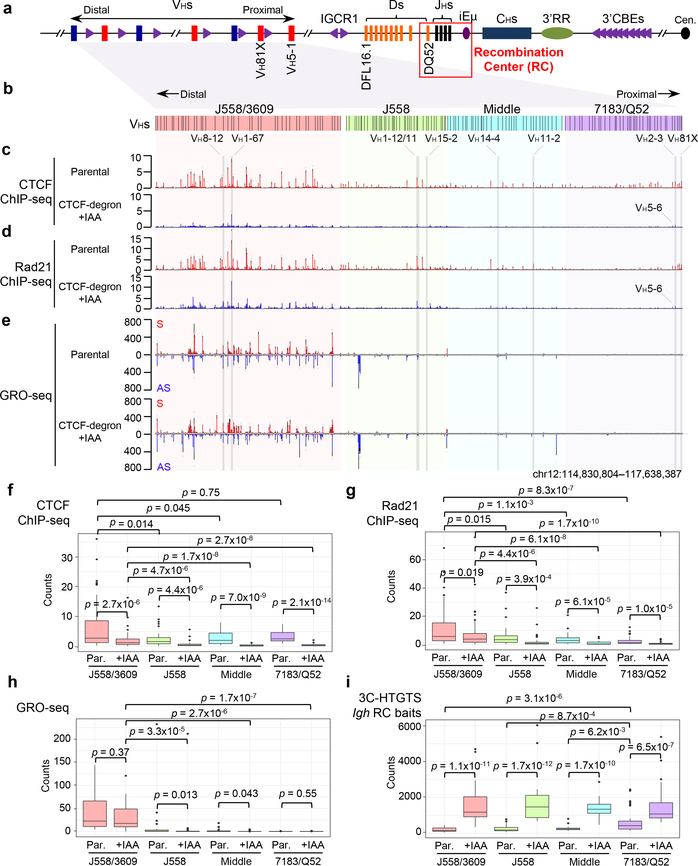
Fig. 2 |. Characterization of chromatin CTCF/Rad21-binding and transcription across the VH locus in G1-arrested parental and IAA-treated CTCF-degron cells.
a, Schematic of the entire murine Igh locus with details as shown in Fig. 1a. b, The four VH domains are highlighted different colors which are maintained in related figures. c-e, Average signal counts ± s.e.m. of CTCF (c) and Rad21 (d) ChIP-seq and GRO-seq (e) from three biologically independent experiments across the four highlighted VH domains in G1-arrested parental and IAA-treated CTCF-degron cells are plotted. S/AS: sense/anti-sense transcription. See Extended Data Fig. 4a,b and 5a for the plots across other parts of Igh locus. VHs for comparisons in Fig. 3 are highlighted. f-i, Box-and-Whisker plots are presented with median, upper and lower quartiles and whiskers showing 1.5x interquartile range for CTCF (f) and Rad21 (g) ChIP-seq, GRO-seq (h), and 3C-HTGTS (i) signal counts within indicated VH domains in G1-arrested parental (“Par.”) and IAA-treated CTCF-degron cells. n=3 biological repeats with similar results for each condition in f-i. p values were calculated using two-sided Mann-Whitney U test. See Methods for details. Comparison of panels (f) and (h) reveals that residual CTCF binding levels are significantly higher in the highly transcribed distal VH domain than those of the proximal domains with less overall transcription, which might reflect known roles of transcription in CTCF chromatin binding33,34.
IAA treatment of CTCF-degron cells led to substantial depletion of mAID-GFP-tagged CTCF within 6 hours and throughout the course of the subsequent 4-day G1 arrest (Extended data Fig. 3e). Treatment with STI-571 induced normal G1 arrest of both NT and IAA-treated CTCF-degron cells (Extended Data Fig. 3f). Western blotting with an anti-CTCF antibody on nuclear extracts revealed that endogenous CTCF levels were indistinguishable between G1-arrested parental and OsTir1-expressing lines, under either NT or IAA-treated conditions (Extended Data Fig. 3g). Levels of tagged CTCF protein, with or without IAA treatment, were modestly reduced in the G1-arrested CTCF-tagged line compared to those of G1-arrested parental cells (Extended Data Fig. 3g). In the NT G1-arrested CTCF-degron line, tagged CTCF was barely detectable and IAA treatment further reduced tagged CTCF to undetectable levels (Extended Data Fig. 3g). CTCF-tagged and CTCF-degron line findings were confirmed by western blotting with an anti-GFP antibody (Extended Data Fig. 3g). These findings suggest that the NT CTCF-degron line has a leaky phenotype for CTCF-degradation, as noted for other CTCF-degron lines12,13. To simplify presentation, we first present results obtained from parental lines and derivative IAA-treated CTCF-degron lines.
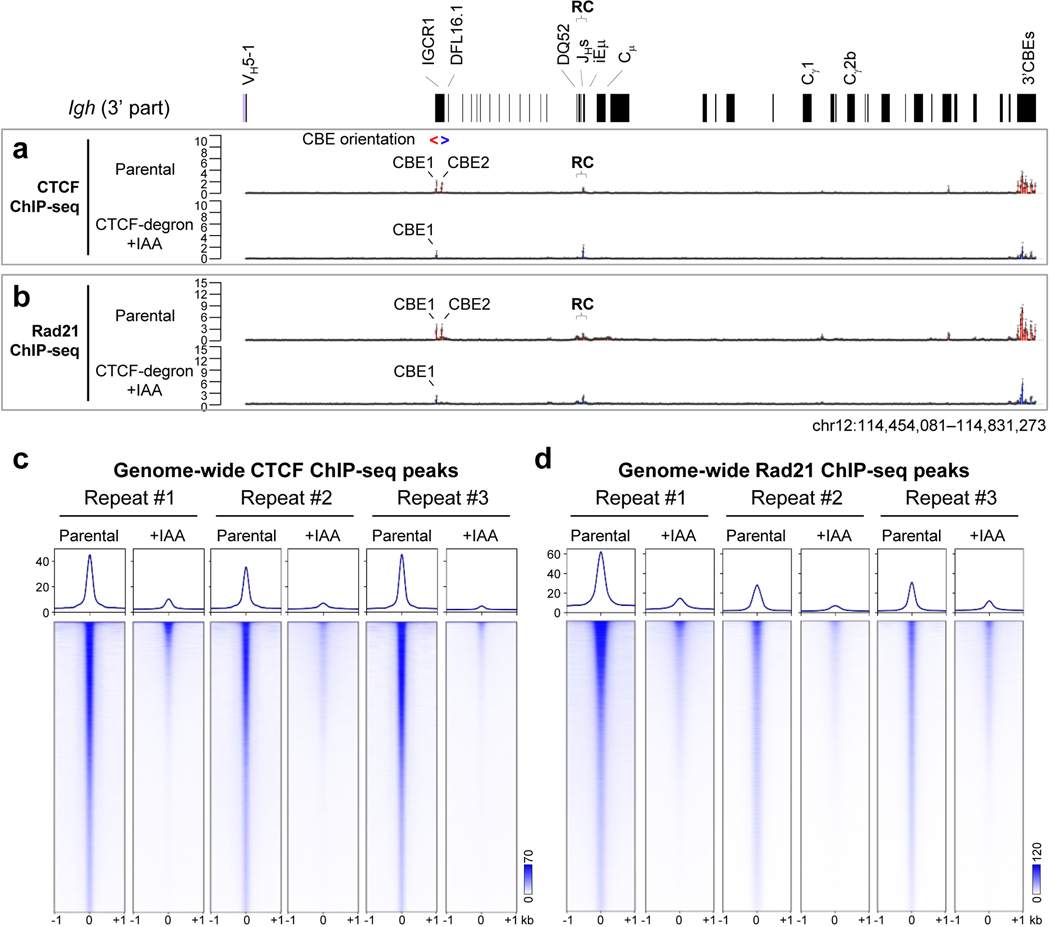
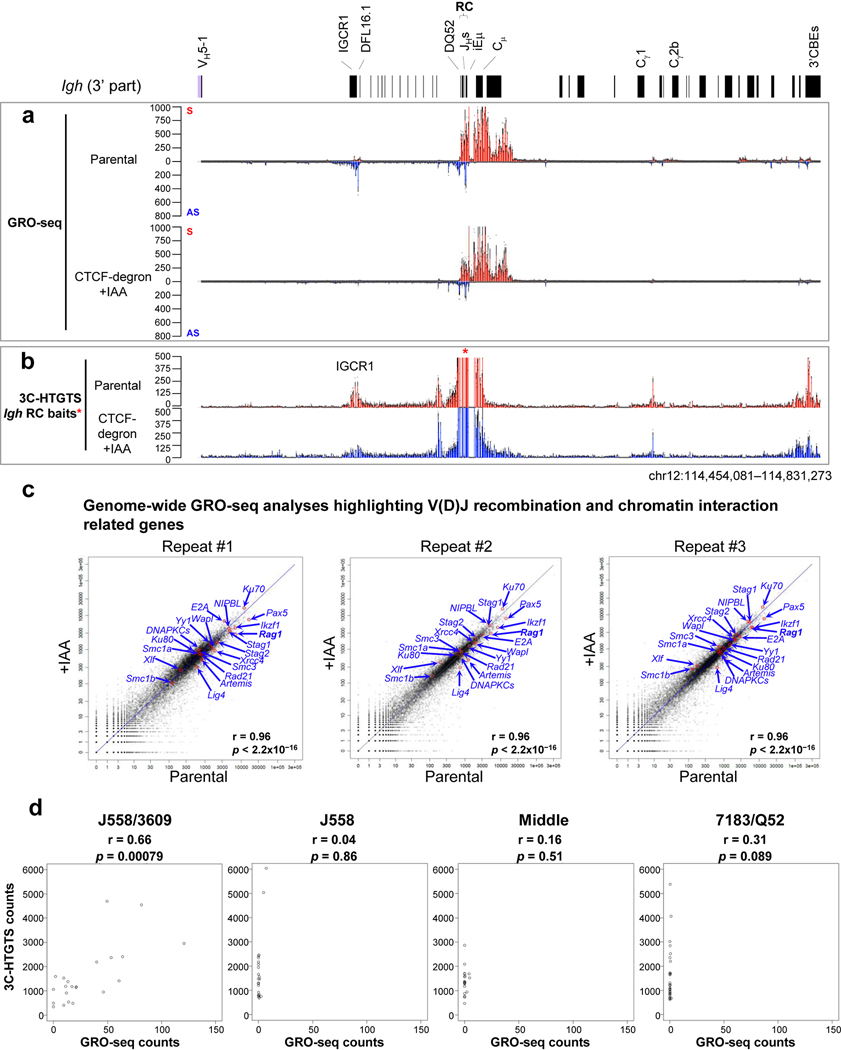
Reduction of mAID-GFP-tagged CTCF to undetectable levels in nuclear extracts of IAA-treated G1-arrested CTCF-degron cells modestly decreased viability to approximately 55% that of parental cells over the 4-day experimental course (Extended Data Fig. 3h). ChIP-seq for CTCF- and Rad21-binding across Igh of G1-arrested parental cells showed a high density of co-localized CTCF and Rad21 peaks throughout the VH locus (Fig. 2c,d, Extended Data Fig. 3a,b), as observed in primary pro-B cells23,25. IAA-treated CTCF-degron cells had greatly diminished CTCF occupancy across Igh and genome-wide; but, as for other CTCF-depleted cells25,27 also had residual binding at some CBEs both in the VH domain, particularly the distal J558/3609 domain, and genome-wide (Fig. 2c,f, Extended Data Fig. 3a,c; see below). The uneven depletion of CTCF at various CBEs may reflect differential intrinsic CTCF-binding affinity, local chromatin context and/or other factors27–29 (See Fig. 2 legend and Extended Data Fig. 3). Upon CTCF depletion, Rad21 occupancy throughout Igh was also greatly diminished, with residual binding sites and levels largely reflecting those of CTCF (Fig. 2d,g, Extended Data Fig. 3b,d). GRO-seq confirmed that transcription of the RC, RAG1, and distal VHs, predominately those in the J558/3609 domain, occurred similarly in parental and IAA-treated CTCF-degron lines (Fig. 2e,h, Extended Data Fig. 5a,c), predicting an intact RC, V(D)J recombination, and potential accessibility of distal VHs. 3C-HTGTS from three independent RC-based baits on G1-arrested parental cells reproducibly confirmed very low-level or lack of interaction with all but the very most proximal VH-containing sequences (Fig. 3a, top panel, Fig. 2i, Extended Data Fig. 5b). Remarkably, in IAA-treated CTCF-degron cells, the RC reproducibly gained robust interactions with sequences across the entire VH locus (Fig. 2i). Moreover, RC interaction patterns across the VH domains in IAA-treated CTCF-degron cells were significantly similar to those in “locus-contracted” bone marrow (BM) pro-B cells (Fig. 3a). Low-level RC interactions across the parental cell VH locus had a related pattern (see Fig. 3a legend).
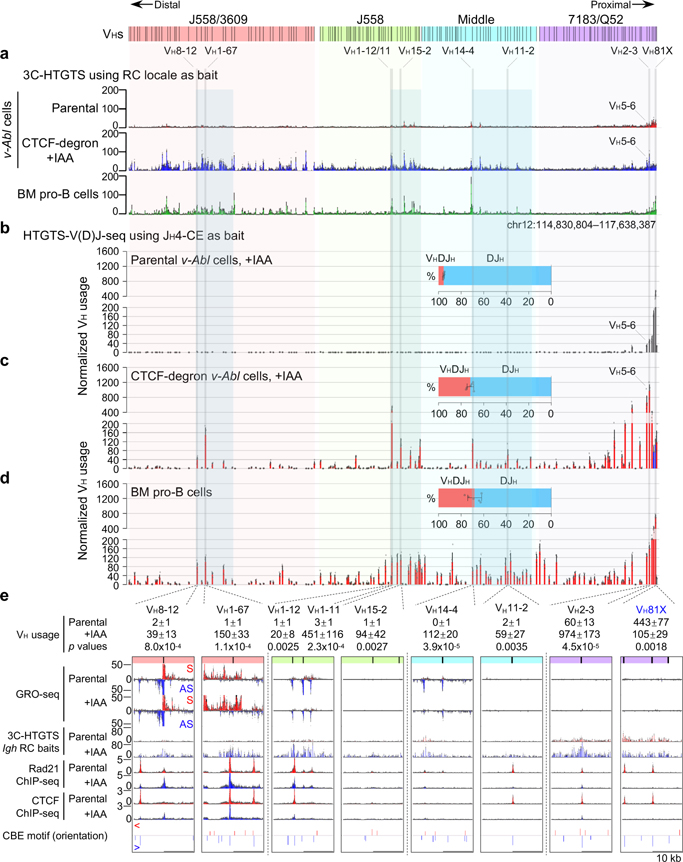
Fig. 3 |. CTCF depletion activates Igh RC interactions with the VH locus and robust VH-to-DJH joining of distal VHs.
a, Average 3C-HTGTS signal counts ± s.e.m. across the four VH domains in G1-arrested parental (top, n=3) and IAA-treated CTCF-degron (middle, n=3) v-Abl cells and RAG2-deficient mouse BM pro-B cells (bottom, n=2). In all panels, “n” indicates biological repeats. Spearman’s correlation coefficient (r) and p values determined by two-sided Spearman’s correlation test between data in middle and bottom panels are: r=0.86, p<2.2×10⁻¹⁶. Related low-level RC interactions across the parental cell VH locus and those of BM pro-B cells (r=0.63) and IAA-treated CTCF-degron cells (r=0.74) suggest low-level Igh loop extrusion in parental cells. b-d, Average VH utilization frequencies ± s.d. in RAG2-complemented, IAA-treated and G1-arrested parental (b, n=4), CTCF-degron (c, n=6) v-Abl cells and BM pro-B cells (d, n=6). Average percentage ± s.d. of VHDJH and DJH rearrangements are indicated. Spearman’s correlation coefficient (r) and p values by two-sided Spearman’s correlation test between data in panels c and d are r=0.76, p<2.2×10⁻¹⁶. See Extended Data Fig. 6 and Supplementary Table 3. e, Average utilization frequencies ± s.d. of indicated VHs in RAG2-complemented, G1-arrested parental (n=4) and IAA-treated CTCF-degron (n=6) v-Abl cells. Zoom-in profiles of indicated assays (mean ± s.e.m) for ±10kb regions of indicated VHs in G1-arrested parental (n=3 for each assay) and IAA-treated CTCF-degron (n=3 for each assay) lines along with putative CBE motif and orientation are presented. High-level signals for some VHs are off-scale on the y-axis for viewing low-level VH signals. See Fig. 2, 3 for on-scale profiles. Other details are in Extended Data Fig. 4a and 5a. p values were calculated using unpaired two-tailed t-test. VHs with decreased utilization upon substantial CTCF depletion are marked in blue. Detailed data for all VHs are shown in Supplementary Data.
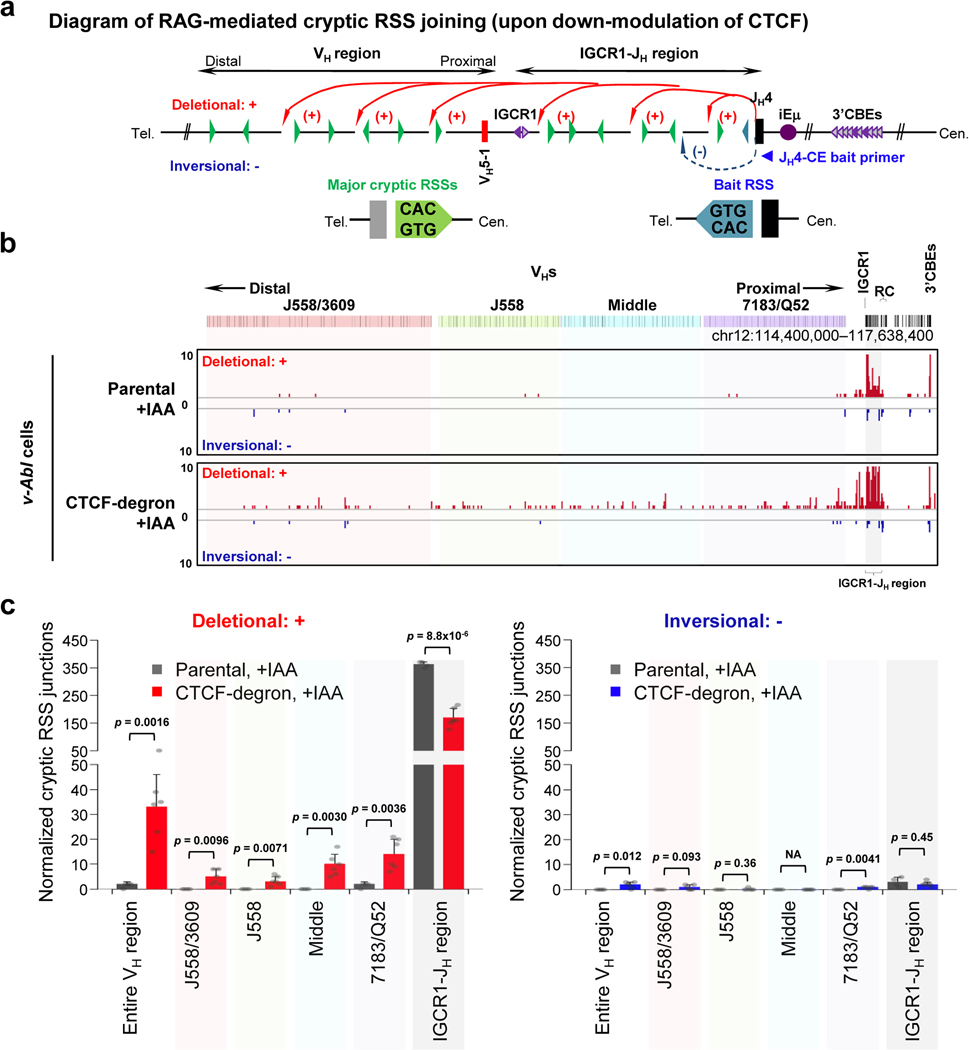
We introduced RAG2 into G1-arrested parental and CTCF-degron lines without or with IAA treatment and applied HTGTS-V(D)J-seq to assess Igh V(D)J recombination. IAA-treatment did not impact V(D)J recombination in parental lines, which rearranged only the several most proximal VHs (Fig. 3b, Extended Data Fig. 6a,b, Supplementary Table 3). However, while IAA-treated CTCF-degron lines had modest changes in D usage (Supplementary Table 3), they had significant, often dramatic, increases in utilization of most VHs across the VH locus (Fig. 3c, Supplementary Table 3). Moreover, compared to BM pro-B cells, IAA-treated CTCF-degron lines gained comparable levels of some distal VH rearrangements and had overall VH rearrangement patterns that were significantly similar (Fig. 3c,d, Supplementary Table 3). The ratio of VHDJH to DJH rearrangements in IAA-treated CTCF-degron cells also approached that of BM pro-B cells, indicating a greatly increased overall level of VH-to-DJH joining (Fig. 3b–d). Additional studies to confirm the role of linear scanning in distal VH utilization in IAA-treated CTCF-degron cells were based on the finding that during scanning from ectopic RCs in non-antigen receptor loci, RAG can recognize abundant cryptic RSS along the scanning path when they are in convergent orientation with initiating bona fide RC-RSS4. In IAA-treated CTCF-degron cells, RAG indeed utilized cryptic RAG off-targets across the VH locus when in convergent, but not in the same, orientation with the initiating RC-RSS (Extended Data Fig. 7), further supporting linear RAG scanning across the VH locus in IAA-treated CTCF-degron cells.
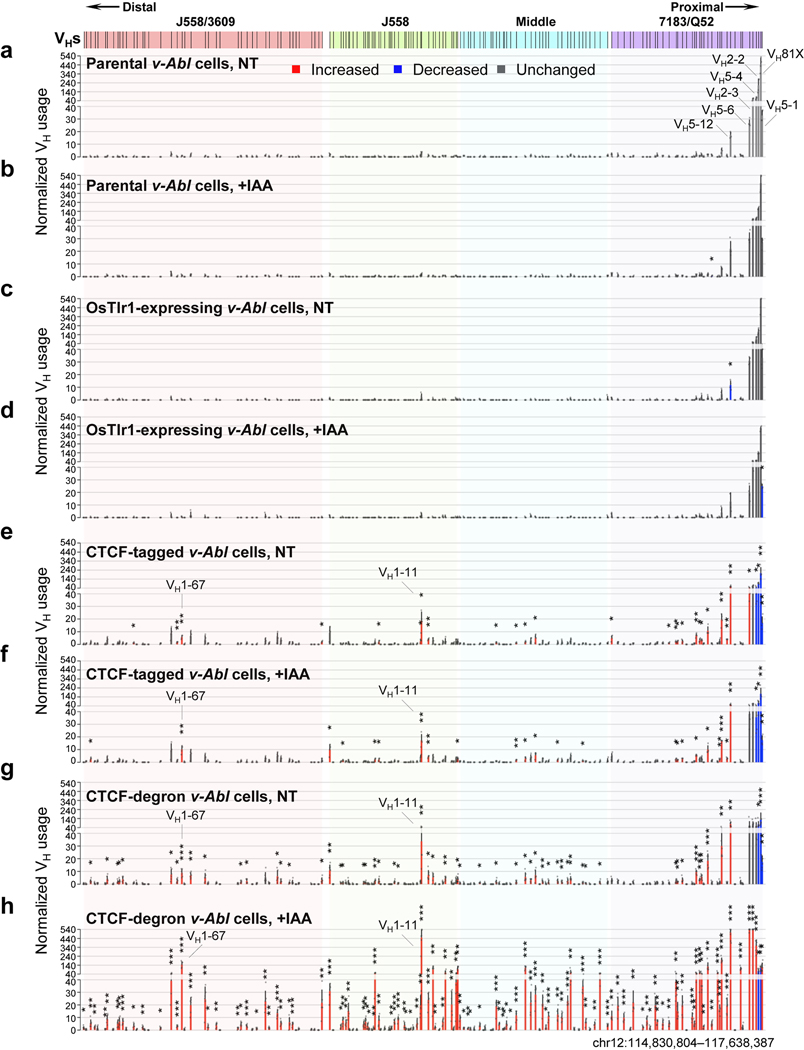
To characterize potential effects of CTCF tagging in the CTCF-tagged line or leaky CTCF degradation in the NT CTCF-degron line (Extended Data Fig. 3g), we compared VH-utilization patterns via HTGTS-V(D)J-seq in G1-arrested parental, OsTir1-expressing, CTCF-tagged, and CTCF-degron lines, without or with IAA treatment, after RAG2 introduction (Extended Data Fig. 6, Supplementary Table 3). These studies showed that IAA treatment and/or expression of OsTir1 per se had little impact on V(D)J recombination patterns in parental lines (Extended Data Fig. 6a–d, Supplementary Table 3). However, the CTCF-tagged lines showed low, but significantly increased, levels of VH rearrangements across the VH locus except for the very proximal VHs that had decreased levels (Extended Data Fig. 6e,f, Supplementary Table 3). The NT CTCF-degron lines had a very similar pattern of rearrangements across the VH locus to that of CTCF-tagged lines, albeit slightly more robust (Extended Data Fig. 6g, Supplementary Table 3). The average levels of rearrangements in the CTCF-tagged and NT CTCF-degron lines, while significantly increased over those of parental lines, were, on average, nearly 10-fold less than those of IAA-treated CTCF-degron lines (Extended data Fig. 6h, Supplementary Table 3). The CTCF-tagged line findings indicate that modest reduction in CTCF levels and/or impact of the mAID-GFP tag on CTCF function leads to increased levels of RAG scanning across the VH locus. The NT CTCF-degron line findings indicate that, while substantial reductions in CTCF levels have a positive impact on RAG scanning across the VH locus, further reduced levels associated with IAA-treatment are required to promote more robust scanning.
GRO-seq revealed that proximal 7183/Q52 domain VHs are barely transcribed in G1-arrested parental and IAA-treated CTCF-degron lines (Fig. 2e,h,3e, Supplementary Data). Rearrangement of the most proximal VHs in this domain is enhanced during scanning by RSS-associated CBE-mediated interactions with the RC5. In IAA-treated CTCF-degron lines, proximal VH rearrangement and interaction patterns often were altered in correspondence to residual CTCF-binding at their associated CBEs. For example, compared to parental cells, IAA-treated CTCF-degron cells had diminished RC interactions with VH81X- and VH2–2-associated CBEs and increased interactions with proximal VH2–3 and VH5–6 CBEs (Fig. 3a,e, Supplementary Data). Correspondingly, VH81X and VH2–2 utilization decreased and VH2–3 and VH5–6 utilization increased relative to utilization in parental cells (Fig. 3b,c,e, Supplementary Table 3 and Data). In contrast, the distal J558/3609 VHs are all highly transcribed in parental and IAA-treated CTCF-degron cells (Fig. 2e,h,3e, Supplementary Data). In IAA-treated CTCF-degron lines, many, but not all, transcriptionally active distal VHs gained robust chromatin interactions with the RC and greatly increased rearrangement levels (Fig. 3, Supplementary Table 3 and Data). While transcription and chromatin interactions with the RC do not correlate significantly in more proximal domains, they correlate significantly in the J558/3609 domain in IAA-treated CTCF-degron lines (Extended Data Fig. 5d). However, VH usage cannot be directly compared with transcription and chromatin interactions as the former must be done in RAG-sufficient cells and the latter in RAG-deficient cells. While all J558/3609 VHs are transcribed, only a subset are highly utilized (Fig. 3e, Supplementary Data). In this context, multiple highly rearranging J558/3609 VHs have nearby residual CTCF-bound CBEs (Fig. 3e, Supplementary Data) that may complement transcription in promoting RC interactions and rearrangement during scanning. Finally, the J558 and middle VHs cannot be as well-categorized as upstream and downstream counterparts, as within these domains some rearranged VHs are associated with transcription and/or residual CTCF-bound CBEs and others with neither (Fig. 3e, Supplementary Data).
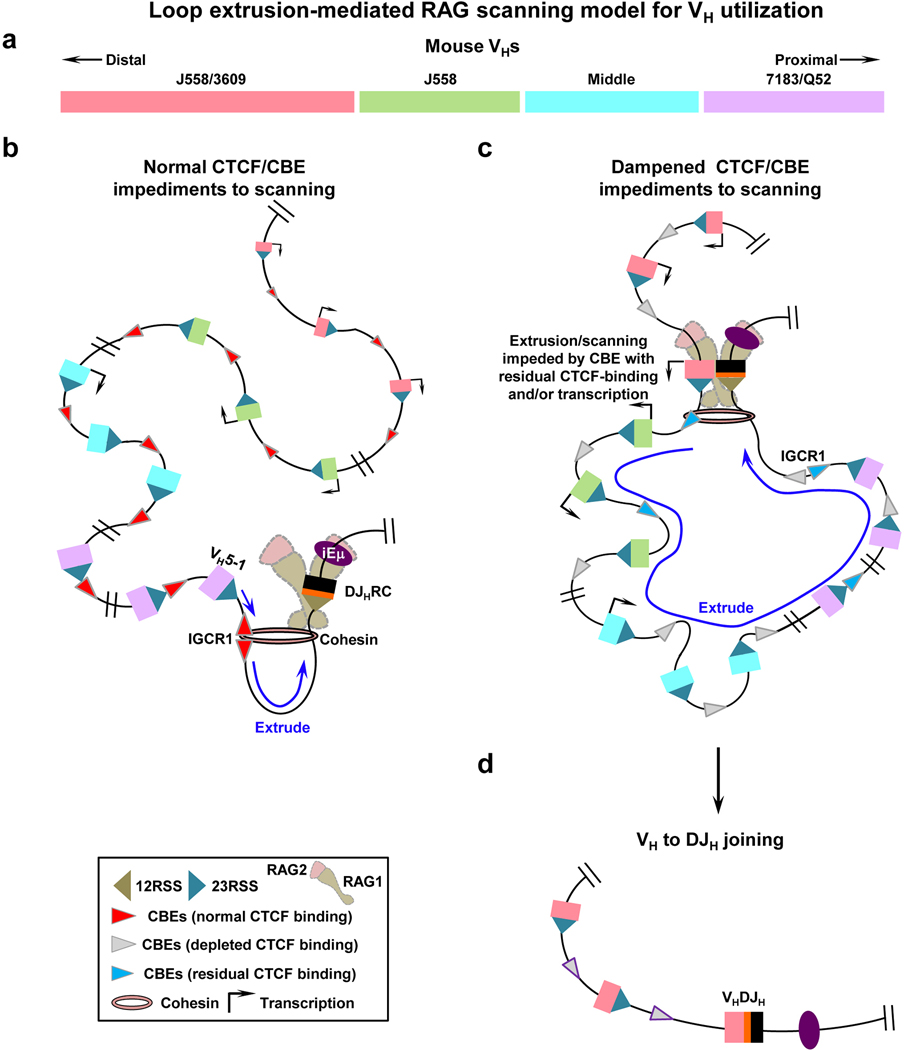
We implicate cohesin-mediated loop extrusion as a driver in moving chromatin past RC-bound RAG for Igh V(D)J recombinational scanning. RAG scanning can progress across the entire VH locus upon down-modulation of CTCF/CBE impediment activity, in many cases allowing other local scanning impediments, including residual CTCF-bound CBEs, to mediate increased access to particular VHs (Extended Data Fig. 8 model). Similar VH utilization and, separately, RC interaction patterns across the VH locus of IAA-treated CTCF-degron lines and primary pro-B cells suggests related mechanisms. While CTCF depletion provides proof-of-principle that RAG scanning can access distal VHs, physiological modulation of such scanning activity in BM pro-B cells might involve mechanisms that modulate CTCF/CBE impediments30–34 and/or circumvent impediments by modulating cohesin activity12,16,35–37. Our findings are consistent with Igh locus contraction in normal pro-B cells and long-range RAG scanning in CTCF-depleted v-Abl cells being inter-related processes. In this regard, depletion of Pax5 or YY1 transcription factors in BM pro-B cells eliminates Igh locus contraction38–41, including long-range interactions and distal VH utilization. As these two factors interact with CTCF41,42 and CTCF has been implicated in locus contraction25,43, it is of interest to determine their roles in long-range RAG scanning in CTCF-depleted v-Abl cells. RAG scanning impediments and downstream VH rearrangements could lessen levels of RAG scanning that reach more distal VHs in a scanning path. Such factors may have influenced evolutionary selection for different mechanisms that promote VH utilization in the distal, middle, and proximal parts of the locus. RAG scanning may be similarly regulated in other antigen receptor loci44–46.
METHODS
Experimental procedures
No statistical methods were used to predetermine sample size. Experiments were not randomized and the investigators were not blinded to allocation during experiments and outcome assessment.
Mice
Wild-type (WT) 129SV mice were purchased from Charles River Laboratories. RAG2-deficient mice in 129SV background were generated50 and maintained in the Alt laboratory. The RAG2−/−; Eμ-Bcl2+ mice were generated by breeding RAG2-deficient mice with Eμ-Bcl2 transgenic mice51 that had been backcrossed to the 129SV background. All procedures were performed in compliance with all the relevant ethical regulations established by the Institutional Animal Care and Use Committee (IACUC) of Boston Children’s Hospital and under protocols approved by the IACUC of Boston Children’s Hospital.
Bone marrow (BM) pro-B cell purification
B220+CD43+IgM− pro-B cells were purified via FACS sorting from BMs of 4~6 weeks old WT 129SV mice (male and female) as described5,22. B220-positive BM pro-B cells were purified via anti-B220 biotin/streptavidin beads (Miltenyi, #130–049-501) from 4~6 weeks old RAG2-deficient mice (male and female) and were cultured in opti-MEM medium containing 10% (v/v) FBS plus IL-7/SCF for 4 days as described4.
Cell lines
The v-Abl-kinase-transformed pro-B lines were derived by retroviral infection of BM pro-B cells derived from RAG2−/−; Eμ-Bcl2+ mice as described9. Infected cells were cultured in RPMI medium containing 15% (v/v) FBS for three months to obtain stably transformed v-Abl lines. The initial “parental” RAG2−/−; Eμ-Bcl2+ line used for subsequent studies was further targeted by a Cas9/sgRNA approach52 to randomly introduce 1~4 bp indels into a site ~90 bp downstream of JH4-RSS-heptamer and ~10 bp upstream of JH4-CE bait primer on both alleles. The Igh allele-specific barcode permits the separation of sequenced reads amplified from each allele with an identical bait primer from the same HTGT-V(D)J-seq libraries, thus, permitting in parallel examination of V(D)J recombination events that occur on each allele under the same cellular context. HTGTS-V(D)J-seq analyses on RAG2-complemented above-mentioned Igh-barcoded v-Abl cells confirmed very comparable V(D)J rearrangement patterns and frequencies between both alleles, which were also very similar with germline Igh alleles in the RAG2−/−; Eμ-Bcl2+ cells form which they were derived. Thus, in this study the barcoded alleles were specifically used to generate the data for IGCR1+/− Rad21-degron lines shown in Fig. 1e. The human colorectal carcinoma line HCT116 was purchased from American Type Culture Collection (ATCC, #CCL-247) and cultured in McCoy’s 5A medium (ThermoFisher Scientific, #16600082) containing 10% (v/v) FBS.
Generation of Rad21-degron and CTCF-degron v-Abl pro-B lines and their derivatives
The targeting constructs used for introducing the in-frame mAID sequences into mouse endogenous Ctcf locus (pEN84, Addgene #86230) and introducing the OsTir1-V5 expression cassette into endogenous Rosa26 locus (pEN114, Addgene #92143) were described previously13. Using a similar strategy, we generated the targeting construct for introducing the in-frame mAID sequences into endogenous Rad21 locus. Briefly, the 5’ and 3’ homology arms (1.5 kb each) flanking Rad21 gene stop codon were PCR amplified from RAG2−/−; Eμ-Bcl2+ cell genomic DNA (gDNA). The mAID-Clover cassette was amplified from the plasmid pMK290 (Addgene, #72828). These fragments and a puro selection cassette amplified from pEN84 were assembled in an order diagramed in Extended Data Fig. 1b using Gibson assembly kit (NEB, #E2611S). To promote targeting efficiency, Cas9/sgRNAs were cloned by annealing pairs of oligos into pX330 (Addgene, #42230)52. The parental RAG2−/−; Eμ-Bcl2+ cells were nucleofected with Rad21- or CTCF-targeting donors and their corresponding Cas9/sgRNAs via Lonza 4D Nucleofector as described4,5, selected with 1 μg/ml Puromycin (Gibco, #A1113802) for 4 days, and subcloned by dilution. Candidate clones with desired gene modifications were screened by PCR and confirmed by southern blotting as outlined in Extended Data Fig. 1b and 3b. The confirmed clones were further processed to remove the puromycin selection cassette as described13. Similarly, the resultant clones were further targeted to introduce the OsTir1-V5 expression cassette into both Rosa26 alleles, followed by removal of the puromycin selection cassette as outlined in Extended Data Fig. 1c. The resulting lines were referred to as the Rad21-degron or CTCF-degron lines and used in this study. To delete IGCR1, the Rad21-degron line was targeted with Cas9/sgRNAs as described4,5. Sequences of all sgRNAs and oligos used are listed in Supplementary Table 4.
Treatment of Rad21-degron and CTCF-degron lines with IAA
To deplete mAID-tagged Rad21 or CTCF protein in Rad21-degron or CTCF-degron cells, the auxin analog, Indole-3-acetic acid (IAA, Sigma-Aldrich, #I3750–25G-A), was added in the medium at 500 μM from a 1000X stock that were prepared by dissolving IAA with DMSO. DMSO solvent was applied as the mock to non-treated (NT) cells. After 6 hours, the depletion efficiency of mAID-tagged proteins in IAA-treated cells compared to non-treated cells was examined by FACS. Both NT and IAA-treated cells were then treated by 3 μM STI-571 without or with IAA for 4 days to induce G1 arrest as described2,4,5. The cells were then collected and examined by FACS and western blotting for protein depletion confirmation prior to various assays as described below.
Cell viability assay
For time-course cell viability assay, the parental, Rad21-degron and CTCF-degron cells were non-treated or treated with IAA for 6 hours and then subject to STI-571 treatment (set as 0 h). The viability of NT and +IAA cells at the following 4 days was determined by the percentage of viable lymphocyte population gated by FACS side (SSC) and forward (FSC) scatters out of the total cells. Average percentage ± s.d. of viable cells for each timepoint and for each condition was calculated from >3 biologically independent experiments and was normalized to the number of NT cells at 0 hours, which was set to 100%.
G1 cell cycle analysis
For cell cycle analysis, the fluorescent, ubiquitination-based cell cycle indicator (Fucci)53 cassette (pEN435, Addgene #92139) was stably introduced into the Rad21-degron and CTCF-degron lines following the strategy as described13. The parental cells without Fucci cassette, Rad21-degron and CTCF-degron cells with Fucci cassette were non-treated or treated with IAA for 6 hours followed by STI-571 treatment (set as 0 h). The distribution of cells at G1 cell cycle stage (mCherry-hCdt1+; TagBFP-hGeminin−) at day 4 was determined by FACS using the parental cells without Fucci cassette as the gating control. Average percentage ± s.d. of cells arrested in G1 stage for each condition was calculated from >3 biologically independent experiments. The data are shown in Extended Data Fig. 1f, 3f.
Western blotting
For western blot, equal amounts of live cells that were non-treated or treated with IAA for 6 hours and then subject to STI-571 treatment for 4-days were collected and processed for chromatin fractionation. In brief, cells were lysed in Buffer 1 (100 mM NaCl, 300 mM sucrose, 3 mM MgCl2, 10 mM PIPES, pH 6.8, 1 mM EGTA, and 0.2% Triton X-100) containing 1x protease cocktail inhibitors (Roche, #11836170001) and incubated on-ice for 5 min. After centrifugation, the pellet was gently washed three times in Buffer 1, resuspended in Buffer 2 (50 mM Tris-HCl, pH 7.5, 150 mM NaCl, 5 mM EDTA, 1% Triton X-100, and 0.1% SDS) containing protease cocktail inhibitors, and then sonicated. Nuclear extracts were resolved on 10–12% (v/v) SDS-PAGE. Immunoblotting was performed according to standard procedures with antibodies as follows: Rad21 (Abcam, #ab992), CTCF (Millipore, #07–729), V5 (Invitrogen, #R960–25), Histone H3 (Abcam, #ab176842), GFP (Takara Bio Inc., #632380) and RAG254.
HTGTS-V(D)J-seq
For Igh V(D)J recombination analyses on various RAG2-deficient v-Abl lines used in this study, we firstly introduced RAG2 into these lines via the approach previously described2. HTGTS-V(D)J-seq libraries were prepared as described2,5,22,55. Briefly, 2 μg of gDNA from sorted mouse BM pro-B cells or 30 μg of gDNA from G1-arrested RAG2-complemented parental, Rad21-degron and CTCF-degron cells and their related control lines, without or with IAA treatment, was sonicated and subjected to LAM-PCR using biotinylated JH4-CE bait primer5. Single-stranded LAM-PCR products were purified using Dynabeads MyONE C1 streptavidin beads (Life Technologies, #65002) and ligated to bridge adaptors. Adaptor-ligated products were amplified by nested PCR with indexed JH4 primers and the primer annealed to the adaptor. The PCR products were further tagged with Illumina sequencing adaptor sequences, size-selected via gel extraction and loaded onto an Illumina MiSeq machine for paired-end 250-bp or 300-bp sequencing. Primer sequences are listed in Supplementary Table 4.
HTGTS-V(D)J-seq data processing and analyses
HTGTS-V(D)J-seq libraries were processed via our previously described pipeline described55. Raw reads were aligned to AJ851868/mm9 hybrid genome that was generated by combining all of the annotated Igh sequences of 129SV background (AJ851868) and the distal VH sequences from the C57BL/6 background (mm9) starting from VH8–2 as previously described5,22,41.
As the V(D)J junctions were greatly diminished in IAA-treated Rad21-degron cells, we normalized the data for Rad21 depletion experiments to the total aligned reads, which include all bait primer-containing sequencing reads that contain germline Igh sequences or V(D)J junctions for statistical analyses following the strategy described previously4,5. In this regard, the data from G1-arrested Rad21-degron cells with or without IAA treatment were normalized to 110,000 total aligned reads. Based on the junction information file generated by the HTGTS pipeline, DJH and VHDJH joins were separated and D usage from DJH joins was directly extracted. D usage from VHDJH joins was analyzed via the VDJ_annotation pipeline with details stated in “Code availability”. To determine which Igh allele harbors IGCR1 deletion in the IGCR1+/− Rad21-degron cells, we developed and applied an allele-specific assay based on the examination of Cas9/sgRNA-induced translocations via LAM-HTGTS4,56. Briefly, we introduced the bait and prey Cas9/sgRNAs that, respectively, target a site located between JH4-RSS-heptamer and Igh-allele-specific barcodes and IGCR1 locale into the IGCR1+/− Rad21-degron cells, extracted DNA 3 days post nucleofection, and performed LAM-HTGTS using JH4-CE bait primer. The bait-prey site translocation junctions derived from each allele were separated via the barcodes, and the junction numbers that fall into bait and prey regions on each allele were counted. The relative numbers of prey junctions within IGCR1 locale indicate the presence or absence of IGCR1 on the allele, which was further confirmed by HTGTS-V(D)J-seq analyses based on increased rearrangements of proximal VHs upon IGCR1 deletion4,5.
For statistical analyses, utilization data of VH and D segments in RAG2-complemented and G1-arrested parental, OsTir1-expressing, CTCF-tagged, and CTCF-degron cells without or with IAA treatment were normalized to 20,000 total recovered junctions as described5. For comparison to v-Abl lines, utilization data of VH and D segments in BM pro-B cells were also normalized to 20,000 total recovered junctions. We also re-analyzed the V(D)J recombination data obtained from 129SV BM pro-B cells as described22 and compared them with the newly generated data following the same normalization approach, which showed essentially same VH and D utilization patterns and, thus both data sets were included in our current analyses. Only VHs that contain putatively functional RSSs and undergo V(D)J recombination at detectable frequency (VH usage >= 1 after normalization) in each of the multiple biological repeats of HTGTS-V(D)J-seq libraries for either IAA-treated CTCF-degron cells or BM pro-B cells were analyzed and presented in related figures and the Supplementary Tables. Depending on the average utilization after normalization in IAA-treated CTCF-degron cells, these VHs are further categorized into two subgroups: highly-utilized VHs (VH usage >= 3) and less frequently utilized VHs (VH usage < 3). Analyses of cryptic RSS deletional and inversional rearrangements were performed as previously described2,4 with other details in the Extended Data Fig. 7 legend.
3C-HTGTS and data analyses
For 3C-HTGTS library preparation, 10 million of short-term cultured RAG2-deficient BM pro-B cells, G1-arrested parental, Rad21-degron and CTCF-degron v-Abl cells, without or with IAA treatment, were collected and processed following the same protocol as previously described5. The 4-bp cutter NlaIII (NEB, #R0125) was used in this study. 3C-HTGTS libraries were sequenced via Illumina NextSeq550 using paired-end 150-bp sequencing kit or Miseq using paired-end 300-bp sequencing kit. Sequencing reads were processed and aligned to AJ851868/mm9 hybrid genome as described above. Data were plotted for comparison after normalizing junction from each 3C-HTGTS library by random selection to the total number of chr12-wide junctions recovered from the smallest library in the set of comparing libraries. For G1-arrested Rad21-degron cells with and without IAA treatment, 3C-HTGTS libraries using iEμ and VH81X-CBE (Fig. 1c, Extended Data Fig. 2a,b) as bait were normalized to 74,339 and 9,844 total junctions from chromosome 12, respectively. For G1-arrested IGCR1−/− Rad21-degron cells with and without IAA treatment, 3C-HTGTS libraries using iEμ as bait (Extended Data Fig. 2f) were normalized to 74,339 total junctions from chromosome 12. For G1-arrested parental and IAA-treated CTCF-degron cells and RAG2-deficient BM pro-B cells, 3C-HTGTS libraries using RC/iEμ, RC/DQ52-JH1, and RC/JH4 as bait were normalized to 333,127 total junctions from chromosome 12 (Fig. 3a, Extended Data Fig. 5b). Chromosomal interaction patterns were very comparable before and after normalization. 3C-HTGTS primer sequences are listed in Supplementary Table 4.
ChIP-seq
For ChIP-seq library preparation, 20 million of G1-arrested parental, Rad21-degron and CTCF-degron cells, without or with IAA treatment, were collected and processed following the same protocol as previously described2,21. Following the same procedure, fragmented chromatin from HCT116 cells were prepared and used as spike-in controls. Fragmented chromatin from G1-arrested cells with or without spike-in was precleared with 40 μl Dynabeads Protein A (Thermo Fisher Scientific, #10002D) and then incubated with Rad21 (Abcam, #ab992) or CTCF (Millipore, #07–729) antibody in cold room overnight, followed by incubating with 40 μl Protein A beads for 2 hours. The immunoprecipitated DNA fragments were washed, eluted, de-crosslinked and purified for library preparation. ChIP-seq libraries were prepared using NEBNext Ultra II DNA Library Prep Kit for Illumina (NEB, #E7645) and sequenced by paired-end 75-bp sequencing kit on Illumina NextSeq550.
ChIP-seq analysis
We used bowtie2 (v2.2.3) to align reads to reference genome, used MACS2 (v2.1.0) to obtain the IP peak signal tracks after normalized to 1 million IP reads. Rad21 ChIP-seq on Rad21-degron cells with and without IAA treatment were performed with human HTC116 chromatin as spike-in57. For Rad21 ChIP-seq on parental and IAA-treated CTCF-degron cells, one repeat was performed without human HCT116 chromatin as spike-in, and two repeats were performed with human HCT116 chromatin as a spike-in. Three repeats show highly reproducible results. For CTCF ChIP-seq on parental and IAA-treated CTCF-degron cells, all three repeats were performed without human HCT116 chromatin as spike-in. For ChIP-seq without human chromatin spike-in chromatin, reads were aligned to mouse AJ851868/mm9 hybrid genome and libraries were normalized to 1 million reads for display. For ChIP-seq with human spike-in chromatin, reads were aligned to the mixture genome of mouse (AJ851868/mm9) and human (hg19), and the mouse IP signal track was normalized to 1 million human IP reads, after adjusting the input spike-in chromatin ratio to be 1:1. To estimate and adjust for the actual spike-in chromatin ratio, we counted the number of reads aligned to human or mouse genome in the IP-corresponding input library, and calculated their ratio. We finally scaled the mouse IP signal track by multiplying its normalization factor = (1 million)/(human IP read number)/((mouse input read number)/(human input read number)) for display. For the samples that were processed with or without spike-in controls, we compared the results obtained with or without spike-in chromatin and found little difference between them. To examine the impact of substantial Rad21 or CTCF depletion on genome-wide chromatin binding, we used MACS2 (v2.1.0) to call peaks in NT Rad21-degron or parental cells, and then used deepTools58 (computeMatrix and plotHeatmap, v3.3.2) for heatmap plots (Extended Data Fig. 1h,4c,d).
GRO-seq and data analyses
For GRO-seq library preparation, 10 million of G1-arrested parental, Rad21-degron and CTCF-degron cells, without or with IAA treatment, were collected and processed following the same protocol as described previously2,21. The resultant GRO-seq libraries were sequenced by paired-end 75-bp sequencing kit on Illumina NextSeq550. We used bowtie2 to align GRO-seq sequencing reads to AJ851868/mm9 hybrid genome, and run MACS2 (v2.1.0) to generate bigwig graph. To visualize the genome-wide transcriptional activity, we run HTSeq-count59 (v0.10.0) to count read number on each gene, and made scatter plot after down-sampling each sample to 10 million reads mappable to any genes. Each experiment was repeated three times with biologically independent clones.
Quantification and statistical analysis
An unpaired, two-tailed t test was used to determine the statistical significance of VH or D utilization differences between samples (Fig. 1d,e, 3b–e, Extended Data Fig. 6, Supplementary Table 3). After normalization in each sample, GRO-seq, 3C-HTGTS, CTCF and Rad21 ChIP-seq signals of three repeats were merged as average ± s.e.m. (Fig. 2,3, Extended Data Fig. 4a,b, 5a,b, Supplementary Data). Quantification of GRO-seq and 3C-HTGTS was done by counting reads or junctions within 5kb of each highly-utilized VH (defined as normalized VH usage >= 3), and calculating average among three repeats. Quantification of ChIP-seq was done by counting reads within each CTCF peaks called by MACS2, and calculating average among three repeats. Two-sided Mann-Whitney U test was used for comparing the signal counts among conditions and VH domains (Fig. 2f–i). Spearman rank correlation was calculated between IAA-treated CTCF-degron v-Abl pro-B cells and BM pro-B cells for 3C-HTGTS signal counts (Fig. 3a) or VH usage (Fig. 3c,d), and also between 3C-HTGTS and GRO-seq signal counts (Extended Data Fig. 5d). Spearman’s correlation coefficient (r) and p values determined by two-sided Spearman’s correlation test are between indicated samples are presented in relevant figure legends. p values are calculated and shown in relevant figures and Supplementary Tables as follows: non-significant (NS): p > 0.05, *: p ≤ 0.05, **: p ≤ 0.01, and ***: p ≤ 0.001.
Data availability
HTGTS-V(D)J-seq, 3C-HTGTS, ChIP-seq, and GRO-seq sequencing data reported in this study have been deposited in the Gene Expression Omnibus (GEO) database under the accession number GSE142781.
Code availability
HTGTS-V(D)J-seq and 3C-HTGTS data were processed via the published pipeline (http://robinmeyers.github.io/transloc_pipeline/). D usage extraction from VHDJH joins was processed via a custom VDJ_annotation pipeline (https://github.com/Yyx2626/VDJ_annotation/).
Supplementary Material
Extended Data
Extended Data Fig. 1 |. Generation and characterization of Rad21-degron lines.
a, Diagram of the Rad21-degron. b, c, Left: Schematic of the targeting strategy for introducing in-frame mAID-Clover sequences into both mouse endogenous Rad21 alleles (b), and OsTir1-V5 expression cassette into both Rosa26 alleles (c). Positions of Cas9/sgRNAs and southern blotting probes are indicated. B: BglII; S: SspI. Right: Southern blotting confirmation of correctly targeted alleles as indicated (n=3 biologically independent repeats with similar results for each targeting). d, Representative Clover signal-based flow-cytometry plots for Rad21-degron cells that are non-treated (NT) or treated with IAA (+IAA) for 6h (top) followed by treatment with STI-571 (without or with IAA) for 4 days to induce G1 arrest (bottom). The parental cells were used as Clover negative controls. Three biological repeats with similar results. e, Time-course cell viability assay for Rad21-degron cells without (NT) or with (+IAA) IAA treatment following STI-571 treatment for G1-arrest (+STI). Average percentage ± s.d. of viable cells for each timepoint and under each condition was shown (n=4 biologically independent samples). p values were calculated using unpaired two-tailed t-test. f, Fucci cell cycle assay of Rad21-degron cells without (NT) or with (+IAA) IAA treatment followed by 4-day STI-571 treatment. Representative flow-cytometry plots and average percentage ± s.d. of cells arrested in G1-stage at indicated condition (n=3 biologically independent samples) are shown. The parental cells without Fucci were used as negative controls. g, Rad21 ChIP-seq profiles at indicated Igh locus in NT and IAA-treated G1-arrested Rad21-degron cells (n=2 biological repeats with similar results). h, Rad21 ChIP-seq signal within ±1kb region across all peaks genome-wide called in G1-arrested NT Rad21-degron cells (n=2 biological repeats with similar results). Top: Average enrichment. IAA treatment leads to a depletion of chromatin-bound Rad21 genome-wide. See Methods for details.
Extended Data Fig. 2 |. Effects of cohesin loss on Igh loop domains and transcription across Igh and genome-wide in G1-arrested Rad21-degron cells.
a, b, 3C-HTGTS chromatin interaction profiles of RC/iEμ bait (a, red asterisk) and VH81X-CBE bait (b, blue asterisk) at indicated Igh locus in NT and IAA-treated G1-arrested Rad21-degron cells. Three biologically independent repeats for each bait with similar results. c, Western blotting for Rad21 and RAG2 using histone H3 as a loading control on nuclear extracts of NT and IAA-treated G1-arrested Rad21-degron cells. Two biologically independent repeats with similar results. d, Scatter plots of transcriptome-wide GRO-seq counts in NT (x axis) and IAA-treated (y axis) G1-arrested Rad21-degron cells. Three biologically independent repeats with similar results. Representative known requisite genes for V(D)J recombination and chromatin interaction are highlighted by red circles and blue arrows. Spearman’s correlation coefficient (r) and p values determined by two-sided Spearman’s correlation test are presented. e, GRO-seq analyses of NT and IAA-treated G1-arrested Rad21-degron cells across the entire Igh locus as indicated. Three biologically independent repeats with similar results. S/AS: sense/anti-sense transcription. f, 3C-HTGTS chromatin interaction profiles of RC/iEμ bait (red asterisk) at indicated Igh locus in NT and IAA-treated G1-arrested IGCR1-deleted Rad21-degron cells. Two biologically independent repeats with similar results. See Methods for details.
Extended Data Fig. 3 |. Generation and characterization of CTCF-tagged, OsTir1-expressing and CTCF-degron lines.
a, Diagram of the CTCF-degron. b, Left: Targeting strategy for introducing in-frame mAID-GFP sequences into both Ctcf alleles. Cas9/sgRNAs and southern blotting probe are indicated. B: BglII. Right: Southern blotting confirmation of correctly targeted alleles (n=3 biological repeats with similar results). c, d, Southern blotting confirmation of correctly targeted Rosa26 alleles in CTCF-degron (c, n=3 biological repeats with similar results) and OsTir1-expressing (d, left, n=2 biological repeats with similar results) lines following OsTir1-V5 targeting strategy shown in Extended Data Fig. 1c. Western blotting on nuclear extracts of G1-arresed OsTir1-expressing cells with correctly targeted Rosa26 alleles confirms the constitutive expression of OsTir1-V5 protein (d, right, n=2 biological repeats with similar results). Histone H3 was used as a loading control. e, Representative GFP signal-based flow-cytometry plots for CTCF-degron cells that are non-treated (NT) or treated with IAA (+IAA) for 6h (top) followed by 4-day STI-571 treatment (without or with IAA) (bottom). The parental cells were used as GFP negative controls. Three biological repeats with similar results. f, Fucci cell cycle assay of CTCF-degron cells without (NT) or with IAA treatment followed by 4-day STI-571 treatment. Representative flow-cytometry plots and average percentage ± s.d. of cells arrested in G1-stage at indicated condition (n=3 biologically independent samples) are shown. The parental cells without Fucci were used as negative controls. g, Western blotting on nuclear extracts of G1-arrested cells as indicated using indicated antibodies (n=3 biological repeats with similar results). h, Time-course cell viability assay for parental and IAA-treated CTCF-degron cells, following STI-571 treatment for G1-arrest (+STI). Average percentage ± s.d. of viable cells for each timepoint and under each condition was shown (n=3 biologically independent samples). p values were calculated using unpaired two-tailed t-test. See Methods.
Extended Data Fig. 4 |. Characterization of chromatin CTCF/Rad21-binding across Igh downstream part and genome-wide in G1-arrested parental and IAA-treated CTCF-degron cells.
a, b, Average signal counts ± s.e.m. of CTCF (a) and Rad21 (b) ChIP-seq from three biologically independent experiments across 3’ part of Igh locus as diagramed at the top in G1-arrested parental and IAA-treated CTCF-degron cells are plotted. “<”/”>”: orientation of indicated CBEs. c, d, CTCF (c) and Rad21 (d) ChIP-seq signal across all peaks genome-wide called in G1-arrested parental cells. See Extended Data Fig. 1h legend for other details. Three biologically independent repeats with similar results. IAA-treated CTCF-degron cells had greatly diminished CTCF and Rad21 chromatin occupancy, but, also had residual binding at some CBEs genome-wide. See Methods for details. Notably, CTCF binding increased at the RC (Extended Data Fig. 4a) and at a subset transcribed VHs (Fig. 3e, Supplementary Data) upon CTCF depletion. While increases in apparent CTCF-binding to the non-CBE-containing RC and also transcribed VHs upon CTCF depletion could be considered surprising, it may likely occur indirectly due to cohesin-mediated loop extrusion-driven dynamic associations of the RC dynamic anchor with residual-CTCF-bound CBEs across Igh.
Extended Data Fig. 5 |. Characterization of transcription and RC chromatin interactions across Igh downstream part and transcription genome-wide in G1-arrested parental and IAA-treated CTCF-degron cells.
a, Average signal counts ± s.e.m. of GRO-seq from three biologically independent experiments across 3’ part of Igh locus as diagramed at the top in G1-arrested parental and IAA-treated CTCF-degron cells are plotted. S/AS: sense/anti-sense transcription. b, Average 3C-HTGTS signal counts ± s.e.m. from three independent experiments with RC-based baits (red asterisk) across 3’ part of Igh locus as diagramed at the top in G1-arrested parental and IAA-treated CTCF-degron cells are plotted. c, Scatter plots of transcriptome-wide GRO-seq counts in G1-arrested parental (x axis) and IAA-treated CTCF-degron (y axis) cells. Three biologically independent repeats with similar results. Representative known requisite genes for V(D)J recombination and chromatin interaction are highlighted by red circles and blue arrows. Spearman’s correlation coefficient (r) and p values determined by two-sided Spearman’s correlation test are presented. d, Scatter plots of normalized GRO-seq read counts (x axis) and 3C-HTGTS junction counts (y axis) calculated from regions within ±5kb of highly-utilized VHs across four indicated VH domains in IAA-treated CTCF-degron cells. Data were normalized and quantified among three biologically independent experiments for each assay. Spearman’s correlation coefficient (r) and p values determined by two-sided Spearman’s correlation test are presented. See Methods for details.
Extended Data Fig. 6 |. A positive impact of reduced CTCF levels on RAG scanning across the VH locus.
a-h, HTGTS-V(D)J-seq analysis showing average utilization frequencies ± s.d. of VH segments across four highlighted VH domains in RAG2-complemented and G1-arrested parental (a, b), OsTir1-expressing (c, d), CTCF-tagged (e, f), and CTCF-degron (g, h) cells without or with IAA treatment. n=4 (a-f) or n=6 (g, h) biologically independent repeats with similar results. Utilization of VHs presented in b-h are compared to those in NT parental cells shown in a, with red, blue, and grey bars indicating VHs with significantly increased, decreased, and unchanged utilization, respectively. To facilitate direct comparisons, the HTGTS-V(D)J-seq data for the IAA-treated parental and CTCF-degron cells shown in b and h are the same as those presented in Fig. 3b and c, respectively, with different y-axis scales. p values were calculated using unpaired two-tailed t-test (*: p ≤ 0.05, **: p ≤ 0.01, and ***: p ≤ 0.001). See Supplementary Table 3 for exact p values. See Methods for details.
Extended Data Fig. 7 |. Substantial CTCF depletion promotes robust RAG utilization of cryptic RSSs across the VH locus in G1-arrested IAA-treated CTCF-degron cells.
a, Diagram of joining between RAG-mediated breaks at initiating bona fide JH4-RSS (blue triangle) and cryptic RSSs, mostly represented by CAC motifs (green triangles), across Igh locus, upon down-modulation of CTCF/CBEs (indicated by light purple arrowheads). Deletional and inversional joining is denoted by red (+) and blue (−) curves, respectively. b, Pooled HTGTS junction profiles across highlighted VH domains for deletional and inversional joining in RAG2-complemented, IAA-treated and G1-arrested parental (n=4 biological repeats with similar results) and CTCF-degron (n=6 biological repeats with similar results) cells. For presentation, all libraries from parental or CTCF-degron cells were pooled and normalized to 3,819 total off-target junctions. Note that the high-level deletional cryptic RSS joining signals (red bars) within IGCR1-JH region are off-scale on the y-axis for viewing of relatively lower level deletional cryptic RSS joining signals across the VH locus. The low-level, but reproducible, inversional joining events (blue bars) within IGCR1-JH region involve cryptic RSSs predominantly at IGCR1 and DH3–2 locales, as described2. The vast majority of deletional joining events across the VH locus are reproducible among replicates and involve, at a minimum the CAC of an RSS. Almost all of the handful of the very low-level inversional joining events interspersed across VH locus are not reproducible among replicates consistent with being background events. c, Average frequencies ± s.d. of deletional (left) and inversional (right) joining events within indicated regions in RAG2-complemented, IAA-treated and G1-arrested parental (n=4 biological repeats with similar results) and CTCF-degron (n=6 biological repeats with similar results) cells. Each of the biological library replicates was normalized to 415 off-target junctions for statistical analysis. p values were calculated using unpaired two-tailed t-test. NA: not applicable. See Methods.
Extended Data Fig. 8 |. A working model for CTCF orchestrating long-range cohesin-driven V(D)J recombinational scanning.
a, Diagram shows mouse VH locus with 100-plus VHs in four domains23,24 as described in Fig. 2a,b legend and the main text. b, With normal CTCF/CBE-impediment activity (red arrowheads), RAG scanning is strongly impeded by CBE-based IGCR1 and non-CBE-based DJHRC impediments2,5, allowing scanning-based D-to-JH rearrangement to precede VH-to-DJH rearrangement2. Low-level scanning beyond IGCR1 allows proximal VH-to-DJH rearrangement in a minor subset of pro-B cells. Proximal VH-CBEs impedes further upstream scanning5,47. c, Down-modulation of CTCF reduces CTCF-occupancy of CBEs (grey arrowheads) across Igh, but residual binding is retained at certain CBEs (light blue arrowheads). Dampened CTCF/CBE activity allows RC-bound RAG to scan various linear distances across Igh in some cases the full-length. Upon reaching remaining scanning impediments, which could reflect CBEs with residual CTCF binding and/or transcription (dark arrows)2,21,48 and perhaps others not yet defined (see main text, Fig. 3e and Supplementary Data), impeded scanning focuses RC-based RAG activity on sequences in the impeded region2 for VH-to-DJH joining49 d, Down-modulation of CTCF binding activity is one manner for extending extrusion but this could also be achieved by circumventing CBE impediments, for example, through modulation of cohesin activity (see text). Finally, extrusion of chromatin impediments past the RC may be more efficient in the absence of RAG binding2. With respect to the VH locus, a RAG-bound RC may be more resistant passing impediments and also lead to V(D)J rearrangements that could progressively decrease the level of scanning that proceeds further upstream.
ACKNOWLEDGEMENTS
We thank lab members for stimulating discussions. This work was supported by NIH R01 AI020047 (to F.W.A.). R.C. is partially funded by the NIH Regulome Project. F.W.A. is an investigator of the Howard Hughes Medical Institute. Z.B. was a Cancer Research Institute Irvington fellow.
REFERENCES
- 1.Teng G & Schatz DG Regulation and Evolution of the RAG Recombinase. Adv. Immunol. 128, 1–39 (2015). [DOI] [PubMed] [Google Scholar]
- 2.Zhang Y et al. The fundamental role of chromatin loop extrusion in physiological V(D)J recombination. Nature 573, 600–604 (2019). [DOI] [PMC free article] [PubMed] [Google Scholar]
- 3.Guo C et al. CTCF-binding elements mediate control of V(D)J recombination. Nature 477, 424–430 (2011). [DOI] [PMC free article] [PubMed] [Google Scholar]
- 4.Hu J et al. Chromosomal Loop Domains Direct the Recombination of Antigen Receptor Genes. Cell 163, 947–959 (2015). [DOI] [PMC free article] [PubMed] [Google Scholar]
- 5.Jain S, Ba Z, Zhang Y, Dai H-Q & Alt FW CTCF-Binding Elements Mediate Accessibility of RAG Substrates During Chromatin Scanning. Cell 174, 102–116.e14 (2018). [DOI] [PMC free article] [PubMed] [Google Scholar]
- 6.Bossen C, Mansson R & Murre C Chromatin topology and the regulation of antigen receptor assembly. Annu. Rev. Immunol. 30, 337–356 (2012). [DOI] [PubMed] [Google Scholar]
- 7.Ebert A, Hill L & Busslinger M Spatial Regulation of V-(D)J Recombination at Antigen Receptor Loci. Adv. Immunol. 128, 93–121 (2015). [DOI] [PubMed] [Google Scholar]
- 8.Proudhon C, Hao B, Raviram R, Chaumeil J & Skok JA Long-Range Regulation of V(D)J Recombination. Adv. Immunol. 128, 123–182 (2015). [DOI] [PMC free article] [PubMed] [Google Scholar]
- 9.Bredemeyer AL et al. ATM stabilizes DNA double-strand-break complexes during V(D)J recombination. Nature 442, 466–470 (2006). [DOI] [PubMed] [Google Scholar]
- 10.Natsume T, Kiyomitsu T, Saga Y & Kanemaki MT Rapid Protein Depletion in Human Cells by Auxin-Inducible Degron Tagging with Short Homology Donors. Cell Rep 15, 210–218 (2016). [DOI] [PubMed] [Google Scholar]
- 11.Rao SSP et al. Cohesin Loss Eliminates All Loop Domains. Cell 171, 305–320.e24 (2017). [DOI] [PMC free article] [PubMed] [Google Scholar]
- 12.Wutz G et al. Topologically associating domains and chromatin loops depend on cohesin and are regulated by CTCF, WAPL, and PDS5 proteins. EMBO J. 36, 3573–3599 (2017). [DOI] [PMC free article] [PubMed] [Google Scholar]
- 13.Nora EP et al. Targeted Degradation of CTCF Decouples Local Insulation of Chromosome Domains from Genomic Compartmentalization. Cell 169, 930–944.e22 (2017). [DOI] [PMC free article] [PubMed] [Google Scholar]
- 14.Yatskevich S, Rhodes J & Nasmyth K Organization of Chromosomal DNA by SMC Complexes. Annu. Rev. Genet. (2019). doi: 10.1146/annurev-genet-112618-043633 [DOI] [PubMed] [Google Scholar]
- 15.Peters J-M, Tedeschi A & Schmitz J The cohesin complex and its roles in chromosome biology. Genes Dev. 22, 3089–3114 (2008). [DOI] [PubMed] [Google Scholar]
- 16.Haarhuis JHI, Elbatsh AMO & Rowland BD Cohesin and its regulation: on the logic of X-shaped chromosomes. Dev. Cell 31, 7–18 (2014). [DOI] [PubMed] [Google Scholar]
- 17.Fudenberg G et al. Formation of Chromosomal Domains by Loop Extrusion. Cell Rep 15, 2038–2049 (2016). [DOI] [PMC free article] [PubMed] [Google Scholar]
- 18.Sanborn AL et al. Chromatin extrusion explains key features of loop and domain formation in wild-type and engineered genomes. Proc. Natl. Acad. Sci. U.S.A. 112, E6456–65 (2015). [DOI] [PMC free article] [PubMed] [Google Scholar]
- 19.Davidson IF et al. DNA loop extrusion by human cohesin. Science 366, 1338–1345 (2019). [DOI] [PubMed] [Google Scholar]
- 20.Kim Y, Shi Z, Zhang H, Finkelstein IJ & Yu H Human cohesin compacts DNA by loop extrusion. Science 366, 1345–1349 (2019). [DOI] [PMC free article] [PubMed] [Google Scholar]
- 21.Zhang X et al. Fundamental roles of chromatin loop extrusion in antibody class switching. Nature 575, 385–389 (2019). [DOI] [PMC free article] [PubMed] [Google Scholar]
- 22.Lin SG et al. Highly sensitive and unbiased approach for elucidating antibody repertoires. Proc. Natl. Acad. Sci. U.S.A. 113, 7846–7851 (2016). [DOI] [PMC free article] [PubMed] [Google Scholar]
- 23.Choi NM et al. Deep sequencing of the murine IgH repertoire reveals complex regulation of nonrandom V gene rearrangement frequencies. J. Immunol. 191, 2393–2402 (2013). [DOI] [PMC free article] [PubMed] [Google Scholar]
- 24.Bolland DJ et al. Two Mutually Exclusive Local Chromatin States Drive Efficient V(D)J Recombination. Cell Rep 15, 2475–2487 (2016). [DOI] [PMC free article] [PubMed] [Google Scholar]
- 25.Degner SC et al. CCCTC-binding factor (CTCF) and cohesin influence the genomic architecture of the Igh locus and antisense transcription in pro-B cells. Proc. Natl. Acad. Sci. U.S.A. 108, 9566–9571 (2011). [DOI] [PMC free article] [PubMed] [Google Scholar]
- 26.Lucas JS, Zhang Y, Dudko OK & Murre C 3D trajectories adopted by coding and regulatory DNA elements: first-passage times for genomic interactions. Cell 158, 339–352 (2014). [DOI] [PMC free article] [PubMed] [Google Scholar]
- 27.Khoury A et al. Constitutively bound CTCF sites maintain 3D chromatin architecture and long-range epigenetically regulated domains. Nat Commun 11, 54–13 (2020). [DOI] [PMC free article] [PubMed] [Google Scholar]
- 28.Nakahashi H et al. A genome-wide map of CTCF multivalency redefines the CTCF code. Cell Rep 3, 1678–1689 (2013). [DOI] [PMC free article] [PubMed] [Google Scholar]
- 29.Canzio D et al. Antisense lncRNA Transcription Mediates DNA Demethylation to Drive Stochastic Protocadherin α Promoter Choice. Cell (2019). doi: 10.1016/j.cell.2019.03.008 [DOI] [PMC free article] [PubMed] [Google Scholar]
- 30.Hansen AS, Cattoglio C, Darzacq X & Tjian R Recent evidence that TADs and chromatin loops are dynamic structures. Nucleus 9, 20–32 (2018). [DOI] [PMC free article] [PubMed] [Google Scholar]
- 31.Li Y et al. The structural basis for cohesin–CTCF-anchored loops. Nature 1–9 (2020). doi: 10.1038/s41586-019-1910-z [DOI] [PMC free article] [PubMed] [Google Scholar]
- 32.Pugacheva EM et al. CTCF mediates chromatin looping via N-terminal domain-dependent cohesin retention. Proc. Natl. Acad. Sci. U.S.A. 117, 2020–2031 (2020). [DOI] [PMC free article] [PubMed] [Google Scholar]
- 33.Hansen AS et al. Distinct Classes of Chromatin Loops Revealed by Deletion of an RNA-Binding Region in CTCF. Molecular Cell 76, 395–411.e13 (2019). [DOI] [PMC free article] [PubMed] [Google Scholar]
- 34.Saldaña-Meyer R et al. RNA Interactions Are Essential for CTCF-Mediated Genome Organization. Molecular Cell 76, 412–422.e5 (2019). [DOI] [PMC free article] [PubMed] [Google Scholar]
- 35.Haarhuis JHI et al. The Cohesin Release Factor WAPL Restricts Chromatin Loop Extension. Cell 169, 693–707.e14 (2017). [DOI] [PMC free article] [PubMed] [Google Scholar]
- 36.Busslinger GA et al. Cohesin is positioned in mammalian genomes by transcription, CTCF and Wapl. Nature 544, 503–507 (2017). [DOI] [PMC free article] [PubMed] [Google Scholar]
- 37.Wutz G et al. ESCO1 and CTCF enable formation of long chromatin loops by protecting cohesinSTAG1 from WAPL. Elife 9, (2020). [DOI] [PMC free article] [PubMed] [Google Scholar]
- 38.Hesslein DGT et al. Pax5 is required for recombination of transcribed, acetylated, 5’ IgH V gene segments. Genes Dev. 17, 37–42 (2003). [DOI] [PMC free article] [PubMed] [Google Scholar]
- 39.Fuxa M et al. Pax5 induces V-to-DJ rearrangements and locus contraction of the immunoglobulin heavy-chain gene. Genes Dev. 18, 411–422 (2004). [DOI] [PMC free article] [PubMed] [Google Scholar]
- 40.Liu H et al. Yin Yang 1 is a critical regulator of B-cell development. Genes Dev. 21, 1179–1189 (2007). [DOI] [PMC free article] [PubMed] [Google Scholar]
- 41.Medvedovic J et al. Flexible long-range loops in the VH gene region of the Igh locus facilitate the generation of a diverse antibody repertoire. Immunity 39, 229–244 (2013). [DOI] [PMC free article] [PubMed] [Google Scholar]
- 42.Donohoe ME, Zhang L-F, Xu N, Shi Y & Lee JT Identification of a Ctcf cofactor, Yy1, for the X chromosome binary switch. Molecular Cell 25, 43–56 (2007). [DOI] [PubMed] [Google Scholar]
- 43.Ebert A et al. The distal V(H) gene cluster of the Igh locus contains distinct regulatory elements with Pax5 transcription factor-dependent activity in pro-B cells. Immunity 34, 175–187 (2011). [DOI] [PubMed] [Google Scholar]
- 44.Seitan VC et al. A role for cohesin in T-cell-receptor rearrangement and thymocyte differentiation. Nature 476, 467–471 (2011). [DOI] [PMC free article] [PubMed] [Google Scholar]
- 45.Zhao L et al. Orientation-specific RAG activity in chromosomal loop domains contributes to Tcrd V(D)J recombination during T cell development. J. Exp. Med. 213, 1921–1936 (2016). [DOI] [PMC free article] [PubMed] [Google Scholar]
- 46.Ribeiro de Almeida C et al. The DNA-binding protein CTCF limits proximal Vκ recombination and restricts κ enhancer interactions to the immunoglobulin κ light chain locus. Immunity 35, 501–513 (2011). [DOI] [PubMed] [Google Scholar]
- 47.Lin SG, Ba Z, Alt FW & Zhang Y RAG Chromatin Scanning During V(D)J Recombination and Chromatin Loop Extrusion are Related Processes. Adv. Immunol. 139, 93–135 (2018). [DOI] [PubMed] [Google Scholar]
- 48.Hsieh T-HS et al. Resolving the 3D landscape of transcription-linked mammalian chromatin folding. bioRxiv 176, 638775 (2019). [DOI] [PMC free article] [PubMed] [Google Scholar]
- 49.Alt FW, Zhang Y, Meng F-L, Guo C & Schwer B Mechanisms of programmed DNA lesions and genomic instability in the immune system. Cell 152, 417–429 (2013). [DOI] [PMC free article] [PubMed] [Google Scholar]
- 50.Shinkai Y et al. RAG-2-deficient mice lack mature lymphocytes owing to inability to initiate V(D)J rearrangement. Cell 68, 855–867 (1992). [DOI] [PubMed] [Google Scholar]
- 51.Strasser A et al. Enforced BCL2 expression in B-lymphoid cells prolongs antibody responses and elicits autoimmune disease. Proc. Natl. Acad. Sci. U.S.A. 88, 8661–8665 (1991). [DOI] [PMC free article] [PubMed] [Google Scholar]
- 52.Cong L et al. Multiplex genome engineering using CRISPR/Cas systems. Science 339, 819–823 (2013). [DOI] [PMC free article] [PubMed] [Google Scholar]
- 53.Sakaue-Sawano A et al. Visualizing spatiotemporal dynamics of multicellular cell-cycle progression. Cell 132, 487–498 (2008). [DOI] [PubMed] [Google Scholar]
- 54.Ji Y et al. The in vivo pattern of binding of RAG1 and RAG2 to antigen receptor loci. Cell 141, 419–431 (2010). [DOI] [PMC free article] [PubMed] [Google Scholar]
- 55.Hu J et al. Detecting DNA double-stranded breaks in mammalian genomes by linear amplification-mediated high-throughput genome-wide translocation sequencing. Nat Protoc 11, 853–871 (2016). [DOI] [PMC free article] [PubMed] [Google Scholar]
- 56.Frock RL et al. Genome-wide detection of DNA double-stranded breaks induced by engineered nucleases. Nat. Biotechnol. 33, 179–186 (2015). [DOI] [PMC free article] [PubMed] [Google Scholar]
- 57.Orlando DA et al. Quantitative ChIP-Seq normalization reveals global modulation of the epigenome. Cell Rep 9, 1163–1170 (2014). [DOI] [PubMed] [Google Scholar]
- 58.Ramírez F et al. deepTools2: a next generation web server for deep-sequencing data analysis. Nucleic Acids Res. 44, W160–5 (2016). [DOI] [PMC free article] [PubMed] [Google Scholar]
- 59.Anders S, Pyl PT & Huber W HTSeq--a Python framework to work with high-throughput sequencing data. Bioinformatics 31, 166–169 (2015). [DOI] [PMC free article] [PubMed] [Google Scholar]
Associated Data
This section collects any data citations, data availability statements, or supplementary materials included in this article.
Supplementary Materials
Data Availability Statement
HTGTS-V(D)J-seq, 3C-HTGTS, ChIP-seq, and GRO-seq sequencing data reported in this study have been deposited in the Gene Expression Omnibus (GEO) database under the accession number GSE142781.


