

Abstract
Background.
Whether microbiome characteristics of induced sputum or oral samples demonstrate unique relationships to features of atopy or mild asthma in adults is unknown.
Objective.
To determine sputum and oral microbiota relationships to clinical or immunologic features in mild atopic asthma and the impact on the microbiota of inhaled corticosteroid (ICS) treatment administered to ICS-naïve asthmatic subjects.
Methods.
Bacterial microbiota profiles were analyzed in induced sputum and oral wash samples from 32 subjects with mild atopic asthma before and after inhaled fluticasone treatment, 18 atopic non-asthmatic subjects, and 16 non-atopic healthy subjects in a multicenter study (NCT01537133). Associations with clinical and immunologic features were examined, including markers of atopy, type 2 inflammation, immune cell populations and cytokines.
Results.
Sputum bacterial burden inversely associated with bronchial expression of type 2 (T2)-related genes. Differences in specific sputum microbiota also associated with T2-low asthma phenotype, a subgroup of whom displayed elevations in lung inflammatory mediators and reduced sputum bacterial diversity. Differences in specific oral microbiota were more reflective of atopic status. After ICS treatment of asthmatics, the compositional structure of sputum microbiota showed greater deviation from baseline in ICS non-responders than in ICS-responders.
Conclusion.
Novel associations of sputum and oral microbiota to immunologic features were observed in this cohort of subjects with or without ICS-naïve mild asthma. These findings confirm and extend our prior report of reduced bronchial bacterial burden and compositional complexity in T2-high asthma subjects, with additional identification of a T2-low subgroup with a distinct microbiota-immunologic relationship.
Keywords: microbiome, cytokines, sputum, oral, asthma, allergic, corticosteroids, type 2 inflammation
Graphical Abstract
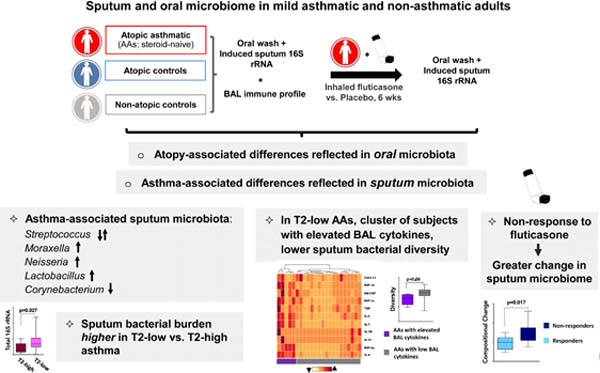
Capsule summary:
In mild atopic asthma, sputum bacterial microbiome characteristics associate with several immunologic features, including type 2-low airway inflammation, and display differential changes related to response to inhaled corticosteroid treatment.
INTRODUCTION.
Perturbations in bronchial microbiota composition have been associated with several phenotypic features of asthma in adults, including airway hyper-responsiveness, airflow obstruction, response to steroids, and neutrophilic inflammation (1–7). There is concurrent interest in phenotypic stratification of asthma based on underlying airway immune response patterns (8–10), and recent studies have described significant relationships between bronchial microbiota patterns and the level of type 2 (T2) airway inflammation present (3, 11–13). We recently reported findings of reduced bacterial burden in bronchial epithelial brushings from mild asthma patients with a T2-high inflammation pattern (3), with few associations between specific bronchial bacteria and T2-related inflammatory markers (3, 11). While sampling the airways by bronchoscopy is desirable for many reasons, practical constraints limit its utility to investigate a broad range of asthma phenotypes in the larger population.
Studies of sputum have described associations between neutrophilic severe asthma and the relative abundance of organisms representing potential respiratory pathogens such as members of the Moraxella and Haemophilus genera (14–18). However, possible relationships between eosinophilic asthma and sputum microbiota remain obscure. Further, treatment with inhaled corticosteroids (ICS) has been shown to influence the composition of bronchial airway microbiota in asthma patients (3, 4, 13, 15), potentially affecting their clinical efficacy (3, 4). It remains unclear whether ICS treatment similarly affects the oral and sputum microbiota. Lastly, potential links between the oral microbiota and features of atopic asthma in adults have so far been overlooked, despite recent evidence of associations with risk for atopic disease, particularly asthma, in children (19). We recently showed that while induced sputum microbiota composition shares features with that of oral wash samples, the former is nonetheless distinct and in mild asthmatic subjects, more closely resembles that of bronchial brush samples (20).
Because induced sputum and oral wash are more easily obtained, we here investigated whether relationships between specific clinical and immunologic features in mild atopic asthma and the microbiota in these sample types exist. We used samples collected in a multi-center study from which we previously reported such relationships with bronchial brush microbiota (3). We hypothesized that distinct characteristics of sputum and oral microbiota composition associate with phenotypic features in mild asthma, including immunologic measures related to atopy and/or asthma. We also hypothesized that ICS treatment of steroid-naïve mild asthma subjects induces significantly different changes in the airway and oral microbiota between ICS-responsive and non-responsive subjects.
METHODS.
Please see Supplemental material for additional details.
Study Population and Sample Collection.
This study analyzed samples and data from a subset of adult subjects enrolled in an NHLBI AsthmaNet microbiome study (NCT01537133) (3, 20)] and included 32 atopic asthmatic (AA), 18 atopic non-asthmatic (ANA) and 16 non-atopic healthy control subjects (HC), whose characteristics are summarized in Table 1 and Table S1. Details of the study protocol have been previously described (3). At enrollment, all subjects were clinically stable for at least three months including no use of antibiotics; AAs had not used a controller medication in the prior six months. Oral wash (OW), induced sputum (IS) and bronchoalveolar lavage fluid (BAL) were collected at baseline, and in AA subjects also after treatment with inhaled fluticasone propionate or placebo twice daily for six weeks (3). Each subject provided informed consent approved by each clinical center’s Institutional Review Board including use of their samples and data for subsequent analyses.
Table 1.
Study cohort characteristics
| Variable | Allergic asthmatics (AAs) (n = 32) |
Allergic non-asthmatics (ANAs) (n = 18) |
Non-allergic non-asthmatics (HCs) (n = 16) |
q-value# | AA vs. ANA or HC p-value& |
|---|---|---|---|---|---|
| Age (yrs) | 35 (27 – 42) | 30 (25 – 44) | 28 (25 – 48) | NS | |
| ACQ Score (Baseline)* | 0.6 (0.2 – 1.0) | - | - | - | |
| Age asthma diagnosed (yrs) | 9(5–23) | - | - | - | |
| % Male | 41% | 50% | 50% | NS€ | |
| % White | 56% | 56% | 69% | NS€ | |
| BMI | 26 (23 – 30) | 25 (21 – 29) | 26 (22 – 27) | NS | |
| FEV1 % predicted pre-Ab¥ | 89 (73 – 99) | 99 (94 – 108) | 100 (95 – 109) | 0.017 | 0.002 (AA vs. ANA) 0.005 (AA vs. HC) |
| FEV1 % predicted post-Ab¥ | 101 (84 – 107) | 104 (98 – 108) | 102 (100 – 117) | NS | |
| Change in FEV% | 7.5 (5.3 – 15.0) | 3.0 (1.0 – 6.3) | 4.5 (2.3 – 5.0) | 0.001 | <0.001 (AA vs. ANA) <0.001 (AA vs. HC) |
| PC20 (methacholine) | 1.0 (0.2 – 2.4) | >32$ | >32$ | 0.001 | ND |
| Serum IgE (EU/mL) | 169.5 (55.3 – 316.3) | 45.0 (21.2 – 97.5) | 14.5 (5.0 – 32.8) | 0.001 | 0.002 (AA vs. ANA) <0.001 (AA vs. HC) |
| No. of positive sIgE¢ | 6(2–9) | 3(2–4) | - | 0.14& | |
| Atopic rhinitis (%)§ | 57% | 22% | 0% | 0.004€ | ND |
|
Eczema/Atopic dermatitis (%)§ |
41% | 22% | 0% | 0.059€ | ND |
| Blood neutrophils (%) | 54 (49 – 61) | 59 (51 – 65) | 57 (52 – 65) | NS | |
| Blood eosinophils (absolute) | 200 (100 – 400) | 100 (82 – 175) | 100 (75 – 200) | 0.059 | ND |
| Blood eosinophils (%) | 4(2–6) | 2(1–3) | 2(1–3) | 0.017 | 0.02 (AA vs. ANA) 0.001 (AA vs. HC) |
| Sputum neutrophils (%) | 55 (33 – 65) | 39 (22 – 50) | 41 (29 – 73) | NS | |
| Sputum eosinophils (%) | 0.4 (0.0 – 1.2) | 0.0 (0.0 – 0.5) | 0.0 (0.0 – 0.4) | NS | |
| TGM$ score | 0.4 (−0.1 – 1.2) | −0.4 (−0.7 – 0.1) | −0.9 (−1.2 – −0.1) | 0.001 | 0.002 (AA vs. ANA) <0.001 (AA vs. HC) |
All values are medians (IQR).
ACQ - Asthma Control Questionnaire.
Alb – Albuterol
Methacholine challenge was stopped at 32 mg/dL and PC20 for these subjects was censored.
Number of positive specific IgE (sIgE >0.35 kU/l) from a total of 12 aeroallergens tested by ImmunoCap assay.
Subjects with a positive history of allergic conditions specified (self-reported).
TGM – Three gene mean score - bronchial epithelial signature of type 2 inflammation as previously described, based on IL-13 responsive epithelial genes. Statistical significance was determined using
Kruskal-Wallis;
Mann-Whitney or
Chi-square test with q-values >0.150 assigned NS.
Mann-Whitney test vs AAs; ND= not determined
Bronchial epithelial “Three-gene mean” score evaluation.
Expression levels of three bronchial epithelial genes (CLCA1, SERPINB2 and POSTN) previously shown to be induced by IL-13 (21–23), were measured to calculate the “three-gene mean” (TGM) score for each participant. Type 2 (T2) – high asthma was defined as a TGM score ≥1.117 (two standard deviations above the average TGM-score in HC), as previously described (3).
BAL and Blood Cell Flow Cytometry, BAL cytokine multiplex testing.
Blood samples for immunophenotyping were collected at bronchoscopy directly into Cyto-Chex BCT blood collection tubes (Streck, Inc.). BAL was collected and processed within 48 hours for immunophenotyping (24) and cytokine measurements, as detailed in the Supplement. Among CD45+CD3+CD4+ T cells, cell populations enriched for functionally distinct T cell subsets (Table S1a) were identified as follows (24): regulatory T cells (CD25hiCD127lo), Th2 (CCR6-CCR4+), Th1 (CCR6-CCR4-) and Th17 (CCR6+). BAL supernatants were concentrated and assayed using a MILLIPLEX MAP human high sensitivity T cell panel 21-plex immunology multiplex assay for detection of 21 targeted cytokines as previously described (20), of which 11 had detectable levels (Table S1b).
Nucleic acid extraction and 16S rRNA-based sequencing of OW and IS samples.
Only IS samples with <80% squamous epithelial cell counts were included for bacterial community analysis. OW and IS samples were processed as previously described (20) for bacterial community profiling by sequencing of the V4 region of the 16S rRNA gene on an Illumina Miseq.
Sequence data processing and quality control
Sequence analysis was performed using the Quantitative Insights into Microbial Ecology (QIIME) pipeline (25), as described previously (3). Operational taxonomic units (OTUs) were picked at 97% sequence identity using UCLUST (26) against the Greengenes (27) database. Reads that failed to hit the reference sequence collection were retained and clustered de novo. OTUs identified in negative processing controls (2% of total negative control reads) and those present at less than 0.001% of total counts were removed from the OTU table. Alpha diversity indices and UniFrac distances were calculated using the OTU table multiply rarefied (3, 20) to 53,219 sequences per sample. All sequence data related to this study are available from the European Nucleotide Archive under accession numbers PRJEB15534 and PRJEB22676.
Statistical analysis:
Statistical analyses were performed in QIIME, R environment or PRISM software. Non-parametric or parametric tests for between group differences were selected based on the outcome of Shapiro-Wilk normality test. Results were corrected for multiple testing where appropriate using q-value or Benjamini-Hochberg method (28). Principal coordinates analyses (PCoA) were performed on unweighted and weighted UniFrac distance matrices and distance-based PERMANOVA (29, 30) used to identify factors that explained variation in bacterial community beta-diversity (between-samples). Negative binomial regression corrected for multiple testing (q<0.10) was used to determine specific OTUs that differed in relative abundance between groups. Mantel test (31) based on weighted UniFrac distance was used to compare community composition between paired samples in each treatment group.
RESULTS
Cohort characteristics
As reported previously (3, 20), atopic asthmatic (AA) subjects in this cohort had mild well-controlled asthma and were more likely to report a history of atopic symptoms compared to atopic non-asthmatic (ANAs) and non-atopic healthy control (HC) subjects (Table 1). AAs had significantly higher serum total IgE, blood eosinophil counts and were more likely to be multi-sensitized to aeroallergens than ANAs (Table 1 and Table S1a–b), indicating an overall elevated atopic status in this group of subjects. AAs also displayed greater T2 airway inflammation based on their three-gene mean (TGM) score (3) for IL-13-responsive epithelial genes in bronchial brush samples (Table 1). Airway hyper-responsiveness associated with a higher TGM score, serum total IgE, and blood eosinophil percentage, but inversely with proportion of T regulatory cells in BAL fluid (Table 2).
Table 2.
Significant associations between inflammatory markers and lung function measures of mild atopic asthma subjects in this study.
| PC20 (methacholine) | FEV1 % predicted pre-Ab | |||||
|---|---|---|---|---|---|---|
| rho* | p-value | BH p-value# | rho* | p-value | BH p-value# | |
| TGM score | −0.58 | <0.0001 | <0.001 | −0.23 | 0.066 | 0.153 |
| No. of positive sIgE | −0.55 | <0.0001 | <0.001 | −0.32 | 0.009 | 0.085 |
| Serum IgE (EU/mL) | −0.49 | <0.0001 | <0.001 | −0.27 | 0.026 | 0.140 |
| Blood eosinophils (%) | −0.34 | 0.007 | 0.041 | −0.33 | 0.008 | 0.085 |
| Blood eosinophils (absolute) | −0.29 | 0.022 | 0.086 | −0.21 | 0.095 | 0.197 |
| Blood eosinophils (%CD45+) | −0.34 | 0.008 | 0.041 | −0.31 | 0.013 | 0.086 |
| Blood neutrophils (%CD45+) | 0.24 | 0.064 | 0.152 | 0.39 | 0.001 | 0.034 |
| BAL Tregs (%CD3+CD4+) | 0.28 | 0.034 | 0.104 | 0.14 | 0.269 | 0.383 |
| BAL Th1 (%CD45+) | 0.26 | 0.042 | 0.114 | 0.23 | 0.068 | 0.153 |
| Sputum eosinophils (%) | −0.27 | 0.035 | 0.104 | −0.27 | 0.031 | 0.140 |
Analysis performed using Spearman correlation coefficient.
FDR corrected for multiple comparisons using Benjamini-Hochberg method, with values ≤0.15 considered significant.
Sputum and oral microbiota characteristics associate with distinct clinical and inflammatory features in asthmatic and atopic non-asthmatic subjects.
Neither bacterial burden nor alpha-diversity (i.e. within-sample) measures of bacterial composition in sputum (IS) or oral wash (OW) differentiated the three groups of subjects (Table S2). However, there were distinct associations between alpha-diversity measures of either sample type and clinical and immunologic features (Table S3). Greater OW bacterial diversity correlated with better pulmonary function (FEV1%) and with the proportion of BAL Th1 (%CD45+) cells. In contrast, IS diversity correlated with neither of these measures, whereas IS richness correlated positively with the proportion of blood neutrophils. IS diversity (Shannon index) demonstrated a negative relationship with the pro-inflammatory cytokines IL-7 and IL-8 in BAL, although this was not statistically significant after adjustment for multiple comparisons (Table S3). These initial observations suggested differences in microbiota-immune interactions in the oral versus sputum compartments.
Beta-diversity measures, which capture between-sample differences in microbial composition, were used next to test differences in either IS or OW bacterial composition between the subject groups. Specifically, the phylogeny-based Unifrac distance was used including unweighted and weighted calculations that reflect, respectively, bacterial membership (i.e. equally emphasizing low and high abundance taxa as present or absent) and their quantitative composition (whereby high overshadows low abundance taxa), thus revealing distinct attributes of the microbial assemblages. We observed that the bacterial membership of IS microbiota in AAs less resembled that of HCs than similarly compared IS microbiota in ANAs (difference in unweighted UniFrac distance, p=0.03; Figure S1). This suggested a bacterial dysbiosis gradient between the two atopic groups relative to non-atopic HCs. Interestingly, this feature was unapparent with oral microbiota, in which the bacterial membership of OW samples from either atopic group was equally dissimilar to HC subjects (Figure S1).
To test the hypothesis that compositional differences in OW or IS microbiota associate with specific BAL or blood immune markers of atopy and asthma, distance-based permutational analysis of variance (unweighted and weighted Unifrac) was performed. In both OW and IS samples, differences in bacterial community membership associated with post-bronchodilator change in FEV1%, Asthma Control Questionnaire (ACQ) scores, and BAL IL-7 levels (unweighted UniFrac, p<0.05; Table S4). In IS samples only, bacterial community membership also associated with aeroallergen multi-sensitization and blood eosinophils (unweighted UniFrac, p<0.05). In OW samples, bacterial community membership associated with study group, serum total IgE, as well as BAL IL-8 levels and proportion of BAL memory T cells and Th17 T cells (unweighted UniFrac, p<0.05; Table S4). When the abundances of bacterial taxa were considered (weighted Unifrac), IS bacterial community structure associated also with serum total IgE, proportion of BAL memory T cells and BAL CXCL11 levels, suggesting that these associations are likely influenced by taxa present in higher abundance. These findings overall indicated differences in immune markers associated with distinct attributes of the bacterial community configurations in sputum and oral wash samples. Ecologically the oral cavity differs greatly from the respiratory tract despite some overlap in microbial constituents (20, 32). Thus the possibility exists for different interactions to occur between the microbiota and immune system within different mucosal compartments.
We then conducted taxon-level analyses comparing differences between the groups in the relative abundance of identified bacteria in IS or OW. Of IS bacterial OTUs most likely associated with asthma (i.e. those present in similarly greater or lesser relative abundance compared to both control groups; Figure 1; Supplemental Table S5–S7), several belonged to genera previously reported to be asthma-associated, such as Moraxella and Streptococcus (17, 18, 33–35) and Lactobacillus (1). It is noted that a number of asthma-associated Streptococcus OTUs were depleted in asthmatic airways, highlighting likely species or strain level differences in members of this genus and asthma-related associations. In agreement with our earlier analysis of bronchial brushings (3), sputum enrichment of Neisseria appeared asthma-specific, and its relative abundance correlated with BAL IL-7 (Figure S2). Other IS taxa were found to be more likely associated with atopy (similarly enriched in AAs and ANAs compared to HCs), specifically enrichment of Granulicatella and depletion of Aggregatibacter among others (Figure 1). Interestingly, specific taxa in IS, but not OW, correlated significantly with several immune markers in blood or BAL including IL-7 and IL-8 and proportion of BAL memory T cells (Figure S2). In agreement with these observations, no specific oral taxa were found to be asthma-specific (i.e. present in similarly greater or lesser relative abundance compared to both control groups; Figure 1; Supplemental Table S8–S10). Instead differences in specific oral taxa between the groups seemed more reflective of atopic status.
Figure 1:
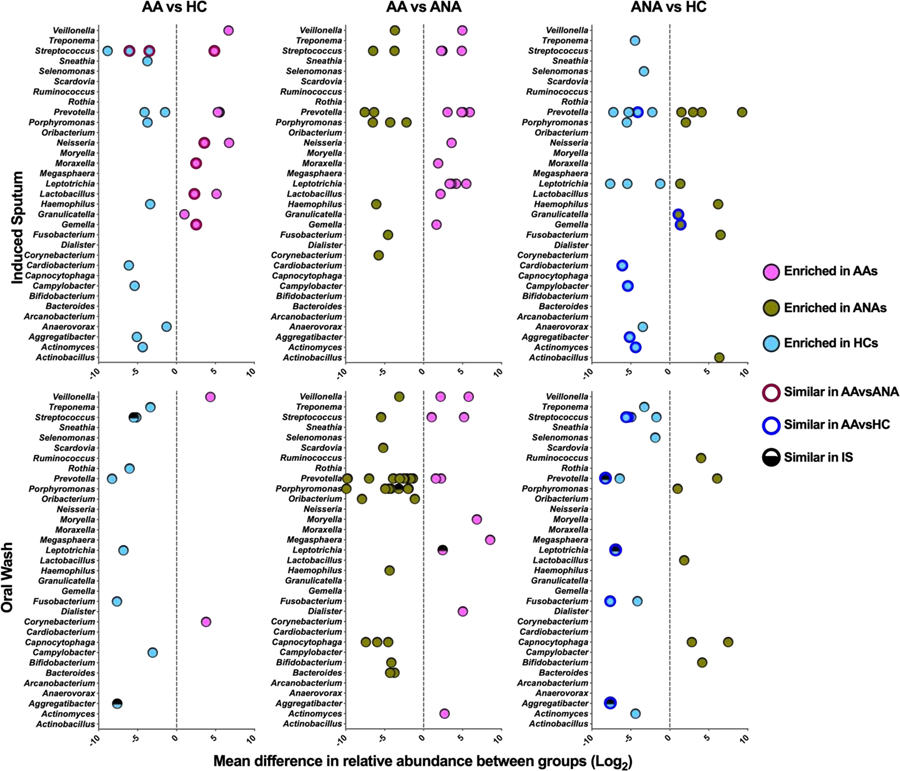
Mean difference in relative abundance (mean sequence reads) of specific bacterial taxa present in IS and OW in the two-group comparisons shown (negative binomial regression model q<0.1). Each dot represents a unique OTU within a given bacterial genus. Maroon colored circles highlight taxa most likely to be asthma-associated (i.e. similarly enriched or depleted in AA vs. ANA or HC). Blue colored circles highlight taxa most likely to be atopy-associated (i.e. similarly enriched or depleted in AA and ANA vs. HC).
Sputum microbiota characteristics differ by T2-status among asthmatic subjects.
Bronchial epithelial three-gene mean (TGM) scores, reflective of IL-13-driven immune response, were higher in AAs compared to non-AAs (Figure 2A). Compared to the T2-low AAs (n=22), T2-high AAs (n=9) had higher ACQ scores, serum IgE levels, blood eosinophils, and a lower proportion of circulating Th17 cells (Table S11). T2-high AAs also demonstrated significantly lower bacterial burden in IS samples (Figure 2B), confirming our prior finding from analysis of bronchial brushings (3). T2-high AAs also displayed a trend towards lower bacterial phylogenetic diversity in both IS and OW (Figure 2C, Figure S3A). Again in comparison to T2-low AAs, sputum bacterial community structure in T2-high AAs appeared more dissimilar to that of the control group (Figure 2D), a finding likely driven by the lower burden and diversity in T2-high AAs. In line with this, very few sputum bacterial taxa were enriched in T2-high compared to T2-low AAs, whereas conversely many more taxa were enriched in T2-low AAs, including members of Haemophilus, Moraxella, and Neisseria (Figure 2E; Supplement Table S12–S16, Figure S3C). In contrast, oral microbiota composition in T2-low and T2-high subjects did not significantly differ in their similarity to the non-asthmatic control groups (Figure S3B), suggestive of no distinguishing relationships between OW bacterial composition and level of T2 inflammation.
Figure 2:
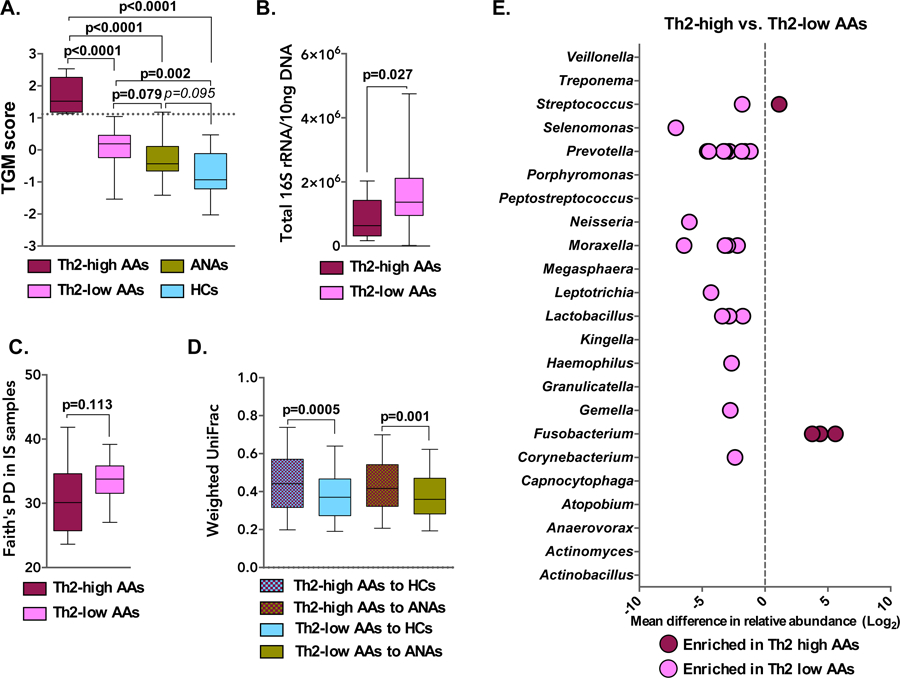
A. Greater expression of airway epithelial genes induced by type 2 (T2) cytokines was observed in AA subjects, particularly in T2-high AAs (n=9) with a TGM of 1.117 or greater (cutoff value indicated by a dashed line; Mann-Whitney test). B. Bacterial burden in IS of T2-high (n=9) and T2-low (n=22) AA subjects (Mann-Whitney test). C. Faith’s Phylogenetic Diversity (PD) in IS samples of T2-high or -low AA subjects (Mann-Whitney test). D. Comparison of bacterial composition (Weighted UniFrac) in IS of T2-high and T2-low AAs to that of non-asthmatic controls (Bonferroni corrected t-test; p>0.1 not shown). E. Mean difference in relative abundance of specific bacterial taxa present in IS of T2-high vs. T2-low AA subjects. Each dot represents a unique OTU within a given bacterial genus (negative binomial regression model q<0.1).
T2-low mild asthmatics with elevated lung pro-inflammatory cytokines exhibit lower sputum bacterial diversity.
Given that subtypes of T2-low asthma are poorly understood but microbial associations implicated (16–18, 36), we enquired whether distinct patterns of lower airway inflammation exist among the T2-low AAs in our cohort and, if so, whether these associate with bacterial community differences in IS or OW. Using unsupervised clustering we found that levels of immune cytokines in BAL differentiated T2-low AAs into two distinct clusters (Figure 3A), with subjects in inflammatory cytokine cluster (ICC) 1 exhibiting elevated levels of IL-8, IL-6, IL-7, and MIP-3a (q<0.1; Table S17).
Figure 3:
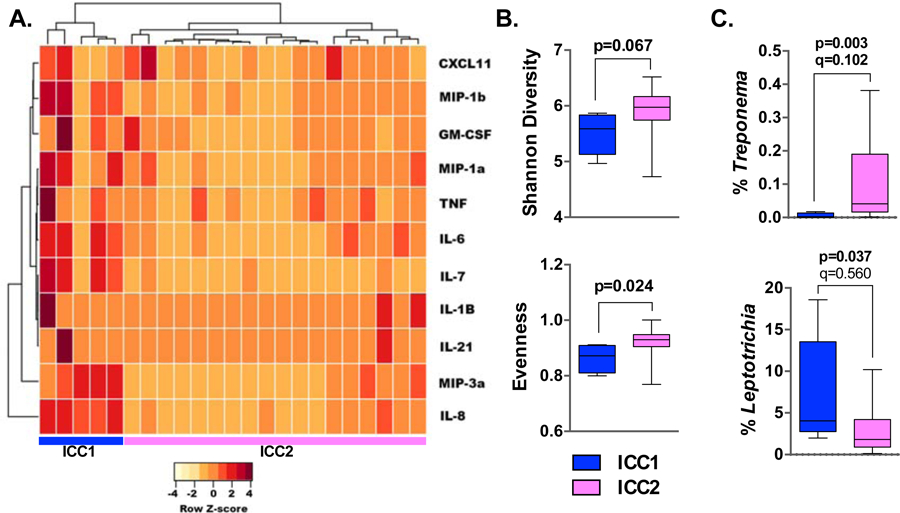
Altered bacterial microbiota composition of IS among ‘T2-low’ AA subjects with elevated BAL inflammatory cytokines. A. BAL inflammatory cytokines differentiated T2-low AA subjects into two distinct clusters. Subjects in inflammatory cytokine cluster (ICC) 1 (n=5) exhibited greater airway inflammation compared to ICC2 (n=18). B. Bacterial diversity and evenness was lower in IS samples of T2-low ICC1 AAs vs. ICC2 AAs (Mann-Whitney test). C. Relative abundance of bacterial genera in IS which differentiated ICC1 and ICC2 AA subjects (Mann-Whitney test, FDR adjusted q-values).
While both clusters harbored similar sputum bacterial burden and richness, ICC1 (n=5) exhibited lower sputum bacterial diversity and evenness compared to ICC2 (n=18); Figure 3B), a pattern not observed with the oral microbiota (data not shown). These findings suggest possible loss of commensal bacteria and/or enrichment in specific microbiota members in ICC1 T2-low AAs. Analysis for such identified sputum depletion in Treponema in ICC1 compared to ICC2 T2-low AAs (Figure 3C); oral enrichment in Actinomyces and Atopobium differentiated ICC2 from ICC1 T2-low AAs (Figure S4). Collectively, these observations suggest links between different lung inflammation patterns in T2-low mild asthma subjects and the compositional structure of airway microbiota reflected here in sputum.
Shifts in sputum microbial community structure after inhaled corticosteroid treatment diverge between ICS-responders and non-responders.
Response to inhaled corticosteroids (ICS) treatment varies in asthma (3, 4). We previously reported indications of a change in bronchial brush microbiota following fluticasone treatment that differed from placebo intervention among mild AAs (3). Here, examining the same question in paired IS and OW samples available from a larger number of AAs, sputum bacterial phylogenetic diversity trended toward a significant change after six weeks of fluticasone treatment (n=21), with evidence of diversity loss compared to placebo controls (n=10; Figure S5), a finding not observed in OW samples.
As before (3) we classified the AA subjects by their change in methacholine PC20 after ICS treatment: twelve AAs were ICS responders (ICSR; ≥ 2-fold increase in PC20) and eight non-responders (ICSNR). ICSR had lower FEV1 and PC20 values and higher circulating dendritic cells (Table S18). We hypothesized that bacterial compositional changes in ICSR and ICSNR subjects would diverge following fluticasone intervention. In the ICSR and placebo groups, the compositional structure of IS or OW microbiota at baseline and post-treatment were significantly similar at both time points (Mantel test; weighted UniFrac p<0.01; Table S19). However, this was not the case in the ICSNR group for either IS or OW microbiota (Mantel test p>0.05), indicative of a shift in bacterial community structure related to ICS intervention. Direct comparison of beta-diversity measures of microbiota composition between the time points also demonstrated significantly greater deviation in sputum of ICSNR (Figure 4A; p<0.05). Fluticasone-associated changes in the relative abundance of specific bacterial taxa were identified with some differences noted between ICSNR and ICSR (Figure 4B; Supplement Table S20–S21 and Figure S6). Together these findings indicated a greater shift in the compositional structure of sputum microbiota following six weeks of intervention in ICS non-responders.
Figure 4:
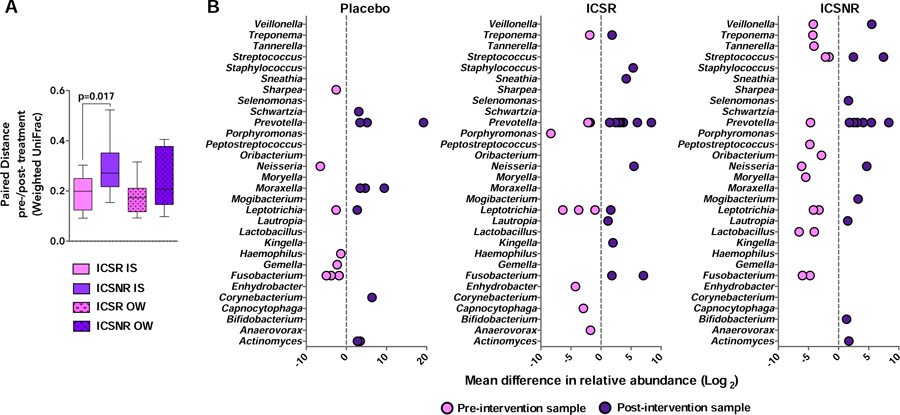
A. ICS non-responder (ICSNR) subjects showed significantly greater change in paired weighted UniFrac distance in IS, but not OW samples, compared to ICS responders (ICSR; Mann-Whitney test). B. Mean difference in relative abundance of specific bacterial taxa present in IS of ICSR subjects (n=12) and ICSNR (n=8), pre- and post-intervention or in placebo-treated asthmatic subjects (n=10). Each dot represents a unique OTU within a given bacterial genus and whether it is enriched or depleted in the respective pre- or post-intervention sample (negative binomial regression model q<0.1).
DISCUSSION.
The objective of this study, a secondary analysis of samples and data from participants in our previously reported trial (3), was to determine relationships between sputum and oral microbiota composition and clinical and immunologic features of atopy and asthma, the latter in subjects with mild ICS-naïve disease. Several observations were confirmatory; others are novel. We confirmed previously reported asthma-associated airway enrichment in Neisseria and Moraxella (3, 5, 33, 34). We also confirmed a difference in airway bacterial burden (sputum) between T2-high and T2-low asthmatics, which we previously observed in bronchial brushings (3). Moreover, we observed significant relationships between bacterial microbiota patterns in T2-low phenotype and clinical and immunologic measures. We identified a cluster of T2-low asthma subjects, albeit small in number, characterized by significantly higher levels of several lung cytokines and reduced sputum bacterial diversity. Intriguingly, we also observed significant relationships between oral microbiota and specific clinical and immunologic features, most of which did not overlap with the relationships observed of sputum microbiota. We interpret the oral microbiota-associated findings as potentially more reflective of atopic status, and the sputum microbiota associations more reflective of asthma-associated immune responses in the lower respiratory tract.
Ecologically, the oral cavity is very different from the lower respiratory tract (20, 31) despite overlap in microbial constituents, and we previously reported from this cohort that the compositional structure of microbiota in our OW samples differed significantly from that of IS (19). Our OW sample consisted of collecting a mouth saline rinse (10 mL) plus tongue scrape material. This may have provided a broader picture of oral microbiota and contributed to the distinct associations with immune markers and atopic status, between OW and IS samples.
An important strength of this study was the collection of within-subject paired samples, enabling across-compartment comparisons of respiratory microbiota-immune marker relationships. We previously showed in this cohort that the compositional structure of microbiota in paired sputum and bronchial brush was more similar in asthmatic subjects (20). Hence, here we focused first on assessing sputum microbiota relationships to select immunologic features and the effect of ICS intervention. The same analysis was then performed with paired oral wash samples to explore their informativeness in revealing microbiota correlates with biological markers and outcomes of interest.
Differences in clinical and immunologic associations were seen between the two sample types, which we highlight as of interest for further study. For instance, IS alpha-diversity demonstrated a negative relationship, though not statistically significant after adjustment, with BAL IL-7 and IL-8, while OW alpha-diversity correlated with lower BAL IL-21, a higher proportion of BAL Th1 cells, and higher FEV1 %predicted. Both IL-7 and IL-21 are implicated in allergic immune cell responses (37–41), including that of allergen-specific memory CD4 T cells and eosinophils. IL-7 can abrogate steroid inhibition of type 2 cytokine production by type 2 innate lymphoid cells (41). Further, significant correlations between specific lung cytokines and specific microbiota members in IS, but not OW, were observed. These findings suggest that microbiota found in either oral or lower respiratory tract specimens could play a role in modulating immune responses and potentially reflect different aberrant mechanisms in atopy and asthma. Why or how atopy has an effect on the oral microbiome is not clear from our studies and will require further mechanistic investigations.
The design of our primary study (3) was intended for examination of sputum and oral microbiome relationships to asthma clinical phenotypes. We focused on the categorization of subjects as either type 2-high or type 2-low based on a previously described IL-13 responsive epithelial gene expression signature (21–23). Other biomarkers have been used to define the level of type 2 inflammation, but this approach was previously shown to perform well (21) and also allowed for our earlier analysis of bronchial airway microbiota in the same specimen type [3]. We noted that sputum bacterial burden in the T2-low group exhibited a broad range. As this suggested possible bacterial heterogeneity amongst T2-low AAs, we further explored this leveraging our BAL cytokine data to examine microbial-immune relationships among T2-low AAs. This revealed two clusters defined by different lung cytokine patterns and associated differences in sputum bacterial diversity. While the clinical significance of these findings is unclear from this exploratory analysis, the finding merits further study of these relationships in T2-low asthma.
Prospective administration of inhaled fluticasone led to ICS-associated changes in sputum bacterial community structure, which was more divergent in the ICS non-responder group. This suggests possible off-target effects of inhaled corticosteroids, particularly in this cohort of predominantly T2-low asthmatics. While the treatment duration of six weeks was relatively short, our findings suggest the possibility that long-term ICS treatment in those unlikely to benefit could lead to persistent perturbation of the respiratory microbiome with potentially important clinical implications. Mechanisms for this are unclear. We previously found through in silico analysis a greater predictive capacity for xenobiotic biodegradation in bronchial microbiota of ICS non-responders (3). A recent report also suggests indirect mechanisms may play an important role, such as through ICS suppression of cathelicidin, an antimicrobial peptide, in the airways (42).
The important limitations of our multi-center study include the relatively small number of subjects in some of our subgroup analyses and the fact that determining cause-effect directionality of the relationships reported is inherently impossible in this clinical study. Sputum and oral samples both are also microbially complex and other non-bacterial microbiota were not assessed. Recently reported findings of differences in airway fungal composition associated with level of type 2 inflammation support further investigation into non-bacterial members of the respiratory microbiome (13).
In conclusion, in this cohort comprised of individuals with mild atopic asthma, atopy without asthma and non-atopic healthy subjects, we identified novel relationships between induced sputum or oral microbiota characteristics and immunologic features measured in both BAL and peripheral blood samples. Findings from this study are hypothesis-generating and invite further study of the role that bacterial microbiota found in these respiratory tract compartments may play in shaping host immunity and clinical phenotypes of asthma, particularly those characterized by T2-low airway inflammation.
Supplementary Material
Key messages:
Mild asthma subjects with T2-high airway inflammation displayed significantly lower sputum bacterial burden compared to T2-low subjects, mirroring previous findings in protected brush specimens.
Significant differences in sputum bacterial microbiota composition associated more with T2-low asthma phenotype, whereas differences in oral microbiota appeared more reflective of atopic status.
A subgroup of T2-low mild asthma subjects displayed elevations in several lung inflammatory mediators and an accompanying reduction in sputum bacterial diversity.
After inhaled corticosteroid treatment of mild asthmatics, the compositional structure of sputum microbiota demonstrated significantly greater deviation from baseline in ICS non-responders than responders.
Acknowledgements.
The authors wish to acknowledge all AsthmaNet site investigators, study coordinators and participants for their contributions to the parent study from which the data analyzed in this study derive.
Funding. The analyses performed in this study were supported by National Heart, Lung, and Blood Institute AsthmaNet (U10HL098107), and by R01AI129958 and R03HL13831 (both to YJH).
Abbreviations:
- AA
Atopic asthmatic subjects
- ANA
Atopic non-asthmatic subjects
- HC
Healthy control subjects
- ICS
Inhaled corticosteroid
- IS
Induced sputum
- OW
Oral wash
- BB
Bronchial brush
- OTU
Operational taxonomic unit
Footnotes
Publisher's Disclaimer: This is a PDF file of an unedited manuscript that has been accepted for publication. As a service to our customers we are providing this early version of the manuscript. The manuscript will undergo copyediting, typesetting, and review of the resulting proof before it is published in its final form. Please note that during the production process errors may be discovered which could affect the content, and all legal disclaimers that apply to the journal pertain.
Conflicts of interest: JD, LSC, SN, JG, AMD have no conflicts of interest related to this work. NRB, KMA, AB, SPP, CAS and SRW report grants from NIH. MC reports grants from NIH, ALA, personal fees from Aviragen, Boehringer-Ingelheim, Boston Scientific, Elsevier, Genentech, GSK, Holaira, and Teva and grants from Boehringer-Ingelheim, Genentech, GSK, Invion, Sanofi-Aventis, Vectura. E.I. reports personal fees from AstraZeneca, Novartis, Philips, Respironics, Regeneron Pharmaceuticals, Research in Real Life (RiRL), TEVA Specialty Pharmaceuticals, Bird Rock Bio, Nuvelution, Pharmaceuticals, Vitaeris, Inc, Sanofi, Merck, Entrinsic Health Solutions and GlaxoSmithKline; non-financial support from Boehringer Ingelheim, GlaxoSmithKline, Merck, Sunovion and TEVA Specialty Pharmaceuticals; grants from Sanofi, Genentech and Boehringer Ingelheim. MK reports grants from NIH; personal fees from Teva Pharmaceuticals, Astra Zeneca, FDA LABA Trials Joint DSMB and Elsevier; grants from Chiesi and Sanofi. RJM reports grants from NIH, personal fees from AstraZeneca, PMD Healthcare and Respiratory Effectiveness Group; from MedImmune and CHiesi FarmaceuticiSpA. DTM reports grants from NIH; non-financial support from GlaxoSmithKIlne, Merck and Boehringer Ingelheim. MEW has received personal fees from Sepracor/Sunovion, Asthmatx/BSCI, Merck, Regeneron, MedImmune, Ambitbio, Vectura, Sanofi, Teva, Mylan, AstraZeneca, Genentech, Meda, Theravance, Novartis, Boehringer Ingelheim, GlaxoSmithKline, Tunitas, and Gliacure. SEW has received grants from Sanofi, Genentech, AstraZeneca, GlaxoSmithKline, and Boehringer Ingelheim and has received personal fees from AstraZeneca, Aerocrine, GlaxoSmithKline, Actelion, and Boehringer Ingelheim. SVL reports grants from NIH/NIAID, NIH/NICHD, NIH/NIDA, Broad Foundation, Sloan Foundation, Pfizer Inc., Gilead Sciences and Janssen; personal fees from Janssen, Boston Consulting Group, Regeneron, MedImmune, Siolta Therapeutics; has a patent reductive prodrug cancer chemotherapy (Stan449-PRV) issued, a patent Combination antibiotic and antibody therapy for the treatment of Pseudomonas aeruginosa infection (WO 2010091189 A1) with royalties paid to KaloBios Inc., a patent therapeutic microbial consortium for induction of immune tolerance with royalties paid to Siolta Therapeutics, a patent systems and methods for detecting antibiotic resistance (WO 2012027302 A3) issued, a patent nitroreductase enzymes (US 7687474 B2) issued, a patent sinusitis diagnostics and treatments (WO 2013155370 A1) issued, and a patent methods and systems for phylogenetic analysis (US 20120264637 A1) issued; has Co-founded Siolta Therapeutics and is currently a board member, paid consultant for the company, and owns 25% stock. HAB has received grants including travel and lodging compensation from the NIH/NHBI and the NIH/NIAID and has received royalty payments from the McGraw-Hill Companies; he is a consultant for Siolta Therapeutics, Inc of San Francisco, CA. YJH has received grants from the NIH, the Michigan Institute of Health and Clinical Research, and travel compensation for lectures and committee work with the National Academies of Science, American Academy of Allergy, Asthma & Immunology, and the European Academy of Allergy, Asthma, and Clinical Immunology.
References:
- 1.Denner DR, Sangwan N, Becker JB, Hogarth DK, Oldham J, Castillo J, et al. Corticosteroid therapy and airflow obstruction influence the bronchial microbiome, which is distinct from that of bronchoalveolar lavage in asthmatic airways. The Journal of allergy and clinical immunology. 2015;137(5):1398–405.e3. [DOI] [PMC free article] [PubMed] [Google Scholar]
- 2.Durack J, Boushey HA, Lynch SV. Airway Microbiota and the Implications of Dysbiosis in Asthma. Current allergy and asthma reports. 2016;16(8):52. [DOI] [PubMed] [Google Scholar]
- 3.Durack J, Lynch SV, Nariya S, Bhakta NR, Beigelman A, Castro M, et al. Features of the bronchial bacterial microbiome associated with atopy, asthma, and responsiveness to inhaled corticosteroid treatment. The Journal of allergy and clinical immunology. 2017;140(1):63–75. [DOI] [PMC free article] [PubMed] [Google Scholar]
- 4.Goleva E, Jackson LP, Kirk Harris J, Robertson CE, Sutherland ER, Hall CF, et al. The Effects of Airway Microbiome on Corticosteroid Responsiveness in Asthma. Am J Respir Crit Care Med. 2013;188(10):1193–201. [DOI] [PMC free article] [PubMed] [Google Scholar]
- 5.Hilty M, Burke C, Pedro H, Cardenas P, Bush A, Bossley C, et al. Disordered Microbial Communities in Asthmatic Airways. PLoS One. 2010;5(1):e8578. [DOI] [PMC free article] [PubMed] [Google Scholar]
- 6.Huang YJ, Nariya S, Harris JM, Lynch SV, Choy DF, Arron JR, et al. The airway microbiome in patients with severe asthma: associations with disease features and severity. The Journal of allergy and clinical immunology. 2015;136(4):874–84. [DOI] [PMC free article] [PubMed] [Google Scholar]
- 7.Huang YJ, Nelson CE, Brodie EL, Desantis TZ, Baek MS, Liu J, et al. Airway microbiota and bronchial hyperresponsiveness in patients with suboptimally controlled asthma. The Journal of allergy and clinical immunology. 2011;127(2):372–81.e1–3. [DOI] [PMC free article] [PubMed] [Google Scholar]
- 8.Pavord ID, Beasley R, Agusti A, Anderson GP, Bel E, Brusselle G, et al. After asthma: redefining airways diseases. Lancet. 2018;391(10118):350–400. [DOI] [PubMed] [Google Scholar]
- 9.Demarche S, Schleich F, Henket M, Paulus V, Van Hees T, Louis R. Detailed analysis of sputum and systemic inflammation in asthma phenotypes: are paucigranulocytic asthmatics really non-inflammatory? BMC Pulmonary Medicine. 2016;16(1):46. [DOI] [PMC free article] [PubMed] [Google Scholar]
- 10.Ndum O, Huang YJ. Asthma phenotypes and the microbiome. EMJ Allergy Immunol. 2016;1(1):82–90. [Google Scholar]
- 11.Sverrild A, Kiilerich P, Brejnrod A, Pedersen R, Porsbjerg C, Bergqvist A, et al. Eosinophilic airway inflammation in asthmatic patients is associated with an altered airway microbiome. Journal of Allergy and Clinical Immunology. 2017;140(2):407–17.e11. [DOI] [PubMed] [Google Scholar]
- 12.Turturice BA, McGee HS, Oliver B, Baraket M, Nguyen BT, Ascoli C, et al. Atopic asthmatic immune phenotypes associated with airway microbiota and airway obstruction. PLOS ONE. 2017;12(10):e0184566. [DOI] [PMC free article] [PubMed] [Google Scholar]
- 13.Sharma A, Laxman B, Naureckas ET, Hogarth DK, Sperling AI, Solway J, et al. Associations between fungal and bacterial microbiota of airways and asthma endotypes. The Journal of allergy and clinical immunology. 2019;144(5):1214–27.e7. [DOI] [PMC free article] [PubMed] [Google Scholar]
- 14.Simpson JL, Daly J, Baines KJ, Yang IA, Upham JW, Reynolds PN, et al. Airway dysbiosis: Haemophilus influenzae and Tropheryma in poorly controlled asthma. The European respiratory journal. 2016;47. [DOI] [PubMed] [Google Scholar]
- 15.Zhang Q, Cox M, Liang Z, Brinkmann F, Cardenas PA, Duff R, et al. Airway Microbiota in Severe Asthma and Relationship to Asthma Severity and Phenotypes. PLoS One. 2016;11(4):e0152724. [DOI] [PMC free article] [PubMed] [Google Scholar]
- 16.Durack J, Boushey HA, Huang YJ. Incorporating the airway microbiome into asthma phenotyping: Moving toward personalized medicine for noneosinophilic asthma. The Journal of allergy and clinical immunology. 2018;141(1):82–3. [DOI] [PMC free article] [PubMed] [Google Scholar]
- 17.Green BJ, Wiriyachaiporn S, Grainge C, Rogers GB, Kehagia V, Lau L, et al. Potentially Pathogenic Airway Bacteria and Neutrophilic Inflammation in Treatment Resistant Severe Asthma. PLoS One. 2014;9(6):e100645. [DOI] [PMC free article] [PubMed] [Google Scholar]
- 18.Taylor SL, Leong LEX, Choo JM, Wesselingh S, Yang IA, Upham JW, et al. Inflammatory phenotypes in patients with severe asthma are associated with distinct airway microbiology. The Journal of allergy and clinical immunology. 2017;S0091–6749(17):30743–1. [DOI] [PubMed] [Google Scholar]
- 19.Dzidic M, Abrahamsson TR, Artacho A, Collado MC, Mira A, Jenmalm MC. Oral microbiota maturation during the first 7 years of life in relation to allergy development. Allergy. 2018;73(10):2000–11. [DOI] [PubMed] [Google Scholar]
- 20.Durack J, Huang YJ, Nariya S, Christian LS, Mark Ansel K, Beigelman A, et al. Bacterial biogeography of adult airways in atopic asthma. Microbiome. 2018;6(1):104. [DOI] [PMC free article] [PubMed] [Google Scholar]
- 21.Bhakta NR, Solberg OD, Nguyen CP, Nguyen CN, Arron JR, Fahy JV, et al. A qPCR-based metric of Th2 airway inflammation in asthma. Clin Transl Allergy. 2013;3:24. [DOI] [PMC free article] [PubMed] [Google Scholar]
- 22.Woodruff PG, Boushey HA, Dolganov GM, Barker CS, Yang YH, Donnelly S, et al. Genome-wide profiling identifies epithelial cell genes associated with asthma and with treatment response to corticosteroids. Proc Natl Acad Sci USA. 2007;104(40):15858–68. [DOI] [PMC free article] [PubMed] [Google Scholar]
- 23.Woodruff PG, Modrek B, Choy DF, Jia G, Abbas AR, Ellwanger A, et al. T-helper type 2-driven inflammation defines major subphenotypes of asthma. Am J Respir Crit Care Med. 2009;180. [DOI] [PMC free article] [PubMed] [Google Scholar]
- 24.Ramstein J, Broos CE, Simpson LJ, Ansel KM, Sun SA, Ho ME, et al. IFN-γ-Producing T-Helper 17.1 Cells Are Increased in Sarcoidosis and Are More Prevalent than T-Helper Type 1 Cells. American journal of respiratory and critical care medicine. 2016;193(11):1281–91. [DOI] [PMC free article] [PubMed] [Google Scholar]
- 25.Caporaso JG, Kuczynski J, Stombaugh J, Bittinger K, Bushman FD, Costello EK, et al. QIIME allows analysis of high-throughput community sequencing data. Nature methods. 2010;7. [DOI] [PMC free article] [PubMed] [Google Scholar]
- 26.Edgar RC. Search and clustering orders of magnitude faster than BLAST. Bioinformatics (Oxford, England). 2010;26(19):2460–1. [DOI] [PubMed] [Google Scholar]
- 27.DeSantis TZ, Hugenholtz P, Larsen N, Rojas M, Brodie EL, Keller K, et al. Greengenes, a chimera-checked 16S rRNA gene database and workbench compatible with ARB. Applied and environmental microbiology. 2006;72(7):5069–72. [DOI] [PMC free article] [PubMed] [Google Scholar]
- 28.Benjamini Y, Hochberg Y. Controlling the False Discovery Rate: A Practical and Powerful Approach to Multiple Testing. Journal of the Royal Statistical Society Series B (Methodological). 1995;57(1):289–300. [Google Scholar]
- 29.Anderson MJ. A new method for non-parametric multivariate analysis of variance. Austral Ecology. 2001;26(1):32–46. [Google Scholar]
- 30.Anderson MJ. Permutational Multivariate Analysis of Variance (PERMANOVA). Wiley Online Library; (2017). Available at: https://onlinelibrary.wiley.com/doi/abs/10.1002/9781118445112.stat07841 [Google Scholar]
- 31.Diniz-Filho JAF, Soares TN, Lima JS, Dobrovolski R, Landeiro VL, de Campos Telles MP, et al. Mantel test in population genetics. Genetics and Molecular Biology. 2013;36(4):475–85. [DOI] [PMC free article] [PubMed] [Google Scholar]
- 32.Dickson RP, Erb-Downward JR, Freeman CM, McCloskey L, Falkowski NR, Huffnagle GB, et al. Bacterial Topography of the Healthy Human Lower Respiratory Tract. MBio. 2017;8(1). [DOI] [PMC free article] [PubMed] [Google Scholar]
- 33.Marri PR, Stern DA, Wright AL, Billheimer D, Martinez FD. Asthma-associated differences in microbial composition of induced sputum. The Journal of allergy and clinical immunology. 2013;131(2):346–52.e1–3. [DOI] [PMC free article] [PubMed] [Google Scholar]
- 34.Zhou Y, Jackson D, Bacharier LB, Mauger D, Boushey H, Castro M, et al. The upper-airway microbiota and loss of asthma control among asthmatic children. Nat Commun. 2019;10(1):5714. [DOI] [PMC free article] [PubMed] [Google Scholar]
- 35.McCauley K, Durack J, Valladares R, Fadrosh DW, Lin DL, Calatroni A, et al. Distinct nasal airway bacterial microbiotas differentially relate to exacerbation in pediatric patients with asthma. The Journal of allergy and clinical immunology. 2019;144(5):1187–97. [DOI] [PMC free article] [PubMed] [Google Scholar]
- 36.Jevnikar Z, Östling J, Ax E, Calvén J, Thörn K, Israelsson E, et al. Epithelial IL-6 trans-signaling defines a new asthma phenotype with increased airway inflammation. Journal of Allergy and Clinical Immunology. 2018. [DOI] [PubMed] [Google Scholar]
- 37.Coquet JM, Schuijs MJ, Smyth MJ, Deswarte K, Beyaert R, Braun H, et al. Interleukin-21-Producing CD4(+) T Cells Promote Type 2 Immunity to House Dust Mites. Immunity. 2015;43(2):318–30. [DOI] [PubMed] [Google Scholar]
- 38.Halwani R, Sultana A, Vazquez-Tello A, Jamhawi A, Al-Masri AA, Al-Muhsen S. Th-17 regulatory cytokines IL-21, IL-23, and IL-6 enhance neutrophil production of IL-17 cytokines during asthma. The Journal of asthma : official journal of the Association for the Care of Asthma. 2017;54(9):893–904. [DOI] [PubMed] [Google Scholar]
- 39.Kelly EAB, Koziol-White CJ, Clay KJ, Liu LY, Bates ME, Bertics PJ, et al. Potential contribution of IL-7 to allergen-induced eosinophilic airway inflammation in asthma. Journal of immunology (Baltimore, Md : 1950). 2009;182(3):1404–10. [DOI] [PMC free article] [PubMed] [Google Scholar]
- 40.Yeon SM, Halim L, Chandele A, Perry CJ, Kim SH, Kim SU, et al. IL-7 plays a critical role for the homeostasis of allergen-specific memory CD4 T cells in the lung and airways. Sci Rep. 2017;7(1):11155. [DOI] [PMC free article] [PubMed] [Google Scholar]
- 41.Liu S, Verma M, Michalec L, Liu W, Sripada A, Rollins D, et al. Steroid resistance of airway type 2 innate lymphoid cells from patients with severe asthma: The role of thymic stromal lymphopoietin. The Journal of allergy and clinical immunology. 2018;141(1):257–68.e6. [DOI] [PMC free article] [PubMed] [Google Scholar]
- 42.Singanayagam A, Glanville N, Cuthbertson L, Bartlett NW, Finney LJ, Turek E, et al. Inhaled corticosteroid suppression of cathelicidin drives dysbiosis and bacterial infection in chronic obstructive pulmonary disease. Sci Transl Med. 2019. August 28;11(507). pii: eaav3879. [DOI] [PMC free article] [PubMed] [Google Scholar]
Associated Data
This section collects any data citations, data availability statements, or supplementary materials included in this article.