Abstract
Suppressing cellular signal transducers of transcription 2 (STAT2) is a common strategy viruses use to establish infections, yet the detailed mechanism remains elusive due to lack of structural information of the viral-cellular complex involved. Here, we report the cryo-EM and crystal structures of human STAT2 (hSTAT2) in complex with the non-structural protein 5 (NS5) of Zika virus (ZIKV) and dengue virus (DENV), revealing two-pronged interactions between NS5 and hSTAT2. First, the NS5 methyltransferase and RNA-dependent RNA polymerase (RdRP) domains form a conserved inter-domain cleft harboring the coiled-coil domain of hSTAT2, thus preventing association of hSTAT2 with interferon regulatory factor 9. Second, the NS5 RdRP domain also binds the N-terminal domain of hSTAT2. Disruption of these ZIKV NS5–hSTAT2 interactions compromised NS5-mediated hSTAT2 degradation and interferon suppression, and viral infection under interferon-competent condition. Taken together, these results clarify the mechanism underlying the functional antagonism of STAT2 by both ZIKV and DENV.
Introduction
Type I interferon (IFN)-mediated innate immune response constitutes the first line of host defense against viral infection1. Induction of type I IFN signaling requires activation of the signal transducers of transcription 2 (STAT2), which triggers the expression of hundreds of IFN-stimulated genes (ISGs)2 to inhibit infection. To achieve successful infection, viruses thus must suppress activation of STAT2-triggered IFN responses3. Mechanistic understanding of this “arms race” between hosts and viruses is essential for the development of novel therapeutic strategies against viral infections.
STAT2 belongs to the seven-membered STAT family of transcriptional regulators4, containing an N-terminal domain (ND), a coiled-coil domain (CCD), a DNA binding domain (DBD), a linker domain (LD), a SRC homology 2 (SH2) domain, a tyrosine-phosphorylation (pY) site-containing tail segment, and a transcriptional activation domain (TAD) (Fig. 1a). STAT2-mediated transcriptional activation involves tyrosine phosphorylation of STAT2 by the Janus kinases (JAKs), followed by formation of a STAT1–STAT2 dimer via a mutual SH2–pY interaction5. In addition, the interaction between STAT2 and IFN regulatory factor 9 (IRF9) further mediates the formation of the IFN-stimulated gene factor-3 (ISGF3) complex6–8, which translocates to the nucleus to stimulate expression of antiviral genes9.
Figure 1. Crystal structure of the RdRP domain of ZIKV NS5 complexed with hSTAT21–713.
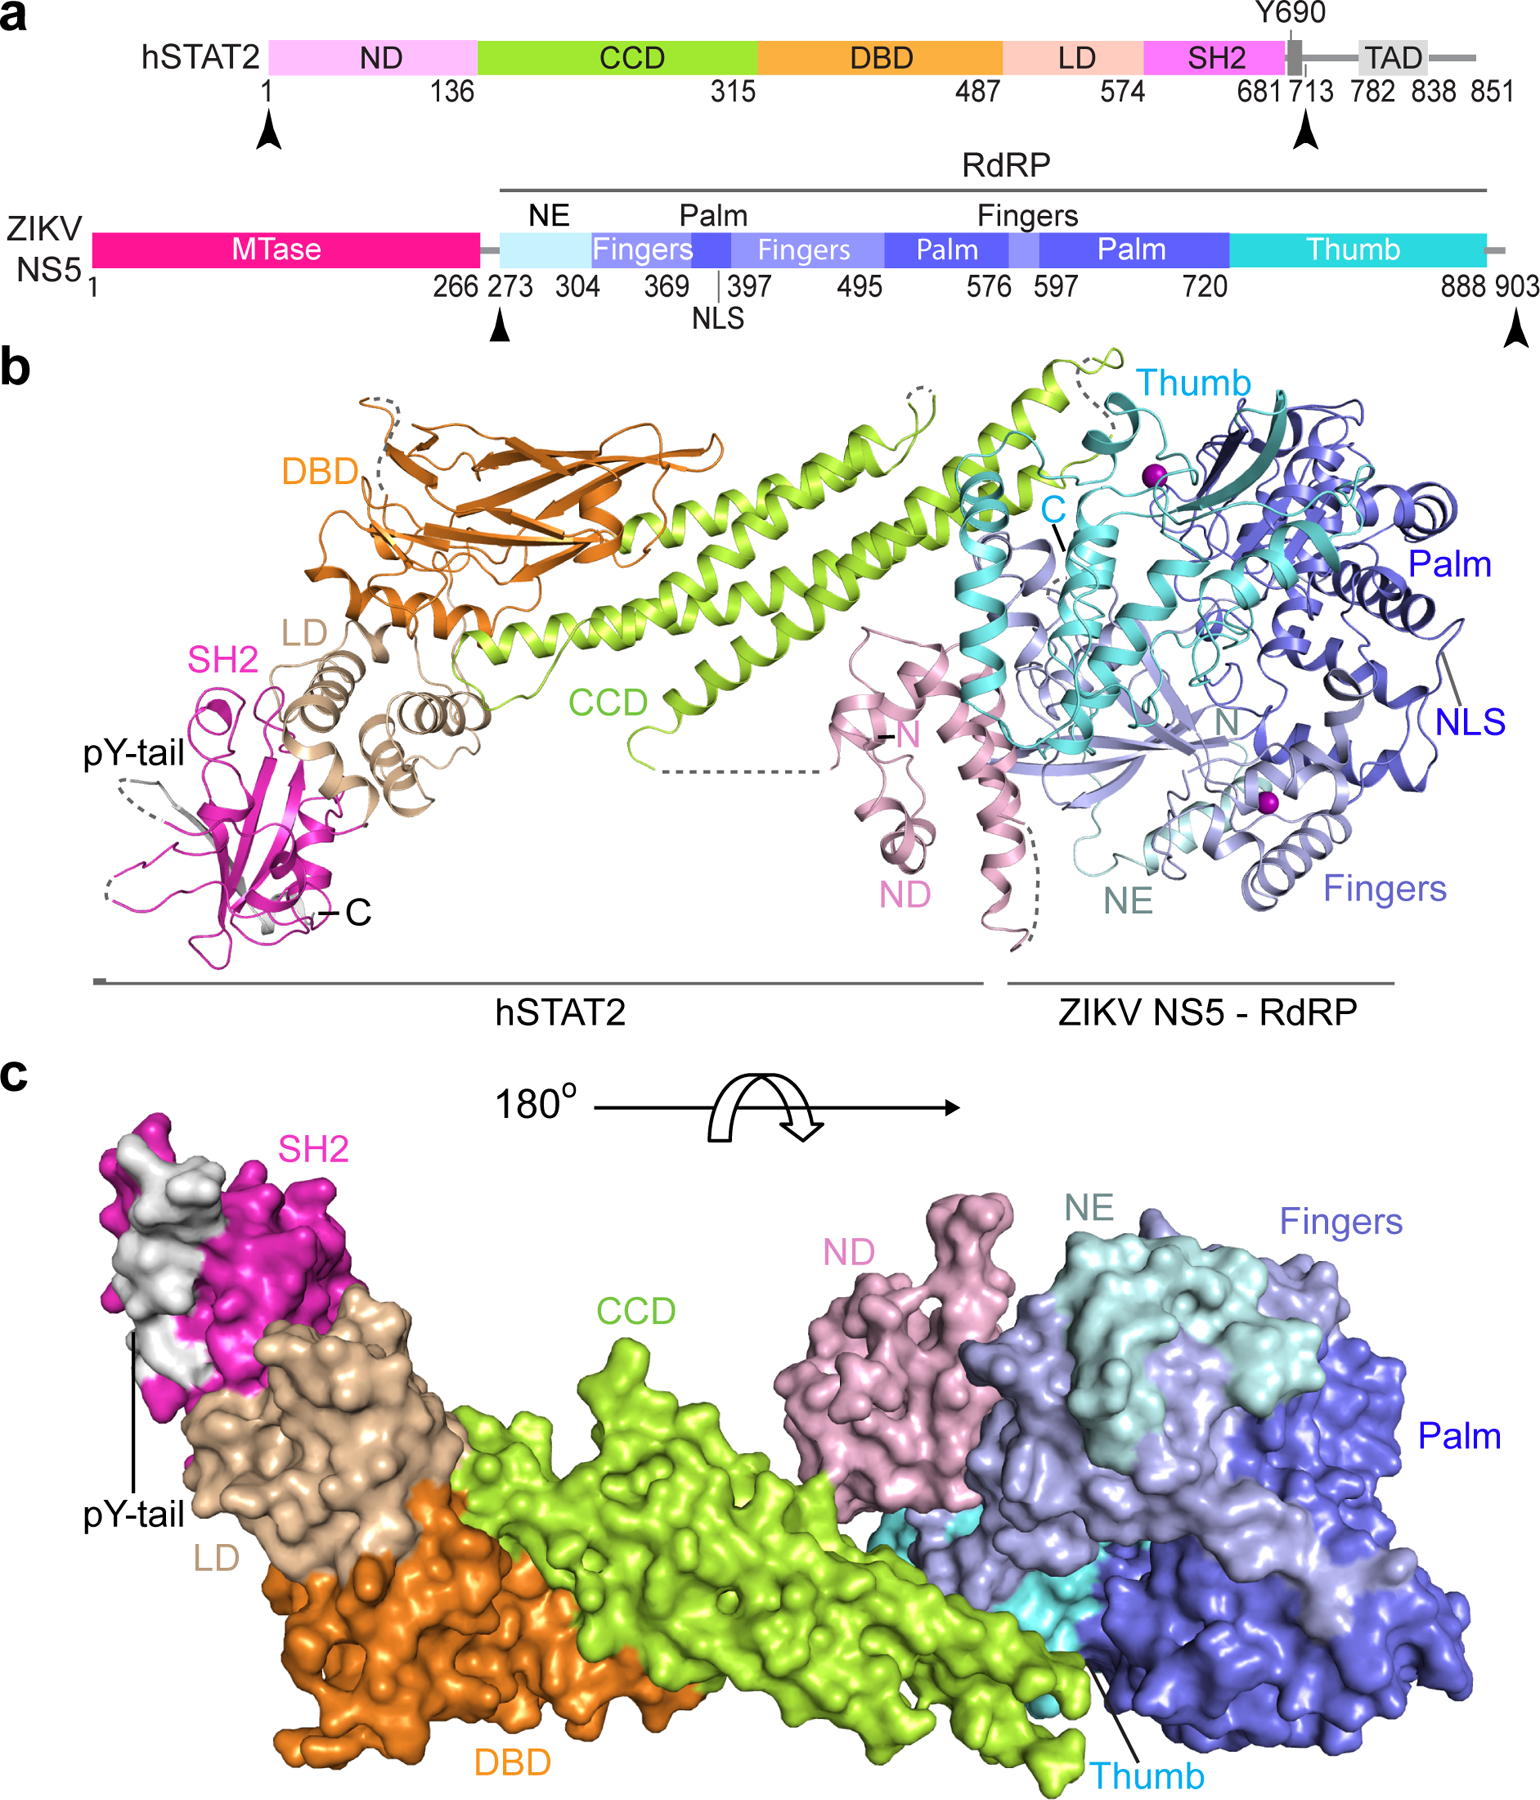
a, ZIKV NS5 and hSTAT2 primary sequences with domains used for crystallization marked with arrowheads. NLS, nuclear localization signal. b, Ribbon representation of the ZIKV RdRP–hSTAT21–713 complex. The disordered linkers are shown as dashed lines. c, Surface representation of the ZIKV RdRP–hSTAT21–713 complex. The color scheme in (a-c) is applied to subsequent figures unless otherwise indicated.
To establish viral infection, viruses have evolved a variety of STAT2 suppression schemes3. Prominent examples include dengue virus (DENV) and Zika virus (ZIKV), members of the Flavivirus genus of the Flaviviridae family. Both ZIKV and DENV pose serious threats to global public health—ZIKV infection during recent epidemics is linked to neurological disorders such as congenital microcephaly10 and Guillain–Barré syndrome11; and DENV infection is associated with dengue hemorrhagic fever12. But neither antiviral therapeutics nor vaccines are currently available against ZIKV and DENV infections. Both viruses employ their respective non-structural protein 5 (NS5) to suppress human STAT2 (hSTAT2)-mediated IFN response13–15. NS5 contains an N-terminal methyltransferase (MTase) domain that catalyzes viral RNA capping, and an RNA-dependent RNA polymerase (RdRP) domain that is responsible for replicating the viral genome16. These NS5 proteins directly bind to hSTAT2 and promote its degradation through the proteasome-mediated pathway13, 14. However, due to lack of structural information about the NS5–hSTAT2 complexes, the mechanism underlying this NS5-mediated hSTAT2 degradation and IFN suppression remains elusive, limiting our ability to target NS5–hSTAT2 interactions for antiviral intervention.
In this study, we have determined the crystal and cryo electron microscopy (cryo-EM) structures of ZIKV NS5 in complex with hSTAT2, revealing multivalent interactions between ZIKV NS5 and hSTAT2. Structure-guided functional analyses revealed that these interactions compete against the hSTAT2–IRF9 association, and are essential for degradation of hSTAT2, suppression of type I IFN responses, and efficient viral infection. Furthermore, our EM study of the DENV NS5–hSTAT2 complex, together with cellular assays, demonstrates that DENV NS5 interacts with hSTAT2 in a similar fashion as ZIKV NS5, suggesting a conserved hSTAT2-NS5 engaging mechanism in the two flaviviruses. Together, these studies provide key insights into the interactions between viral antagonists and STATs, and a framework for rational designs of vaccines and antivirals.
Results
Crystal structure of the ZIKV RdRP–hSTAT2 complex
To define the atomic details of the ZIKV NS5–hSTAT2 interaction, we co-crystalized the ZIKV RdRP domain with a fragment of hSTAT2 (residues 1–713; hSTAT21–713) and solved the structure at 3.0 Å resolution (Fig. 1b,c, Table 1 and Supplementary Video 1). We were able to trace NS5 RdRP, the core fragment (CF, residues 137–680) and the pY-tail segment (residues 690–705) of hSTAT2, along with partial hSTAT2 ND (residues 24–68 and residues 76–112) (Fig. 1b,c). The CF of hSTAT2 assumes an elongated fold, similar to that of STAT117, 18 and other STAT proteins19–21, with the CCD, DBD, LD and SH2 domains sequentially packed against each other to form an integrated core. Structural alignment of the hSTAT2 CF with the corresponding region of hSTAT1 gives a root-mean-square deviation (RMSD) of 0.57 Å over 404 Cα atoms, in line with the ~40% sequence identity between the CFs of these two proteins (Supplementary Fig. 1). The RdRP domain adopts a right-hand cup fold composed of palm, fingers and thumb subdomains with two zinc finger clusters, as previously observed (Fig. 1b and Extended Data Fig. 1a)22–25. Association of hSTAT2 with NS5 RdRP is mediated by the CCD of hSTAT2, which fills in a surface groove next to the RNA entrance tunnel of ZIKV RdRP (Extended Data Fig. 1b,c). In addition, the ND of hSTAT2 joins the rest of hSTAT2 only through an unresolved flexible linker and docks at the outer wall of the RNA exit tunnel of ZIKV RdRP (Extended Data Fig. 1b,d), yielding an average B-factor (~123 Å2) significantly higher than the rest of the complex (~67 Å2).
Table 1.
X-ray crystallography data collection and refinement statistics
| ZIKV RdRP - hSTAT21–713
(PDB 6UX2) |
|
|---|---|
| Data collection | |
| Space group | P1 21 1 |
| Cell dimensions | |
| a, b, c (Å) | 85.11, 124.7, 84.78 |
| α, β, γ (°) | 90, 109.39, 90 |
| Resolution (Å) | 50.00–3.00 (3.11–3.00)a |
| Rmerge | 0.126 (0.696) |
| I/σ(I) | 10.26 (1.67) |
| CC1/2 | 0.996 (0.813) |
| Completeness (%) | 97.86 (83.07) |
| Redundancy | 6.0 (5.0) |
| Refinement | |
| Resolution (Å) | 49.24–3.01 (3.12–3.01) |
| No. reflections | 32543 (2733) |
| Rwork / Rfree | 24.2/26.4 (35.6/37.8) |
| No. atoms | |
| Protein | 9260 |
| Ion (zinc, sulfate) | 22 |
| Water | 83 |
| B factors (Å2) | |
| Protein | 69.82 |
| Ligand/ion | 89.00 |
| Water | 56.40 |
| R.m.s. deviations | |
| Bond lengths (Å) | 0.006 |
| Bond angles (°) | 1.00 |
Values in parentheses are for highest-resolution shell.
The pY-tail segment of hSTAT2 forms a β-strand that augments in antiparallel the β-sheet of the SH2 domain, with the side chain of its R694 forming a salt bridge with a sulfate ion embedded in the pY-engaging pocket of SH2. The same sulfate ion also engages a salt bridge with the potential pY-binding residue R601, mimicking the interaction between SH2 and the phosphate group of pY26 (Extended Data Fig. 2a,b). Therefore, this intramolecular association of hSTAT2 potentially occludes the hSTAT2 SH2 domain from accessing other pY-containing fragments. At the N-terminus of the tail segment, the phosphorylation target Y690 is free of phosphorylation and in contact with SH2 residues H647 and Q649 through side-chain hydrogen bonding interactions (Extended Data Fig. 2a). These observations rationalize why dimerization of STAT2 with STAT1 entails the phosphorylation of STAT2 Y69027, which presumably facilitates the displacement of the hSTAT2 pY-tail segment from the SH2 domain in cis.
It has been demonstrated that the pY-tail segment mediates homodimerization of STAT1, STAT3 and STAT6 proteins through both the reciprocal SH2–pY interaction and antiparallel tail-pairing17, 19, 20. Given that the pY-tail segment of hSTAT2 bears high sequence homology with the corresponding fragments of STAT1 and other STAT family members (Extended Data Fig. 2c), it is conceivable that STAT2 heterodimerizes with STAT1 in a similar fashion as homodimerization of STAT1. Along the line, we built a model of the ZIKV NS5–hSTAT2–hSTAT1-DNA complex based on the structure of the hSTAT1 homodimer and the ZIKV NS5–hSTAT2 complexes (Extended Data Fig. 2d). The structural model of the ZIKV NS5–hSTAT2–hSTAT1–DNA complex suggests that hSTAT2 interacts with NS5 and DNA via distinct regions (Extended Data Fig. 2d). The hSTAT2 DBD, like the corresponding region of hSTAT1, participates in DNA binding, through a positively charged surface (Extended Data Fig. 2d).
Cryo-EM structure of full-length ZIKV NS5–hSTAT2 complex
To investigate how full-length ZIKV NS5 interacts with hSTAT2, we also determined the structure of full-length NS5 in complex with hSTAT21–713 using cryo-EM at 4.0 Å resolution (Fig. 2a,b, Table 2, Extended Data Fig. 3,4, Supplementary Video 2 and Supplementary Fig. 2). Due to structural flexibility and the existence of multiple conformations, the cryo-EM structure has resolutions varying from 3.5–4.0 Å for CCD, MTase and RdRP, to 4.0–5.0 Å for DBD, and 5.0–7.5 Å for LD and SH2 (Extended Data Fig. 3c). The cryo-EM map is of sufficient quality to allow atomic modeling of CCD, DBD and partial LD of hSTAT2, and both the MTase and RdRP domains of NS5 (Fig. 2a,b and Extended Data Fig. 4). Except for the MTase domain, these individual domains have been modeled in our crystal structure of NS5-RdRP – hSTAT21–713, which matches well with the cryo-EM density map (Extended Data Fig. 4). This fitting also reveals the densities corresponding to the MTase domain24. The atomic model of NS5–hSTAT21–713 shows that the tip of hSTAT2 CCD is anchored at the inter-domain cleft formed between the MTase and RdRP domains of NS5 (Fig. 2a,b). This observation, consistent with our domain mapping analyses ex vivo and in vitro (Extended Data Fig. 5), suggest that both the MTase and RdRP domains of NS5 interact with hSTAT2. Structural comparison of hSTAT2-bound NS5 with the previously reportedly free state23–25 reveals a similar domain orientation between the MTase and RdRP domains (Extended Data Fig. 6a,b), with an RMSD of 2.3 Å over 778 aligned Cα atoms. The major difference between the two states concerns a slight movement of the MTase domain toward the hSTAT2 CCD in the hSTAT2-bound state (Extended Data Fig. 6b). The lack of major changes in the NS5 structure between the two states implies that ZIKV NS5 has evolved with a conformation well poised for interaction with hSTAT2.
Figure 2. Cryo-EM structure of the full-length ZIKV NS5–hSTAT21–713 complex.
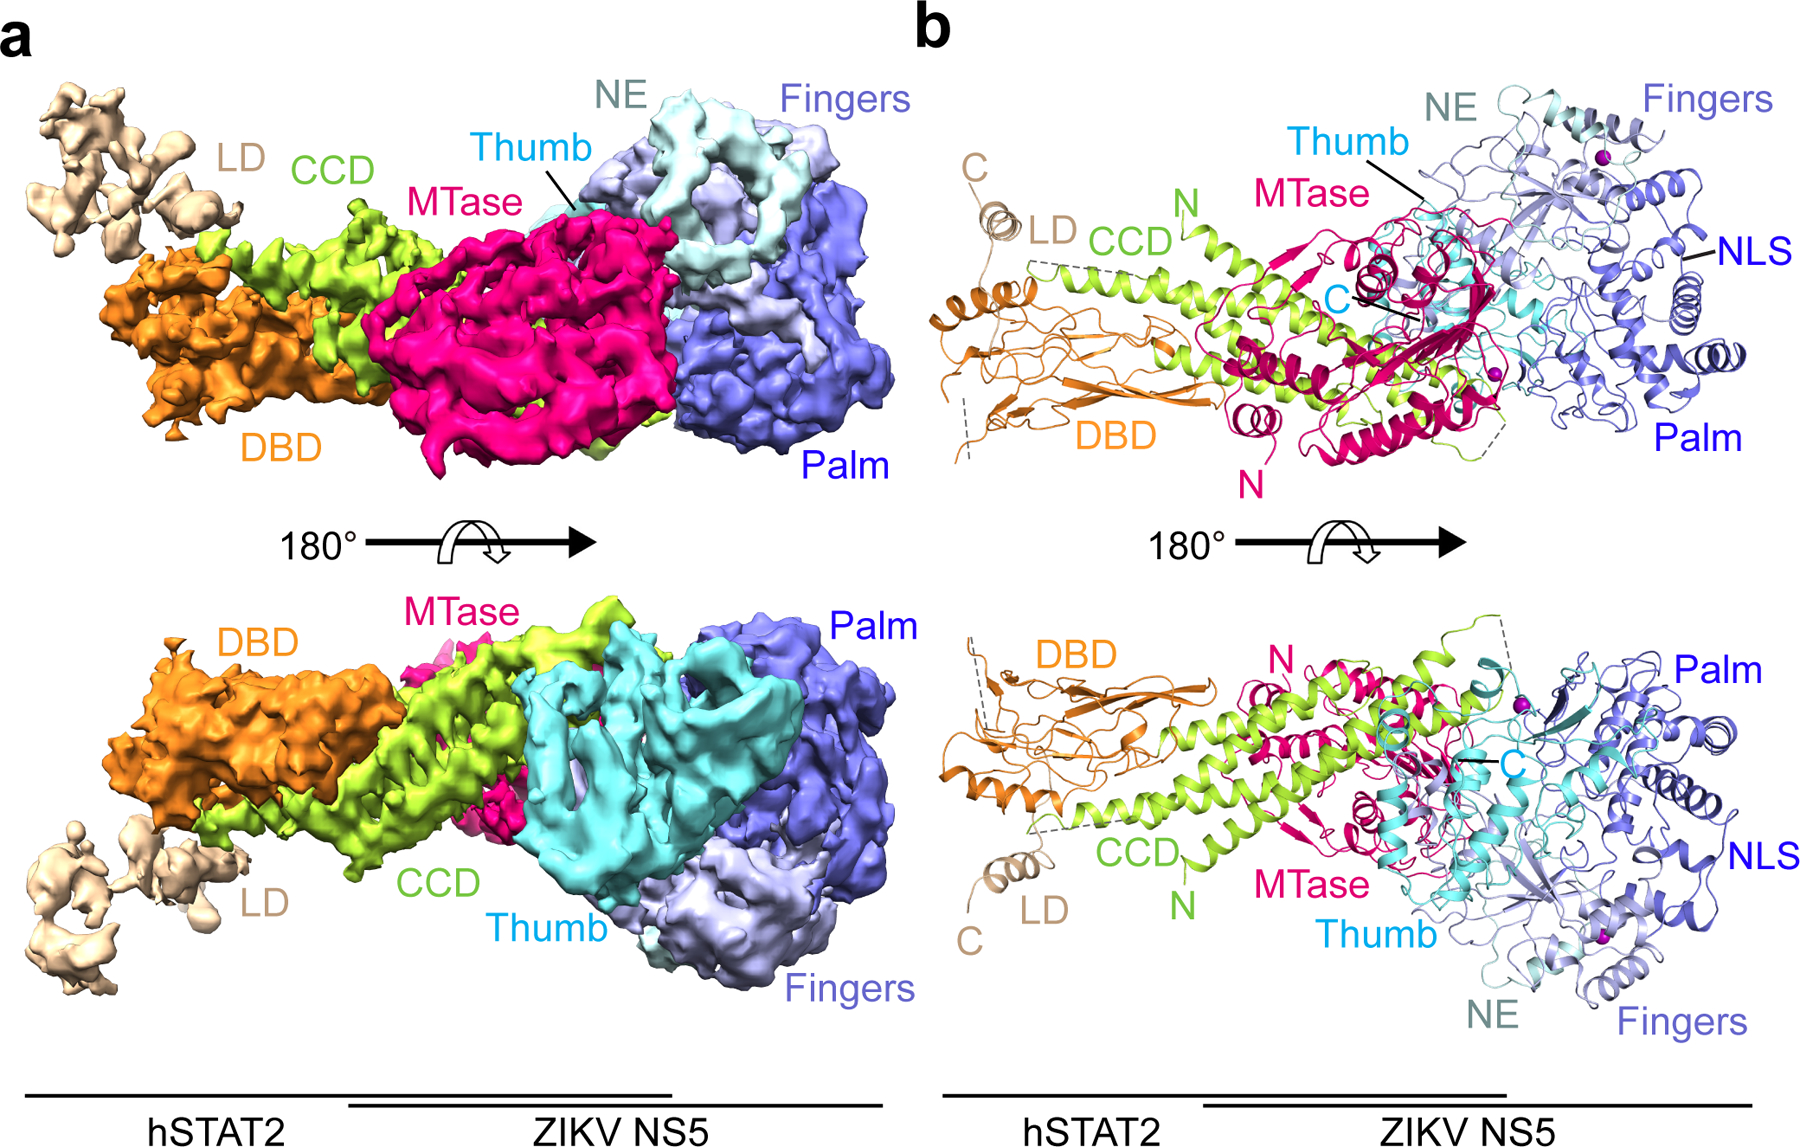
a, b, Shaded surface views of the cryo-EM density map (a) and ribbon representation of the atomic model (b) of the ZIKV NS5–hSTAT21–713 complex from opposite sides.
Table 2.
Cryo-EM data collection, refinement and validation statistics
| ZIKV NS5 – hSTAT2 (EMD-21618, PDB 6WCZ) |
|
|---|---|
| Data collection and processing | |
| Magnification | x130,000 |
| Voltage (kV) | 300 |
| Electron exposure (e–/Å2) | 48 |
| Defocus range (μm) | 1.0 – 3.0 |
| Pixel size (Å) | 1.07 |
| Symmetry imposed | C1 |
| Initial particle images (no.) | 868,048 |
| Final particle images (no.) | 118,760 |
| Map resolution (Å) | 4.0 |
| FSC threshold | 0.143 |
| Map resolution range (Å) | 7.0 – 3.5 |
| Refinement | |
| Initial model used | 6UX2 |
| Model resolution (Å) | 4.0 |
| FSC threshold | 0.143 |
| Model resolution range (Å) | 274 – 4.0 |
| Map sharpening B factor (Å2) | −167 |
| Model composition | |
| Non-hydrogen atoms | 9,893 |
| Protein residues | 1,231 |
| Ion (zinc) | 2 |
| B factors (Å2) | |
| Protein | 153.77 |
| Ion (zinc) | 106.22 |
| R.m.s. deviations | |
| Bond lengths (Å) | 0.01 |
| Bond angles (°) | 1.01 |
| Validation | |
| MolProbity score | 2.55 |
| Clashscore | 13.3 |
| Poor rotamers (%) | 2.08 |
| Ramachandran plot | |
| Favored (%) | 86.98 |
| Allowed (%) | 13.02 |
| Disallowed (%) | 0 |
The ZIKV RdRP–hSTAT2 association is mediated by complementarity between the convex surfaces formed by the helical ND and CCD of hSTAT2 and two separate surface grooves of RdRP (Fig. 3a–c). Of particular note are the aromatic ring stacking between hSTAT2 F175 and RdRP H855, and the hydrogen bonds between R176 from hSTAT2 CCD and RdRP residues, including the one with the backbone of G850 and the bidentate one with the side chain of D734 (Fig. 3b and Extended Data Fig. 1c). These interactions are reinforced by van der Waals contacts involving Q165, D168, Q169, D171, V172, I179, E195 and T202 of hSTAT2 CCD and V335-T337, L847, W848 and L852 of RdRP (Fig. 3b). At the second interface, hSTAT2 ND approaches the RdRP through van der Waals and hydrogen bonding interactions involving D53, F61, R92, Q95, S98 and Q99 of hSTAT2 ND and T314, S317, V322, R327, A343 and I750 of RdRP (Fig. 3c and Extended Data Fig. 1d).
Figure 3. Cellular analysis of the ZIKV NS5–hSTAT2 interaction.
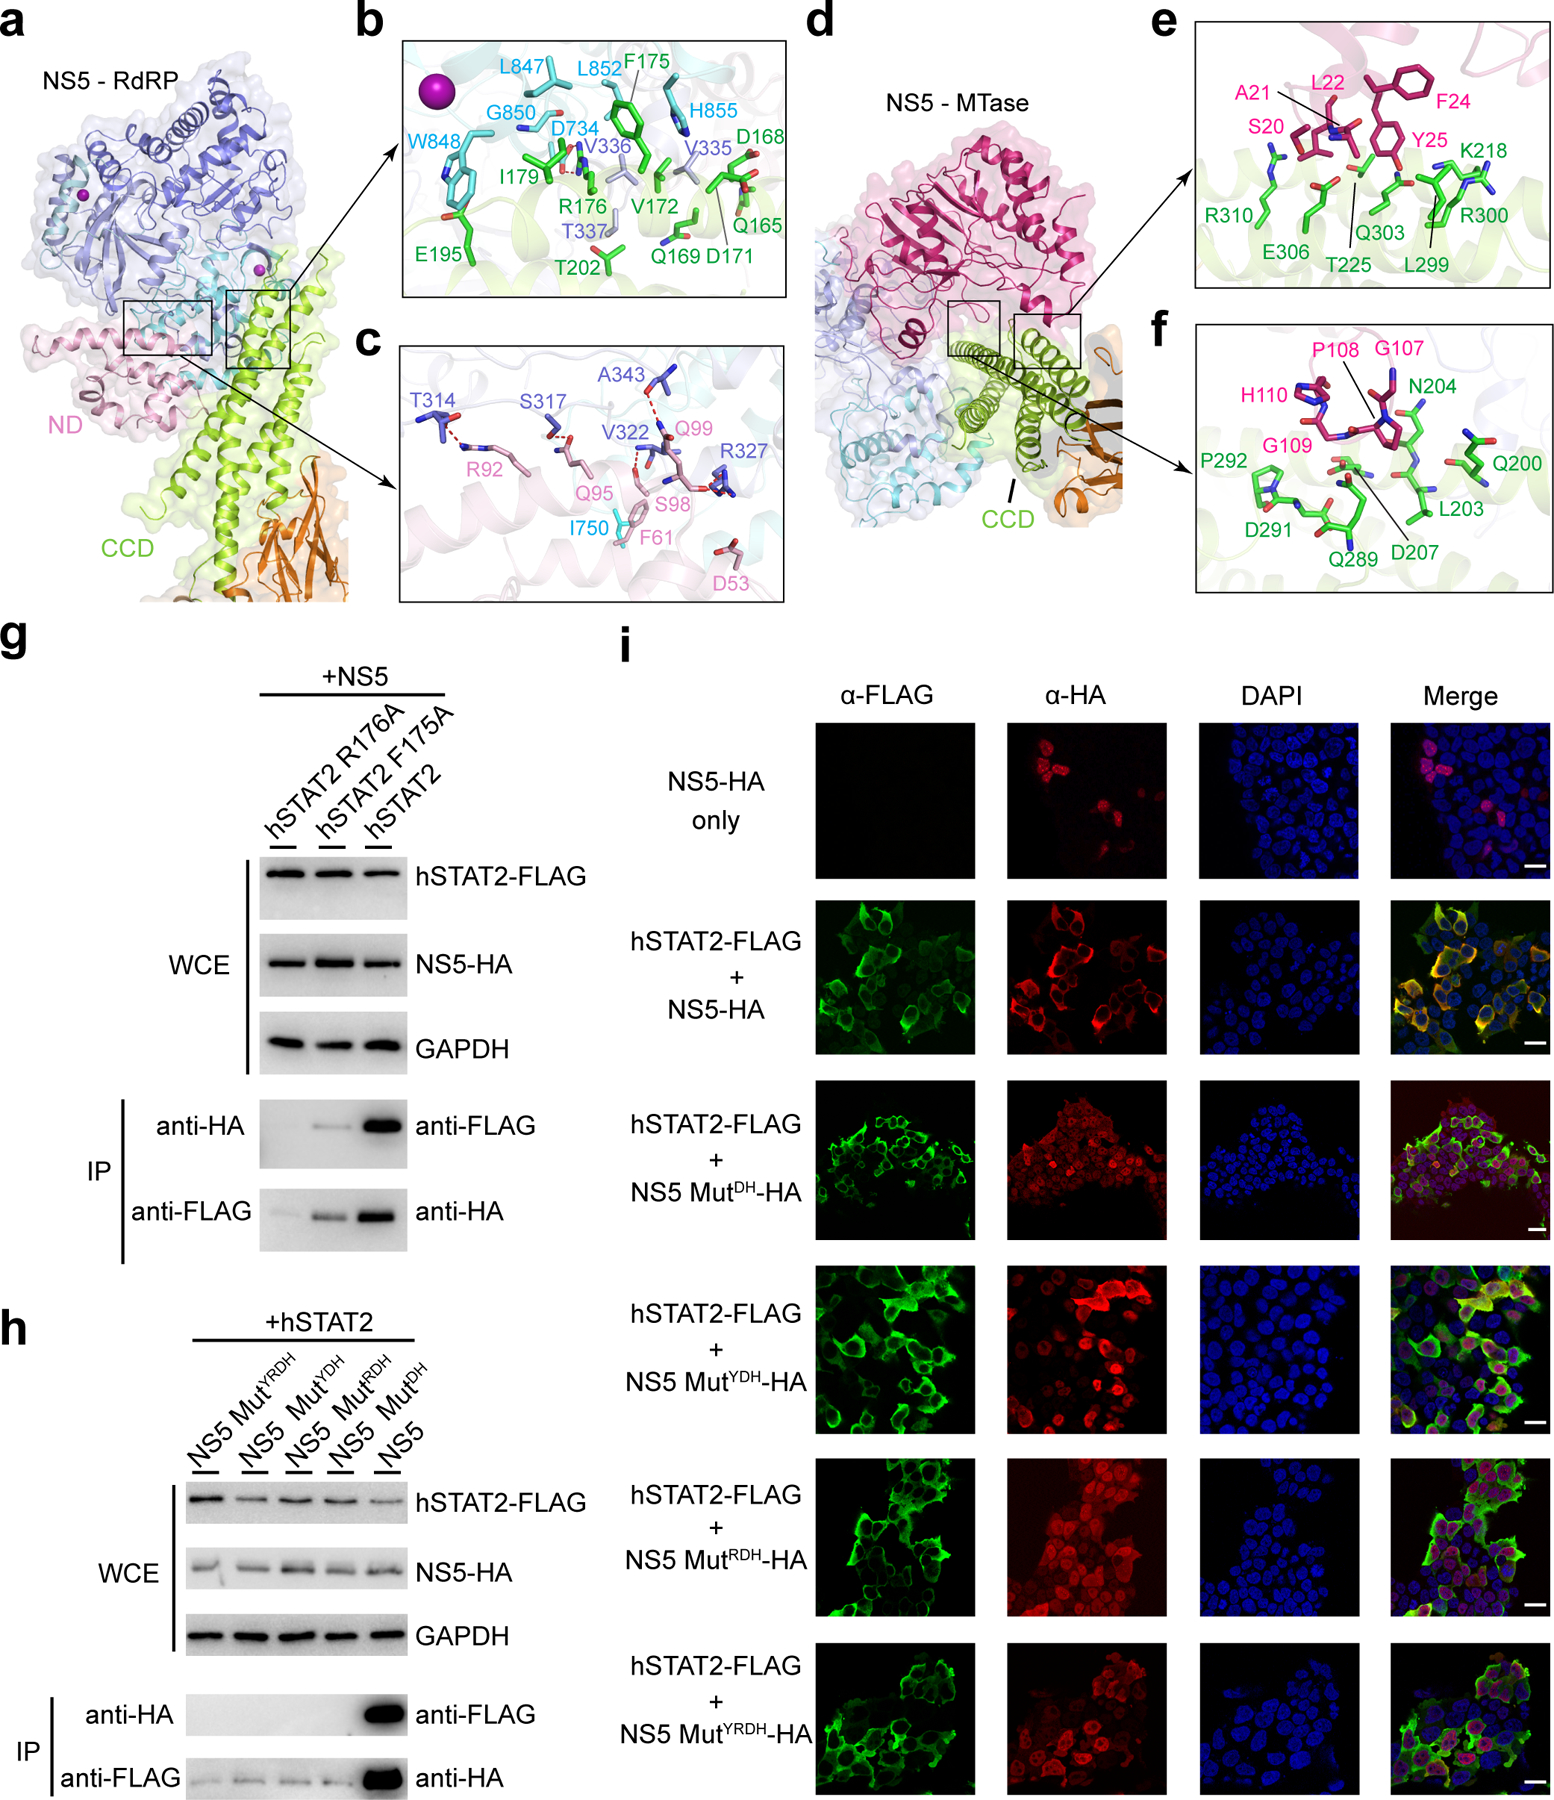
a–c, Ribbon and surface view showing NS5 RdRP–hSTAT2 interaction (a), with the details for the CCD- and ND-mediated interactions highlighted in expanded views (b) and (c), respectively. d–f, Ribbon and surface view of the NS5 MTase–hSTAT2 interaction (d), with details highlighted in expanded views (e) and (f). Hydrogen bonds in are shown as dash lines. g,h, Co-IP analysis showing the effects of hSTAT2 mutations (g) and NS5 mutations (h) on the NS5–hSTAT2 interaction. Immunoblot analysis of the IP and whole cell extract (WCE) was performed using antibodies against HA, FLAG and GAPDH. i, Representative IF images of 293T cells transfected with plasmids encoding NS5-HA and/or hSTAT2-FLAG. The transfected cells were fixed for immune staining using antibodies against HA (red) and FLAG (green). Nuclei were visualized by DAPI (blue) counter staining. Scale bars, 20 μm. Uncropped blots for g,h are shown in Supplementary Data 1.
The NS5 MTase domain is anchored to the middle segment of hSTAT2 CCD, with the potential RNA binding surface of the MTase domain arching over the second and fourth helix of hSTAT2 CCD (Fig. 3d–f, and Extended Data Fig. 6c,d). Indeed, electrophoretic mobility shift assay (EMSA) confirms that hSTAT2 competes against a capped RNA molecule for ZIKV NS5 binding in vitro (Extended Data Fig. 6e). Notably, an α-helix from the MTase domain, comprised of residues S20-Y25, is positioned in close proximity to residues K218, T225, L299, R300, Q303, E306 and R310 of hSTAT2 (Fig 3e), while the loop segment projected from the central β sheet of MTase, containing residues G107–H110, is docked onto a concave surface walled by hSTAT2 Q200, L203, N204, D207, Q289, D291 and P292 (Fig. 3f). These MTase–hSTAT2 interactions and the RdRP–hSTAT2 binding described above together constitute the molecular basis of ZIKV NS5–hSTAT2 association.
ZIKV NS5–hSTAT2 interaction and cellular localization of ZIKV NS5
To test our structural observations, we mutated key interaction-defining residues, including Y25 from NS5 MTase, R327, D734 and H855 from NS5 RdRP, and F175 and R176 from hSTAT2. The effects of these mutations on the protein-protein interaction were analyzed by co-IP assays using 293T cells transfected with HA-tagged ZIKV NS5 and FLAG-tagged hSTAT2. Mutation to alanine of hSTAT2 F175 or R176 substantially reduced the binding of hSTAT2 with NS5 (Fig. 3g). Likewise, introduction of the D734A/H855A (MutDH), Y25A/D734A/H855A (MutYDH), R327A/D734A/H855A (MutRDH) or Y25A/R327A/D734A/H855A (MutYRDH) mutations on ZIKV NS5 also largely reduced the NS5–hSTAT2 interaction (Fig. 3h). Consistently, co-IP assays with endogenous hSTAT2 indicate that hSTAT2 binds strongly to wild-type ZIKV NS5, but not to the MutYRDH mutant (Extended Data Fig. 7a). Additional in vitro GST pull-down assays with these NS5 mutants confirmed the co-IP results (Extended Data Fig. 7b). These data therefore lend strong support to the interaction mechanism identified in our NS5–hSTAT21–713 structures.
A previous study demonstrated that, as with other flaviviruses28, ZIKV NS5 localizes predominantly within the nucleus in the absence of STAT2 overexpression; yet co-expression of ZIKV NS5 with hSTAT2 leads to their co-localization to the cytoplasm14. To evaluate the effect of the ZIKV NS5–hSTAT2 interaction on cellular localization of ZIKV NS5, we performed immunofluorescence (IF) assays on ZIKV NS5 and hSTAT2 using 293T cells. Consistent with the previous study14, co-expression of wild-type ZIKV NS5 with hSTAT2 led to complete retention of ZIKV NS5 in the cytoplasm (Fig. 3i, and Extended Data Fig. 7c). By contrast, ~60–90% of NS5 MutDH, MutYDH, MutRDH or MutYRDH mutants were localized inside the nucleus, with hSTAT2 remaining in the cytoplasm (Fig. 3i and Extended Data Fig. 7c). Cytoplasmic co-localization of ZIKV NS5 and hSTAT2 was most severely disrupted with the introduction of the NS5 MutRDH or MutYRDH (Fig. 3i and Extended Data Fig. 7c). These results suggest that the interaction of ZIKV NS5–hSTAT2 underlies the cytoplasmic co-localization of ZIKV NS5 and hSTAT2.
ZIKV NS5 competes against IRF9 for hSTAT2 binding
STAT2 and IRF9 form a cognate complex in cells, which plays a critical role in regulating the nuclear shuffling of STAT2 and IFN response6, 8. Previous studies revealed that the interaction between STAT2 and IRF9 is also mediated by the STAT2 CCD29, 30. Structural comparison of ZIKV NS5- and IRF9-bound STAT2 proteins reveals a remarkably similar surface for ZIKV NS5 and IRF9 binding30 (Extended Data Fig. 8a,b), and our ITC binding assays also confirm that both ZIKV NS5 and IRF9 bind to hSTAT2 strongly, with the dissociation constants (Kd) falling into the ranges of μM and sub-μM, respectively (Extended Data Fig. 8c,d). To determine whether the presence of ZIKV NS5 affects the association of STAT2 with IRF9, we carried out co-IP assays using 293T cells transfected with FLAG-tagged hSTAT2, HA-tagged ZIKV NS5 or Myc-tagged IRF9 and found that increasing expression of NS5 led to a gradual decrease of IRF9 – hSTAT2 association and vice versa (Extended Data Fig. 8e). Consistently, in vitro GST pull-down assay indicated that the association of ZIKV NS5 with hSTAT2 decreases with the increasing amount of IRF9 (Extended Data Fig. 8f). Furthermore, our FLAG-IP assay indicates that ZIKV NS5 interaction-defective F175A or R176A mutation of hSTAT2 also disrupted the hSTAT2-IRF9 interaction (Extended Data Fig. 8g). These data therefore suggest that ZIKV NS5 competes against IRF9 for STAT2 binding, which may consequently disrupt the formation of ISG3 complex required for antiviral gene expression. Inhibition of the ISGF3 complex formation might further contribute to the cytoplasmic retention of hSTAT2, and facilitate NS5-mediated IFN suppression. Together, our structural and functional studies define the atomic details of the NS5–hSTAT2 interaction underlying not only the infection-triggered hSTAT2 degradation but also possible degradation-independent ISGF3 suppression, leading to multimodal inhibition of IFN responses, and to establishment of successful viral infection.
DENV-2 and ZIKV NS5s share a similar hSTAT2-binding mechanism
Sequence analysis of the ZIKV NS5-interaction sites of hSTAT2 shows relatively high conservation for the CCD region but less conservation for the ND (Extended Data Fig. 9a,b), which might contribute to the evolutionarily divergent interaction of STAT2 with ZIKV NS514. On the other hand, the hSTAT2-interacting residues of ZIKV NS5 are considerably conserved in DENV and other members of flavivirus family (Extended Data Fig. 9c,d), raising the possibility that DENV NS5 might interact with hSTAT2 similarly. To test this, we determined the EM structure of the DENV serotype 2 (DENV-2) NS5–hSTAT2 complex (Fig. 4a and Extended Data Fig. 9e,f). Indeed, DENV-2 NS5 associates with hSTAT2 in a similar manner as ZIKV NS5, with one end of the hSTAT2 CCD embraced by both the MTase and RdRP domains of DENV-2 NS5. Note that two different conformations of DENV NS5 have been reported previously, with an extended conformation observed for DENV-2 NS531 and a compact conformation observed for DENV-3 NS532, which likely arises from conformational heterogeneity of DENV NS5 in solution33. The structure of hSTAT2-bound ZIKV NS5, mimic of hSTAT2-bound DENV-2 NS5, fits well with the extended conformation of DENV-2 NS5 (Fig. 4a,b), but not with the compact fold of DENV-3 NS5 (Extended Data Fig. 9g). These observations suggest a conserved conformational selection mechanism in the interaction between flavivirus NS5 and hSTAT2.
Figure 4. Analysis of the DENV NS5–hSTAT2 interaction.
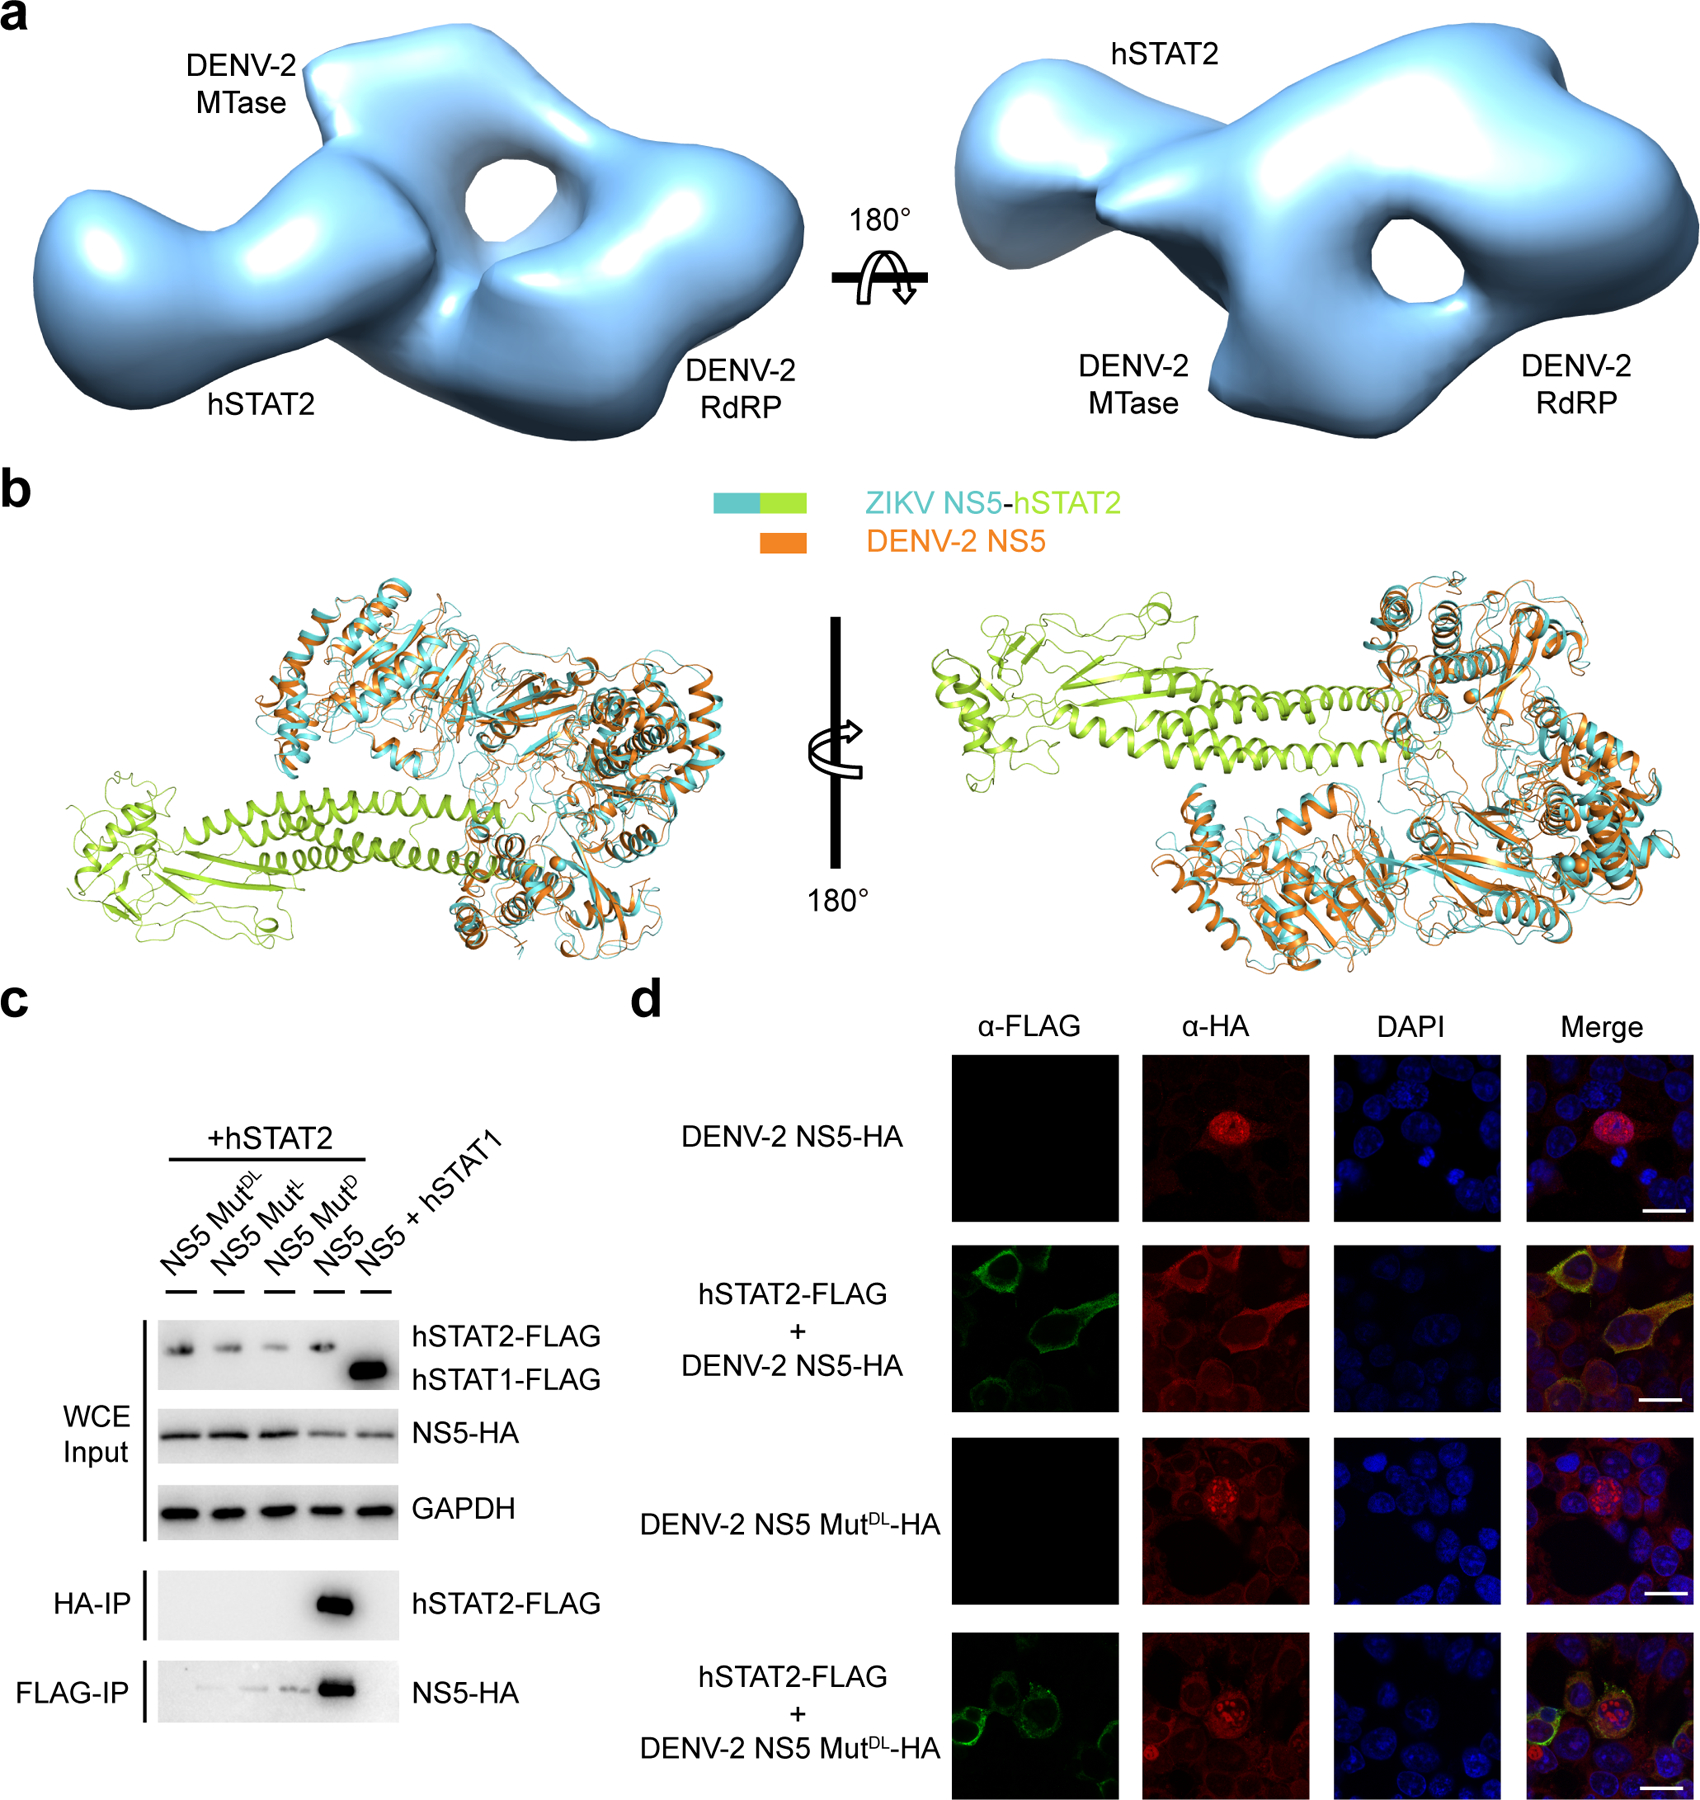
a, Two opposite views of the EM density map for the DENV-2 NS5–hSTAT2 complex. b, Superposition of the crystal structure of free DENV-2 NS5 (orange; PDB 5ZQK) and the cryo-EM structure of ZIKV NS–hSTAT2 complex. c, Co-IP assay of HA-tagged DENV-2 NS5 (NS5-HA), FLAG-tagged hSTAT2 (STAT2-FLAG) or hSTAT1 (hSTAT1-FLAG). The D732A, L853A and D732A/L853A mutations are denoted as MutD, MutL and MutDL, respectively. d, Representative IF images of 293T cells transfected with plasmids encoding DENV-2 NS5-HA and/or hSTAT2-FLAG. The transfected cells were fixed for immune staining using antibodies against HA (red) and FLAG (green). Nuclei were visualized by DAPI (blue) counter staining. Scale bars, 20 μm. Uncropped blots for c are shown in Supplementary Data 1.
Furthermore, we mutated to alanine the residues D732 and L853 of DENV-2 NS5, equivalent to D734 and H855 of ZIKV NS5 (Fig 4c), and performed co-IP assay using 293T cells co-transfected with FLAG-tagged hSTAT2 and HA-tagged DENV-2 NS5. Wild-type DENV-2 NS5 interacted strongly with hSTAT2, but variants carrying the single mutations D732A or L853A or double mutation D732A/L853A did not (Fig. 4c). In addition, ectopic expression of hSTAT2 led to retention of wild-type, but not D732A/L853A-mutated DENV-2 NS5, in the cytoplasm (Fig. 4d). Together, these data suggest that DENV-2 NS5 and ZIKV NS5 engage hSTAT2 in a similar fashion.
ZIKV NS5–hSTAT2 interaction leads to hSTAT2 degradation and IFN suppression
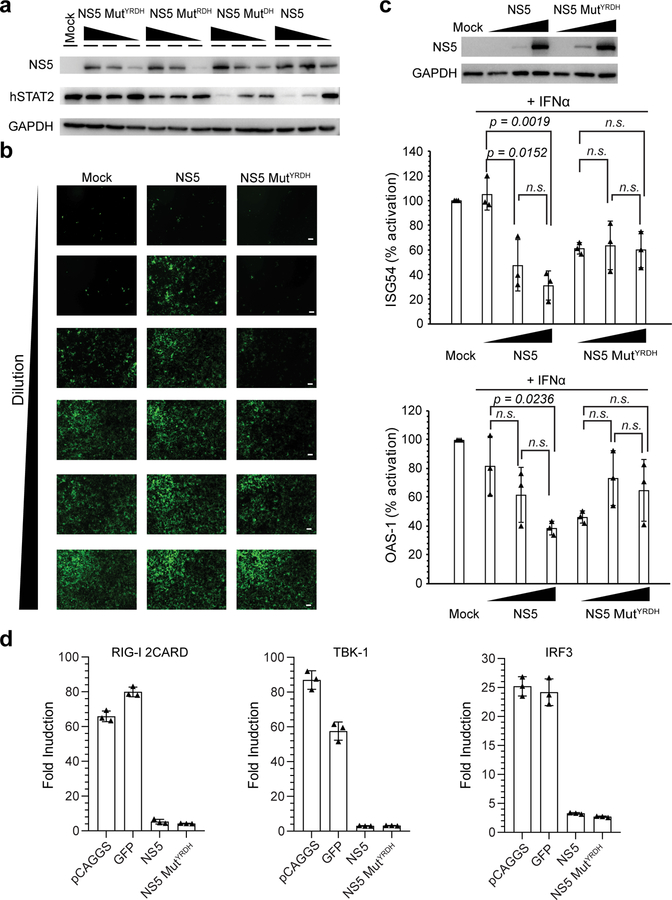
We further evaluated the effect of the ZIKV NS5–hSTAT2 interaction on the stability of hSTAT2 and related type I IFN response in cells. Expression of wild-type ZIKV NS5 in 293T cells led to a dose-dependent decrease in the protein level of endogenous hSTAT2 (Fig. 5a), consistent with previous observations14, 34, 35. The NS5-dependent degradation of hSTAT2 was slightly attenuated in cells transfected with NS5 MutDH, and became even less evident in cells transfected with NS5 MutRDH or MutYRDH (Fig. 5a). Next, we performed the vesicular stomatitis virus (VSV)-GFP based IFN bioassay36 to evaluate the impact of the NS5–hSTAT2 interaction on IFN production. The replication efficiency of VSV, which is impaired in the presence of high levels of IFN, was increased in A549 cells treated with supernatants from cell cultures transfected with wild-type NS5 compared to those treated with NS5 MutYRDH (Fig. 5b), suggesting that the NS5 MutYRDH mutation impaired NS5-mediated suppression of IFN production. Consistent with these results, qRT-PCR analysis of two representative type I IFN-stimulated genes, ISG54 and OAS-1, in IFN-treated 293T cells revealed that the expression of wild-type ZIKV NS5, but not NS5 MutYRDH, led to a dose-dependent reduction of ISG54 and OAS-1 expression (Fig. 5c).
Figure 5. Role of the ZIKV NS5–hSTAT2 interaction in ZIKV NS5-mediated degradation of hSTAT2 and type I IFN signaling suppression.
a, Immunoblot analysis of 293T cells transfected with indicated plasmids encoding wild-type or mutant NS5-HAs at three different amounts using antibodies against HA, hSTAT2, and GAPDH. b, VSV-GFP infection of A549 cells treated with 1:2 serial dilutions of the supernatants derived from poly(I:C)-stimulated 293T cells, non-transfected (mock), or transfected with NS5 or NS5 MutYRDH. Representative images of three independent experiments. Scale bars, 20 μm. c, Immunoblot of NS5 and GAPDH (top) and qRT-PCR analysis of ISG54 and OAS-1 mRNAs (bottom) of non-transfected 293T cells (mock), or 293T cells transfected with plasmids encoding wide-type or mutant NS5-HAs, followed by treatment with IFN for 18 hr. Data in graphs are mean ± s.d. (n=3 independent transfections). Statistical analysis used two-tailed Student’s t-test; ns, p > 0.05. d, IFN-β promoter-driven luciferase activity assay. Fold increase of interferon β production activated by (left to right) RIG-2CARD, TBK-1 and IRF3 in 293T cells transfected with empty pCAGGS vector, GFP, WT or MutYRDH ZIKV NS5. Data are mean ± s.d. (n=3 independent transfections). Uncropped blots for a,b and source data for b,d are in Supplementary Data 1 and 2, respectively.
Previous studies had shown that ZIKV NS5, in addition to suppression of hSTAT2, inhibits interferon β production through targeting the retinoic acid-inducible gene I (RIG-I) pathway35, 37, 38. We thus further interrogated the effects of ZIKV NS5 mutations on type I IFN suppression along the RIG-I signaling pathway. Toward this, we performed an IFN-β promoter-driven luciferase assay to determine whether the NS5 mutation also affects the RIG-I-(2CARD)-, TBK1-, and IRF3-activated IFN-β production. Consistent with previous observations35, 37, 38, cells transfected with wild-type NS5, in comparison with controls, showed substantial suppression of the luciferase activity activated by RIG-I-(2CARD), TBK1, or IRF3 (Fig. 5d). Transfection with MutYRDH led to a similar suppression of the luciferase activity (Fig. 5d), suggesting that this mutation did not compromise the inhibitory role of ZIKV NS5 in the RIG-I pathway. These data highlight the importance of the ZIKV NS5–hSTAT2 interaction in proteasome-mediated degradation of hSTAT2 and downstream IFN signaling14, 35.
ZIKV NS5–hSTAT2 interaction is required for efficient viral infection of IFN-competent cells.
Finally, we sought to determine the effect of the ZIKV NS5–hSTAT2 interaction on ZIKV infection. Toward this end, we first introduced different NS5 mutations to the cDNA-ZIKV-MR766 construct, a rescue plasmid that has previously been used for generating recombinant MR766 ZIKV39. Next, we generated both the recombinant wild-type (rWT) virus and the mutant viruses through transfecting 293T cells with the cDNA-ZIKV-MR766 construct, as described previously39. Interestingly, the rescue plasmids carrying the Y25A (MutY), H855A (MutH), MutRDH, or MutYRDH failed to yield recombinant viruses, likely due to a severe attenuation effect caused by these mutations. Nevertheless, we were able to rescue viruses with wild-type or R327A NS5. Additionally, we rescued a D734A-containing virus, in which an additional mutation G338E recurrently emerged after several passages in Vero cells during two independent rescue processes.
Both of those two mutant ZIKV exhibited similar replication kinetics as rWT ZIKV in IFN-deficient Vero cells40 (Fig. 6a), with the exception of the 12 hours post infection where the mutant titers are slightly higher than rWT ZIKV. This discrepancy may arise from the fact that the viral titer counting was based on plaque phenotype, or the factors influencing early viral growth. We then performed multi-cycle growth curve experiments using IFN-competent A549 cells, which were infected by the different mutant viruses at a multiplicity of infection (MOI) of 1. Nevertheless, compared to rWT ZIKV, both mutant viruses yielded substantially reduced virus titers after 48 hours post infection (Fig. 6b), suggesting an IFN-dependent attenuation effect for the R327A and G338E/D734A NS5 mutations. Note that co-IP and IF analyses of 293T cells transfected with ZIKV NS5 and/or hSTAT2 indicated that the G338E/D734A mutation affects the NS5-hSTAT2 interaction and cellular localization of ZIKV NS5 in a manner similar to that of D734A or MutYRDH mutations (Fig. 3i and Extended Data Fig. 10a,b). Likewise, the R327A mutation also impairs the interaction and cytoplasmic co-localization of ZIKV NS5 and hSTAT2, albeit to a lesser extent (Extended Data Fig. 10a,b). Consistently, both mutations compromised the NS5-mediated hSTAT2 degradation in both 293T cells and virus-infected A549 cells (Extended Data Fig. 10c,d). Together, these data establish that the hSTAT2-NS5 interaction is critical for productive ZIKV infection under IFN-competent condition.
Figure 6. Role of the ZIKV NS5–hSTAT2 interaction in ZIKV infection.
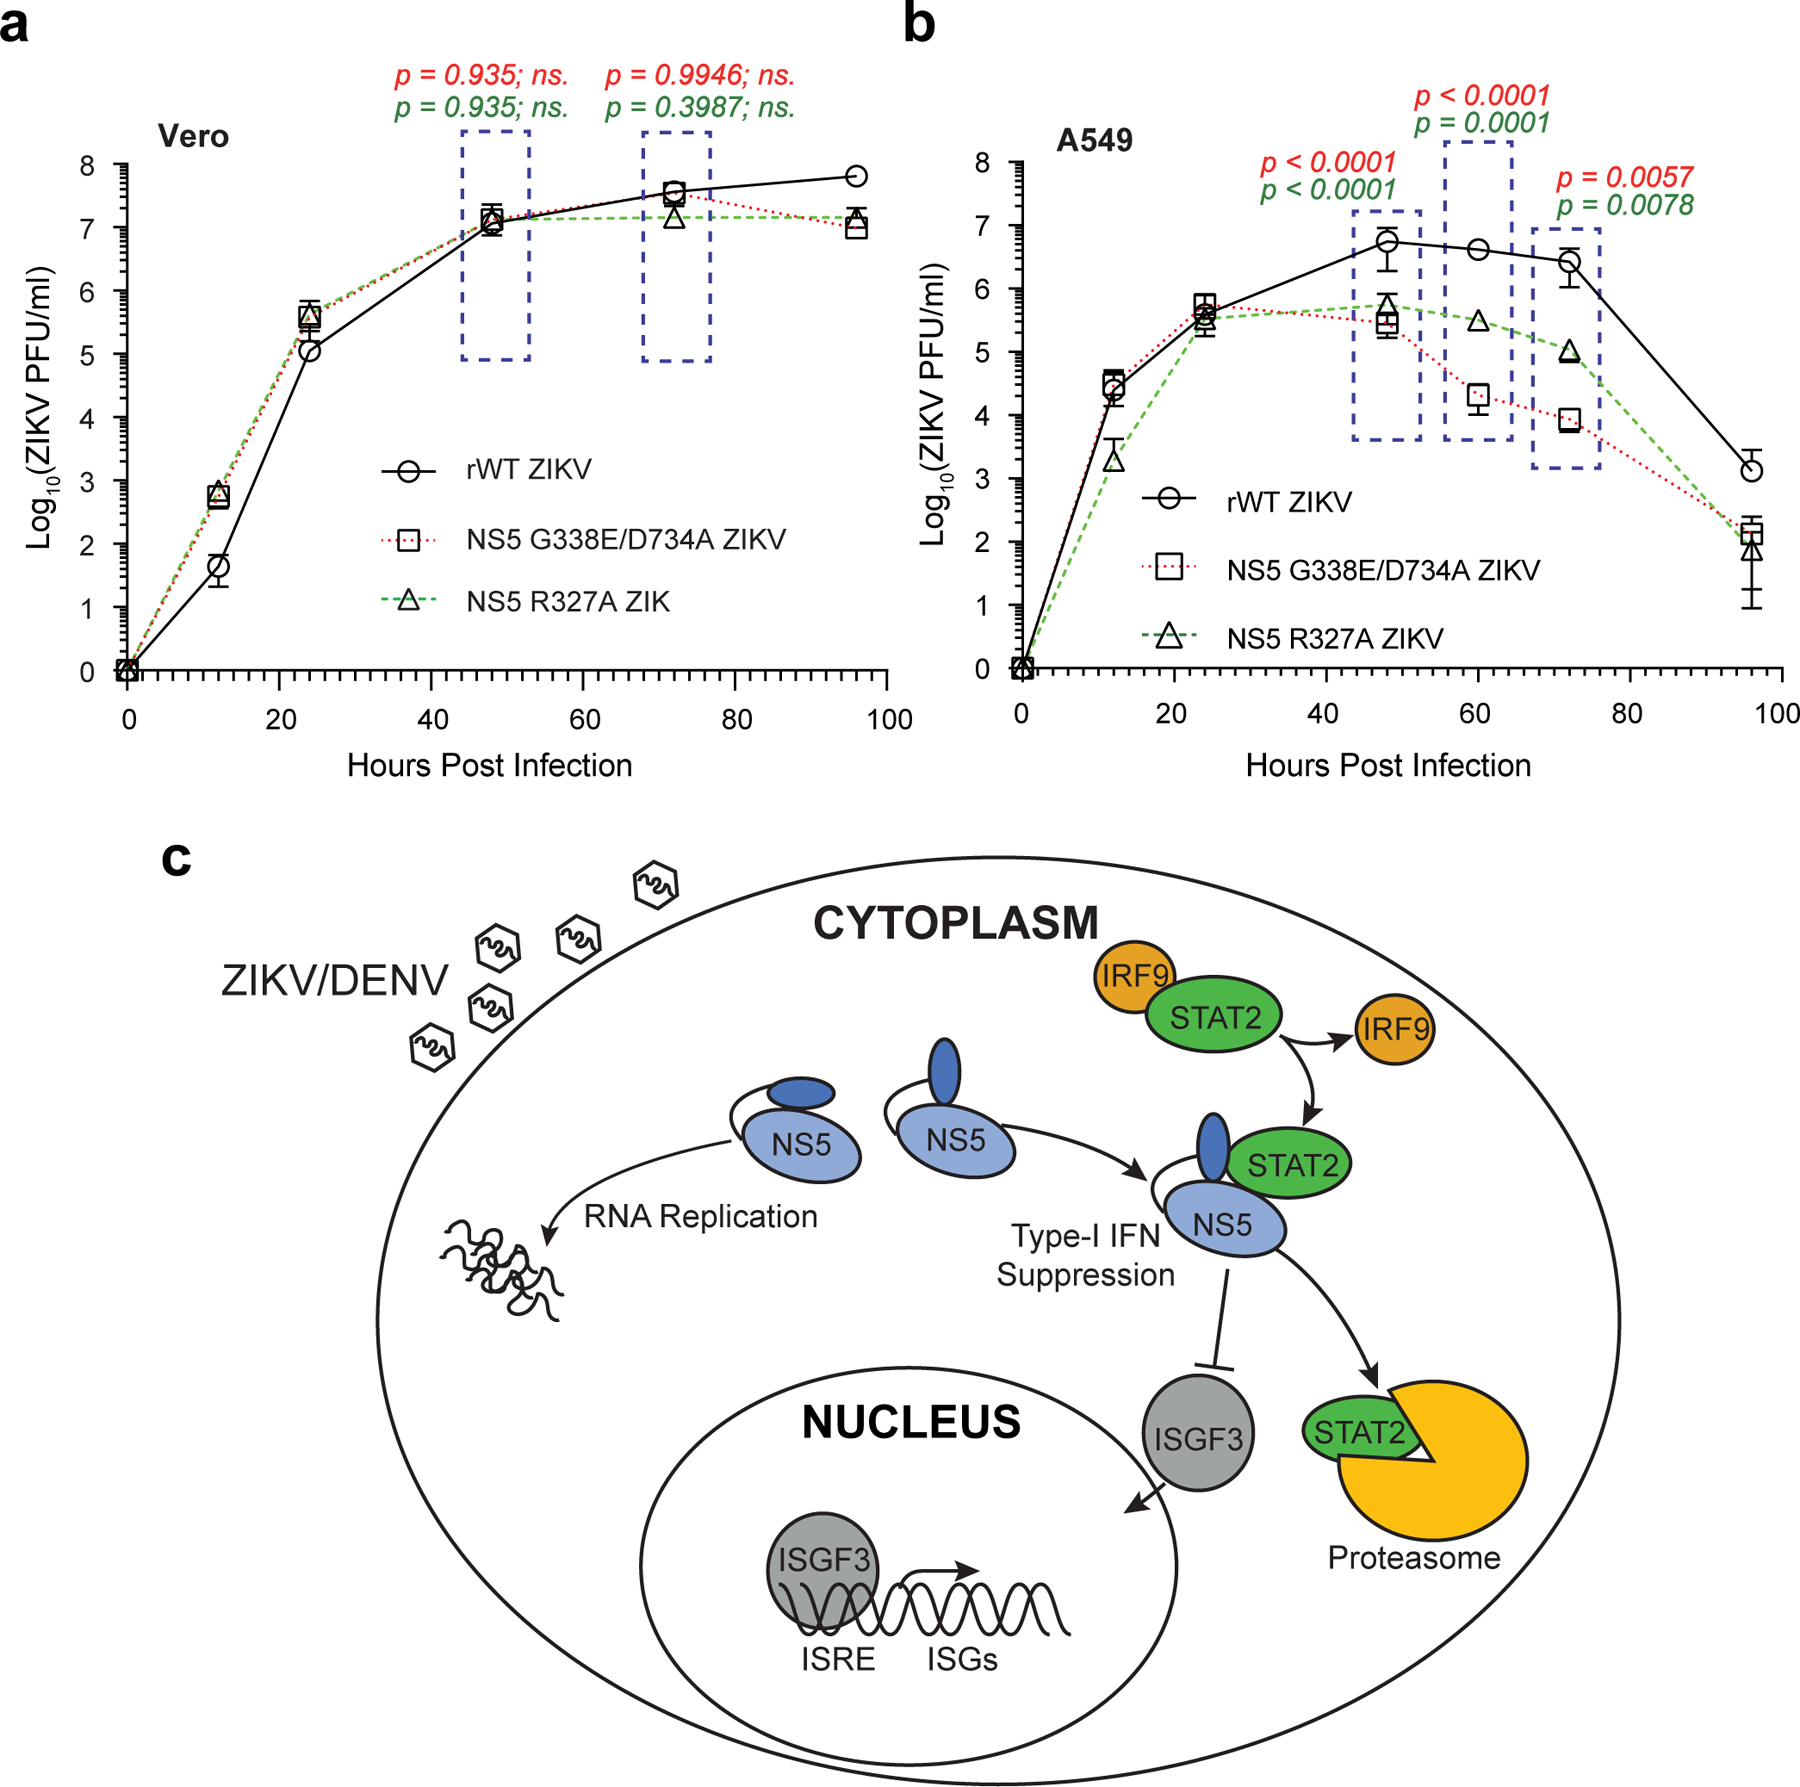
a,b, Growth curves of Vero (a) and A549 (b) cells infected with the rWT and mutant MR766 viruses. Values of titers are expressed in PFU per milliliter. Data are mean ± s.d. (n=3 independent infections). Statistical analysis used the two-way ANOVA test; ns, p > 0.05. c, Model of ZIKV/DENV NS5-mediated hSTAT2 degradation and IFN response suppression. Inside an infected cell, ZIKV/DENV NS5 exhibits heterogeneous conformations, with the extended fold poised for hSTAT2 binding and the compact fold likely involved in RNA replication. The NS5 – hSTAT2 interaction suppresses the formation of ISGF3 through promoting hSTAT2 degradation and inhibiting the hSTAT2 – IRF9 interaction. Source data for a,b are shown in Supplementary Data 2.
Discussion
The STAT family of proteins, in particular STAT1 and STAT2, plays critical roles in eliciting IFN responses against viral infection. Not surprisingly, these proteins are among the first targets of viral attacks. To date, the molecular basis for virus-mediated suppression of STAT function remains unclear, due to lack of structural information on the complexes between STATs and any viral antagonist. The structural, biochemical, cellular and viral infection analyses of the ZIKV NS5–hSTAT2 and DENV-2 NS5–hSTAT2 complexes presented here reveal for the first time the underlying principle for the interactions between STAT proteins and viral antagonists. This study not only provides important mechanistic insights into the IFN suppression by a viral antagonist, but also sheds light onto the rational design of vaccine or other therapeutic strategies against viral infections.
Flavivirus NS5 proteins have widely evolved into an antagonist for IFN signaling13–15, 41–46. For instance, the NS5 protein from ZIKV, DENV or yellow fever virus (YFV) has been shown to interact with hSTAT2 to promote its degradation13, 14 or prevent its binding to promoter elements of target genes43. How the sequence and conformation of flavivirus NS5 were shaped to underpin its antagonistic activity remains elusive. The structures of ZIKV NS5–hSTAT2 and DENV-2 NS5–hSTAT2 complexes reveal multivalent interactions. The inter-domain cleft between the MTase and RdRP domains of the NS5 proteins provides a surface complementarity with the CCD of hSTAT2 for specific molecular recognition. This interaction mode is shared between ZIKV NS5 and DENV NS5, suggesting a conserved mechanism for the interactions between hSTAT2 and flavivirus NS5 proteins (Fig. 6c). As the largest and most conserved flavivirus protein, NS5 has been shown to exist in multiple conformations in solution, presumably due to the weak MTase–RdRP domain interaction24, 25, 32, 33, 47, 48. So far, structural evidence has revealed two alternative conformations of flavivirus NS5, corresponding to two distinct domain interfaces: the structures of free ZIKV NS5, DENV-2 NS5 and JEV NS5 represent an extended fold, with a large inter-domain cleft exposed to solvent24, 25, 47, 48. By contrast, the crystal structure of DENV-3 NS5 exhibits a compact fold, with a less accessible MTase–RdRP domain interface, a conformation that is closely related to the NS5-mediated RNA replication32. Given that these two alternative domain interfaces are both conserved in sequence49, it is conceivable that the two conformations of NS5 coexist in solution. The structures of the hSTAT2-bound either DENV-2 NS5 or ZIKV NS5 presented in this study indicated that both proteins adopt the extended conformation for hSTAT2 interaction, suggesting a conformational selection mechanism in their binding to hSTAT2 (Fig. 6c).
Structural and biochemical analyses presented in this study demonstrate that the interaction between ZIKV NS5 and hSTAT2 may lead to multiple functional consequences. Intriguingly, we observe that ZIKV NS5 competes against IRF9 for the same interaction interface on hSTAT2, potentially leading to suppression of the complex formation of ISGF3. In light of the critical role of the ISGF3 complex in STAT2-mediated IFN response, these data suggest that ZIKV NS5 suppresses hSTAT2 not only through promoting its proteasome-mediated degradation, but also through blocking the formation of ISGF3 complex. Inhibition of the ISGF3 complex formation not only suppresses antiviral gene expression, but might also affect the nuclear shuffling of hSTAT2 and its proteasome-mediated degradation, therefore constituting a multifaceted regulatory mechanism of hSTAT2 suppression (Fig. 6c). It is worth noting that previous studies have identified multiple mechanisms for nuclear relocation of flavivirus NS5s50, 51. For instance, a C-terminal 18-residue fragment of DENV-2 NS5 has been shown to mediate its nuclear localization; such a fragment is not conserved in DENV-1 NS5, leading to cytoplasmic localization of DENV-150. Given the diversity between different serotypes of DENV, it is worth noting that the mechanism by which the hSTAT2 interaction affects DENVs other than serotype 2 remains to be determined. In addition, a recent study has identified residues K390-R393 of ZIKV NS5 as a nuclear localization sequence, which mediates the association of ZIKV NS5 with importin α to form supramolecular nuclear bodies in cells51. In this regard, this study mapped the hSTAT2-interaction sites onto distinct regions of ZIKV NS5 (Fig. 1,2) or DENV-2 NS5 (Fig. 4a,b), suggesting that the interaction of NS5 with hSTAT2 would not prevent its binding to importin, thereby implying a novel mechanism for cytoplasmic retention of ZIKV NS5. On the other hand, our data also indicate that the interaction between hSTAT2 and ZIKV NS5 potentially impairs the activity of the NS5 protein through reducing its RNA binding affinity (Extended Data Fig. 6e), suggesting multi-layered functional antagonism between hSTAT2 and ZIKV NS5.
A common theme among all members of the STAT family is pY-dependent dimerization. The crystal structures of homodimeric STAT1, STAT3 and STAT6 reveal that dimerization of STATs is mediated by the mutual SH2–pY association, reinforced by the anti-parallel pairing of the tail segment immediately downstream of the pY site17, 19, 20. However, how the phosphorylation event triggers the monomer-dimer transition of STATs remains unclear. Surprisingly, the structure of hSTAT2 presented in this study reveals that the unphosphorylated pY-tail segment of hSTAT2 folds back to block the pY-binding site of the SH2 domain, with phosphorylation site Y690 interacting with SH2 through side-chain hydrogen bonding interactions (Extended Data Fig. 2a). Phosphorylation of hSTAT2 Y690 presumably would lead to impaired tail–SH2 association of hSTAT2, permitting the repositioning of the tail segment for an inter-molecular interaction, thereby providing a potential autoinhibitory mechanism in controlling the dimerization of STAT2 or other STATs. Furthermore, our modeling analysis suggests that the complex of STAT1–STAT2 dimer adopts the same architecture as the STAT1 homodimer, and presents a potential DNA-binding surface of the hSTAT2 DBD. Together, these data provide a framework for understanding the regulation and structure of the ISGF3 complex.
Methods
Protein expression and purification.
For structural studies, the cDNA sequences encoding full-length ZIKV NS5, its MTase (residues 1–273) and RdRP (residues 273–903) domains, full-length DENV-2 NS5, an N-terminal fragment of hSTAT2 (residues 1–713, hSTAT21–713) and full-length human IRF9 were each inserted into a modified pRSFDuet-1 vector (Novagen), preceded by a His6-SUMO tag and ULP1 (Ubiquitin like protease 1) cleavage site. For in vitro pull-down assays, the cDNA sequence encoding full-length hSTAT2 was cloned into the pGEX6P-1 vector (GE Healthcare). Expression and purification of the His6-SUMO-tagged ZIKV NS5, full length or fragments, and hSTAT21–713, followed a previously described protocol with slight modifications24. In short, the NS5 or hSTAT21–713 fusion proteins were expressed in E. coli BL21 DE3 (RIL) cell strains (Agilent Technologies) and purified sequentially using a Ni2+-NTA column and a butyl Sepharose column (GE Healthcare). The His6-SUMO tag was subsequently removed through ULP1-mediated cleavage, followed by size exclusion chromatography on a Superdex 200 16/600 column (GE Healthcare) pre-equilibrated with buffer containing 25 mM Tris-HCl (pH 7.5), 500 mM NaCl, 5 mM DTT and 5% glycerol. His6-SUMO-tagged IRF9 was expressed and purified similarly as ZIKV NS5 and hSTAT2, except that additional ion exchange chromatography on a heparin column was introduced between Ni-NTA chromatography and size-exclusion chromatography. Protein solutions of RdRP and hSTAT21–713 were respectively concentrated to 20 mg/mL and 30 mg/mL through ultrafiltration with Amicon filters (Millipore), and were frozen at −80°C for storage. For GST pull-down assays, the GST-tagged full-length hSTAT2 protein was first purified using a glutathione Sepharose Fast Flow 4 column, followed by ion exchange chromatography on a Heparin column (GE Healthcare) and size-exclusion chromatography on a Superdex 200 16/600 column (GE Healthcare) using the buffer as described above.
Expression and purification of DENV-2 NS5, and ZIKV NS5 and hSTAT2 mutants followed the same approach as that for wild-type proteins, except that purification of DENV-2 NS5 did not require the butyl Sepharose step.
Crystallization and X-ray structure determination.
To assemble the NS5 RdRP–hSTAT2 complex, equimolar ZIKV RdRP and hSTAT21–713 were mixed to achieve a final protein concentration of ~6 mg/mL. The crystallization condition was initially identified via sparse matrix screening kits (Qiagen Inc.), and further optimized through hanging-drop vapor diffusion method by mixing 1 μL of the ZIKV RdRP–hSTAT21–713 complex with 1 μL of precipitant solution (0.2 M ammonium sulfate, 11% PEG 8000 and 0.1 M Tris-HCl, pH 8.5). Crystals were equilibrated in a cryoprotectant comprised of precipitant solution supplemented with additional 30% glycerol, and were subsequently flash-frozen in liquid nitrogen.
The X-ray diffraction data for the ZIKV RdRP–hSTAT2 complex were collected on the BL 5.0.1 beamline at the Advanced Light Source, Lawrence Berkeley National Laboratory. The diffraction data were processed using the HKL2000 program52. The complex structure was solved by the molecular replacement method using PHASER53 with the structures of free ZIKV NS5 (PDB ID: 5TMH) and human STAT1 (PDB ID: 1YVL) as search models. The structure was further refined by iterative model building and refinement with Coot54 and Phenix55, respectively. The statistics of data collection and structure determination are summarized in Table 1.
Cryo-EM data acquisition.
The protein samples of hSTAT21–713 and ZIKV NS5 were mixed in a 1:1 molar ratio, followed by size-exclusion chromatography on a Superdex 200 10/300 column (GE Healthcare) pre-equilibrated with buffer containing 25 mM Tris-HCl (pH 7.5), 175 mM NaCl, 5 mM DTT. The peak was collected and subjected to negative stain electron microscopy for sample optimization.
For cryo-EM sample preparation, an aliquot of 2.5 μL of the above optimized ZIKV NS5–hSTAT21–713 sample at a concentration of approximately 0.5 mg/ml was applied to a Quantifoil holey carbon grid (1.2/1.3, 300 mesh), that was glow discharged for 25 seconds with a PELCO Easy Glow system. The grid was blotted and plunge-frozen in liquid ethane with a Vitrobot IV (Thermo-Fisher) at 4°C under 100% humidity. The frozen grids were stored in liquid nitrogen before use.
For cryo-EM image acquisition, the cryo-EM grids were loaded into an FEI Titan Krios electron microscope equipped with Gatan Quantum imaging filter (GIF) and a post-GIF K2 Summit direct electron detector. Movies were recorded as dose-fractionated frames in super-resolution mode with Legion3.156 at nominal magnification of 130,000×, corresponding to a calibrated pixel size 0.535 Å on the specimen. The slit width in the GIF system was set to 20eV to remove inelastically scattered electrons. A total of 1859 movies were recorded for the data set, the dose rate on the camera was set to 1.7 electrons/pixel/s, corresponding to 6.0 electrons/Å2/s. An exposure time of 8 sec was used at a rate of 0.2 s/frame, giving rise to 40 frames and a total dosage of 48 electrons/Å2 for each movie. Details of the experimental conditions are summarized in Table 2.
Cryo-EM data processing.
All but the first and last frames in each movie were motion-corrected with a subframe 5×5 to generate two motion-corrected micrographs (with and without dose-weighting), which were both binned 2×2 to yield a pixel size of 1.07Å with MotionCor257. The micrographs without dose-weighting were used for contrast transfer function (CTF) determination with ctffind version 4.1.1858 and for particle picking with Gautomatch (https://www.mrc-lmb.cam.ac.uk/kzhang/). The micrographs with dose-weighing were used for particle extraction and 3D reconstruction, as detailed below.
We selected 1762 micrographs by discarding those either with under-focus values greater than 3.0 μm, or containing crystalline ice. A total of 1,088,157 particles were extracted from these selected micrographs using RELION59, 60. These particles were subjected to a reference-free 2D classification by requesting 200 classes. Based on the presence of structures in the 2D class averages, we selected 868,048 particles (Supplementary Fig. 2), which were subjected to a three-dimensional (3D) classification in RELION with C1 symmetry. The initial reference used for this 3D classification step was generated by cryoSPARC61 from the same particles. The 3D classification was used to sort particles into 3 classes with 5 pixels and 3.8° as the translation and rotation search parameters, respectively. 35% of the particles were classified into a class with clear secondary structures features (Supplementary Fig. 2). The particles in this “good” class were then subjected to another round of 3D classification by requesting 3 classes, which further yielded a new “good” class with improved structural features. The 118,760 particles in this new “good” class were subjected to 3D auto-refinement and post process, yielding a map at 4.0 Å resolution (Extended Data Fig. 3). Data processing workflow is detailed in Supplementary Fig. 2.
The global resolution reported above is based on the “gold standard” refinement procedures and the 0.143 Fourier shell correlation (FSC) criterion. Local resolution evaluation (Extended Data Fig. 3) was performed with Resmap62.
Atomic model building based on the cryo-EM map.
Atomic model building was accomplished in an iterative process involving Coot, Chimera63 and Phenix. Briefly, the above crystal structure of ZIKV RdRP–hSTAT2 was fitted into the cryo-EM map as initial models by using the ‘fit in map’ routine in Chimera. This fit revealed the extra density corresponding to MTase domain and the absence of density for ND, suggesting high flexibility of ND in solution (indeed, even in the crystal, ND is partially disordered). The cryo-EM densities for SH2 and partial LD were of insufficient quality for model building. The crystal structure of the MTase domain (PDB 5TMH) fits perfectly into the cryo-EM density and was combined with our crystal structure of NS5 RdRP–hSTAT21–713 to create an initial atomic model for NS5–hSTAT21–713, which was refined by ‘real-space refinement’ in Phenix. We then manually adjusted side chains and linker loops to match the cryo-EM density map with Coot. This process of real space refinement and manual adjustment steps was repeated iteratively until the peptide backbone and side chain conformations were optimized. Ramachandran and secondary structure restrains were used during the refinement. Our final atomic model consists of the full-length NS5 and residues 140–509 of hSTAT2 with good model geometry, as summarized in Table 2.
Negative-stain data acquisition and structure determination.
The protein samples of hSTAT21–713 and DENV-2 NS5 were mixed in a 1:1 molar ratio, and purified in the same manner as that for the hSTAT21–713–ZIKV NS5 complex. An aliquot of 3 μL of the complex sample was then applied to the carbon-coated grid and incubated for 1 min. After removal of the excess sample solution, the grid was stained with 1% (w/v) uranyl formate. Negative-stain EM micrographs were acquired manually and a TIETZ F415MP 16-megapixel CCD camera at 68,027× magnification in an FEI Tecnai F20 electron microscope operated at 200 kV. The micrographs were saved by 2× binning to yield a pixel size of 4.4 Å.
For negative-stain EM data processing, 138,246 particles were extracted from 300 micrographs using RELION. These particles were subjected to a reference-free 2D classification by requesting 100 classes. Based on the 2D class averages results, we selected 116,778 particles, which were subjected to a three-dimensional (3D) classification by requesting 3 classes. The initial reference used for this 3D classification step was generated by cryoSPARC from the same particles. Based on the 3D classification results, 35,062 particles in one class were subjected to 3D auto-refinement, yielding a map at about 17.1 Å resolution (Fig. 4a, Extended Data Fig. 9e,f). The crystal structures of the MTase and RdRP domains of DENV-2 NS5 (PDB 5ZQK) and hSTAT2 (from this study) were respectively fitted into the EM map by using the ‘fit in map’ routine in Chimera.
GST pull-down assays.
60 μg of GST-hSTAT2 fusion protein was incubated with 150 μg of ZIKV NS5, in the form of either full length or individual domains, wild type or mutants, in a 1 mL pull-down buffer (10 mM Tris-Cl, pH 8.0, 100 mM NaCl, 5% glycerol, 5mM DTT and 0.1% Triton X-100) for 1 h at 4°C. The mixtures were centrifuged at the speed of 15,000 rpm on an 5424R Eppendorf microcentrifuge for 15 min, followed by incubation of the supernatant with 20 μL glutathione sepharose 4 fast flow resins (GE Healthcare) for 15 min. Subsequently, the beads were separated from the supernatant through centrifugation at the speed of 500 rpm and subjected to two and four washes with the pull-down buffer for NS5 mutants and hSTAT2 mutants, respectively. The bound proteins were analyzed by SDS–PAGE followed by SYPRO Ruby protein gel stain (Bio-Rad). For IRF9 competition assay, the mixture of GST-hSTAT2 and ZIKV NS5 was further incubated with IRF9 in an IRF9:NS5 molar ratio of 1:40, 1:20 or 1:10, followed by washes and SDS-PAGE analyses as described above.
Electrophoretic mobility shift assay.
ZIKV NS5–RNA complex formation was assayed with an in vitro transcribed, cap-1 yeast mRNA (YLR164W, 749 nt), by agarose gel electrophoretic mobility shift. NS5 and STAT2 stocks were first diluted to 1 μM in THE-300 buffer (34 mM Tris, 57 mM HEPES, adjusted to pH 7.5 with glacial acetic acid; 0.1 mM EDTA, 300 mM NaCl, 0.05% (v/v) TWEEN 20, 25% (v/v) glycerol, 2 mM DTT, 0.2 mg/mL BSA). The mRNA was diluted to 522 ng/μL (~2 μM) in water, heated to 65 ˚C for 5 minutes in a dry block, then snap-cooled in ice. Final samples (7.5 μL) contained RNA (52 ng/μL), NS5 (110 nM), and STAT2 (90 nM), in THE-150 buffer (composition as for THE-300 buffer, but with 150 mM NaCl). Samples were mixed, incubated for 15 minutes at room temperature (~25 ˚C), and then directly loaded onto a 35 mL, pre-chilled (6 ˚C, > 30 minutes) 1% agarose gel cast with 34 mM Tris, 57 mM HEPES, pH 7.5, 0.1 mM EDTA, 10% (v/v) glycerol. The glycerol content of the samples was sufficient to allow loading in the absence of additional loading buffer. The gel was electrophoresed at 80 V in the casting buffer at 6 ˚C for 35 minutes, then stained with ethidium bromide and imaged with a Bio-Rad Gel Doc EZ imager. Images were analyzed with ImageJ.
ITC measurements.
Full-length ZIKV NS5 (120 μM) or human IRF9 (165 μM) proteins were each titrated with hSTAT2 (~20 μM) on a MicroCal iTC200 system (GE Healthcare). All protein samples were dialyzed against the ITC buffer (25 mM Tris-HCl, pH 7.5, 500 mM NaCl, 5% glycerol, 2mM β-mercaptoethanol) at 4°C overnight. A total of 15 injections with a spacing of 180 seconds and a reference power of 5 μcal/s were performed at 5°C. The ITC curves were processed with software ORIGEN (MicroCal) using one-site fitting model.
Cell lines and viruses.
293T, Vero and A549 cells were purchased from ATCC and cultured in high glucose Dulbecco’s modified Eagle’s medium (DMEM) supplemented with 5 mM L-glutamine and 10% fetal bovine serum (FBS). All cells were tested mycoplasma negative using the PlasmoTest™ kit (InvivoGen) following the standard protocol. The sub-cultures were validated by morphological evaluation under light microscope regularly. Zika virus (ZIKV/Macaca mulatta/UGA/MR-766/1947: GenBank: KX601169.1) and VSV-GFP were grown in Vero cells. Virus titers were determined by plaque assay with Vero cells.
Plasmids and transfections.
ZIKV NS5 and NS5 mutants were amplified by RT-PCR from total viral RNA and cloned into the pCAGGS vector. C-terminal HA or FLAG tags for these constructs were encoded in the reverse primer sequences. Dengue virus type 2 strain TSV01 (GenBank: AY037116.1) NS5, and NS5 mutants were amplified from a viral cDNA clone provided by Dr. Shou-wei Ding (Department of Microbiology and Plant Pathology, University of California, Riverside) and cloned into pCAGGS with a C-terminal HA tag encoded in the reverse primer. STAT1 and STAT2 mutants were cloned into pCAGGS by RT-PCR from RNA isolated from 293T cells, with C-terminal FLAG tags encoded in the reverse primer sequences. Transfections were done in 293T cells using polyethylenimine (PEI).
To generate recombinant MR766 ZIKV viruses, we generated a panel of mutants in DNA-ZIKV-MR766, the rescue system that carried the indicated mutations in NS5 gene39. Subsequently, we rescued the ZIKV mutants following a procedure reported previously39. Briefly, we transfected 293T cells with the different rescue constructs and subsequently transferred the supernatant to incubate with Vero cells for viral amplification.
Co-immunoprecipitation.
Using PEI, 1 × 10⁶ 293T cells were co-transfected with 0.5 μg each of pCAGGS encoding STAT1- or STAT2-FLAG and DENV or ZIKV NS5-HA, or their mutants. Cells were harvested 30 hours post-transfection (hpt) in NP-40 buffer (0.25% NP-40, 50 mM Tris (pH 7.4), 150 mM NaCl, 5 mM EDTA, 10% glycerol, and 1 mM PMSF). Transfected cells were subsequently lysed by rotating end-over-end at 4°C for 15 minutes, followed by centrifugation at 15,000 rpm in 4°C for 15 minutes. To evaluate the interaction between ZIKV NS5 and the endogenous hSTAT2 proteins, 1 × 10⁶ 293T cells were transfected with 0.5 μg each of pCAGGS encoding ZIKV NS5-HA, WT or mutant. Cells were harvested 30 hpt and lysed. To minimize the variation of the level of endogenous hSTAT2 proteins in the immunoprecipitation procedure, we supplied the lysate of 2X10⁶ 293T cells to each lysate sample transfected with ZIKV NS5-HA, WT or mutant. Immunoprecipitation was performed on the whole cell extract (WCE) by rotating end-over-end at 4°C for 1 hour with 1 μg mAb anti-FLAG antibody (F1804, Sigma) or 1 μg mAb anti-HA antibody (Catalog #26183, Thermo-Fisher) followed by rotating end-over-end at 4°C for 1 hour with recombinant protein G Sepharose 4B beads (Catalog #101243, Thermo-Fisher) pre-blocked with 5% bovine serum albumin (BSA). The beads were pelleted and washed 2 times with PBS, and bound protein was eluted by boiling in Laemmli buffer. Co-IPs and WCE were analyzed by SDS-PAGE followed by immunoblotting with mouse anti-GAPDH (Catalog #10087–384, VWR), anti-HA, and anti-FLAG primary antibodies followed by goat anti-mouse IgG (H+L) HRP-linked secondary antibody (Catalog #31160, Thermo-Fisher).
hSTAT2 degradation assay.
To investigate degradation of endogenous hSTAT2 in the presence of over-expressed NS5 mutants, 5 × 10⁵ 293T cells were PEI-transfected with increasing amounts (200 ng, 400 ng, 800 ng) of pCAGGS encoding HA-tagged NS5 variants. Cells were cultured with or without 10 nM proteasome inhibitor MG132 (Catalog # HY-13259C, Medchemexpress Llc). At 36 hpt, the cells were harvested in 1X Laemmli buffer and analyzed by SDS-PAGE followed by immunoblotting with anti-GAPDH, anti-HA, and rabbit anti-STAT2 primary antibodies (Catalog #72604S, Cell Signaling) followed by anti-mouse or goat anti-mouse secondary IgG antibodies (H+L) HRP-linked (Catalog #31460, Thermo-Fisher).
Confocal immunofluorescence microscopy.
To analyze the co-localization of over-expressed hSTAT2 and NS5 mutants, 293T cells grown on glass coverslips were co-transfected using PEI with 0.25 μg each of pCAGGS encoding hSTAT1- or hSTAT2-FLAG and ZIKV/DENV-2 NS5-HA, or their mutants. About 48 hpt, cells were fixed and permeabilized with methanol for 20 minutes at −20°C, and then blocked with 3% BSA/0.2% Tween-20/PBS at 30°C for 1 hour. The cells were incubated with mAb anti-HA and rabbit anti-FLAG primary antibodies (Catalog #14793S, Cell Signaling) for 1 hour at 30°C, followed by two 5-minute washes with PBS+0.2% Tween-20 (PBS-T). Alexa Fluor 555-conjugated anti-mouse and Alexa Fluor 488-conjugated anti-rabbit secondary antibodies were added to the cells for 1 hour at 30°C. After two additional washes with PBS, the coverslips were mounted onto slides with Vectashield (Vector Laboratories) containing DAPI. Images were captured using a Leica SP5 confocal microscope. Confocal laser scanning was performed using a Zeiss LSM 880 Meta (Carl Zeiss Microimaging, Thornwood, NY) fitted with a Plan Apochromatic X63/1.4 or X40/1.4 oil objective lens. Images were collected at 16 bits and at a resolution of 1024 by 1024 pixels. A total of 100 cells per condition were counted and analyzed by microscopy. Image processing and analysis were carried out using Fiji/ImageJ software.
VSV-GFP assay.
To determine the overall levels of IFN influenced by NS5 or NS5 mutants, 2.5 × 10⁵ 293T cells were transfected with pCAGGS encoding HA-tagged NS5 and NS5 MutYRDH. At 30 hpt, the transfected cells were primed with 2 μg poly(I:C) transfection. 18 hours later serial 1:2 dilutions of the supernatants from cultures transfected with the NS5 variants were used to treat A549 cells. 24 hours after supernatant treatment, A549 cells were infected with VSV-GFP (gift from Dr. Dusan Bogunovic) at MOI=1. Infected cells were visualized 24 hpi for GFP expression by the Nikon Eclipse te2000-U fluorescent microscope.
Quantitative RT-PCR.
To quantitate ISG54 mRNA levels in the presence of NS5 or NS5 mutants, 5 × 10⁵ 293T cells were PEI-transfected with increasing amounts of pCAGGS encoding HA-tagged NS5 variants (NS5: 200 ng, 500 ng and 1000 ng; NS5 MutYRDH: 200 ng, 400 ng and 800 ng). At 30 hpt, the transfected cells were treated with 1,000 U/mL universal type I interferon (PBL, 11200–1) for 18 hours. After IFN treatment, cells were harvested in PBS and split into two equal-volume samples. One sample was re-suspended in Laemmli buffer and analyzed by SDS-PAGE followed by immunoblotting with anti-GAPDH and anti-HA antibodies. The second sample was used to isolate total RNA for qRT-PCR using Trizol (Catalog # N8080127, Fisher). 1 μg of RNA was reverse transcribed using random hexamer (Catalog # N8080127, Fisher). qRT-PCR was performed using iQ™ SYBR Green Supermix (Catalog # 1708880, BioRad). The ΔCt values were calculated using β-actin mRNA as the internal control. The ΔΔCt values were determined using control samples (non-transfected non-IFN-treated) as the reference value. Relative levels of transcripts were calculated using the formula 2(-ΔΔCt).
Multi-cycle growth curve experiment.
To compare the replication kinetics of our mutant viruses to rWT ZIKV, we performed multi-cycle growth curve experiments, in which IFN-competent A549 cells or IFN-deficient Vero cells were infected (MOI of 1) for 1 hr. with either the rescued mutant virus or the rescued WT virus. Supernatants were collected daily up to 4 days post infection, and then titers of the supernatants were determined by plaque assays in Vero cell.
IFN-β promoter-driven luciferase activity assay.
293T cells were transfected with the plasmids encoding IFN-β promoter firefly luciferase reporter, renilla luciferase (for normalization), ZIKV NS5-HA (wild type or mutant) or controls, and stimulating factors RIG-I (2CARD), TBK1 or IRF3, respectively, 0.25 μg of each. Cells were harvested at 24 h post-transfection and subjected to the Dual-Luciferase Assay System (Promega) based on manufacturer’s instructions. Data were normalized first by renilla luciferase values, and then normalized by none stimulated samples to obtain fold induction. Empty vector samples were set as 100% fold induction. Error bars represent mean ± SD. Results are representative of three independent experiments with each one in triplicate.
Statistics and Reproducibility.
Data are presented as the mean ± s.d. of at least three independent experiments. For analysis of the qRT-PCR results, two-tailed Student’s t-test was used with a CI of 95% (the degrees of freedom is 4). For the analysis of the growth curves, the two-way ANOVA test with Tukey’s multiple comparisons test was used to evaluate significant differences (for comparison of viruses in Vero cells, degrees of freedom (DF) is 2 and F value is 1.849; for comparison of viruses in A549 cells, degrees of freedom (DF) is 2 and F value is 55.84). For both analyses, a p value of less than 0.05 was considered significant. All biochemical and cellular assays were performed three or more times with similar results, unless indicated otherwise.
Reporting summary.
Further information on experimental design is available in the Nature Research Reporting Summary linked to this article.
Data availability.
Coordinates and structure factors for the ZIKV RdRP – hSTAT21–713 complexes have been deposited in the wwProtein Data Bank with accession code PDB 6UX2. Cryo-EM density map and atomic coordinates of the NS5–hSTAT2 complex have been deposited to the EMDB and PDB under the accession numbers of EMD-21618 and PDB 6WCZ, respectively. Uncropped images and data behind graphs are available in Supplementary Data 1 and 2, respectively.
Extended Data
Extended Data Figure 1. Structural analysis of the RdRP domain of ZIKV NS5 in complex with hSTAT21–713.
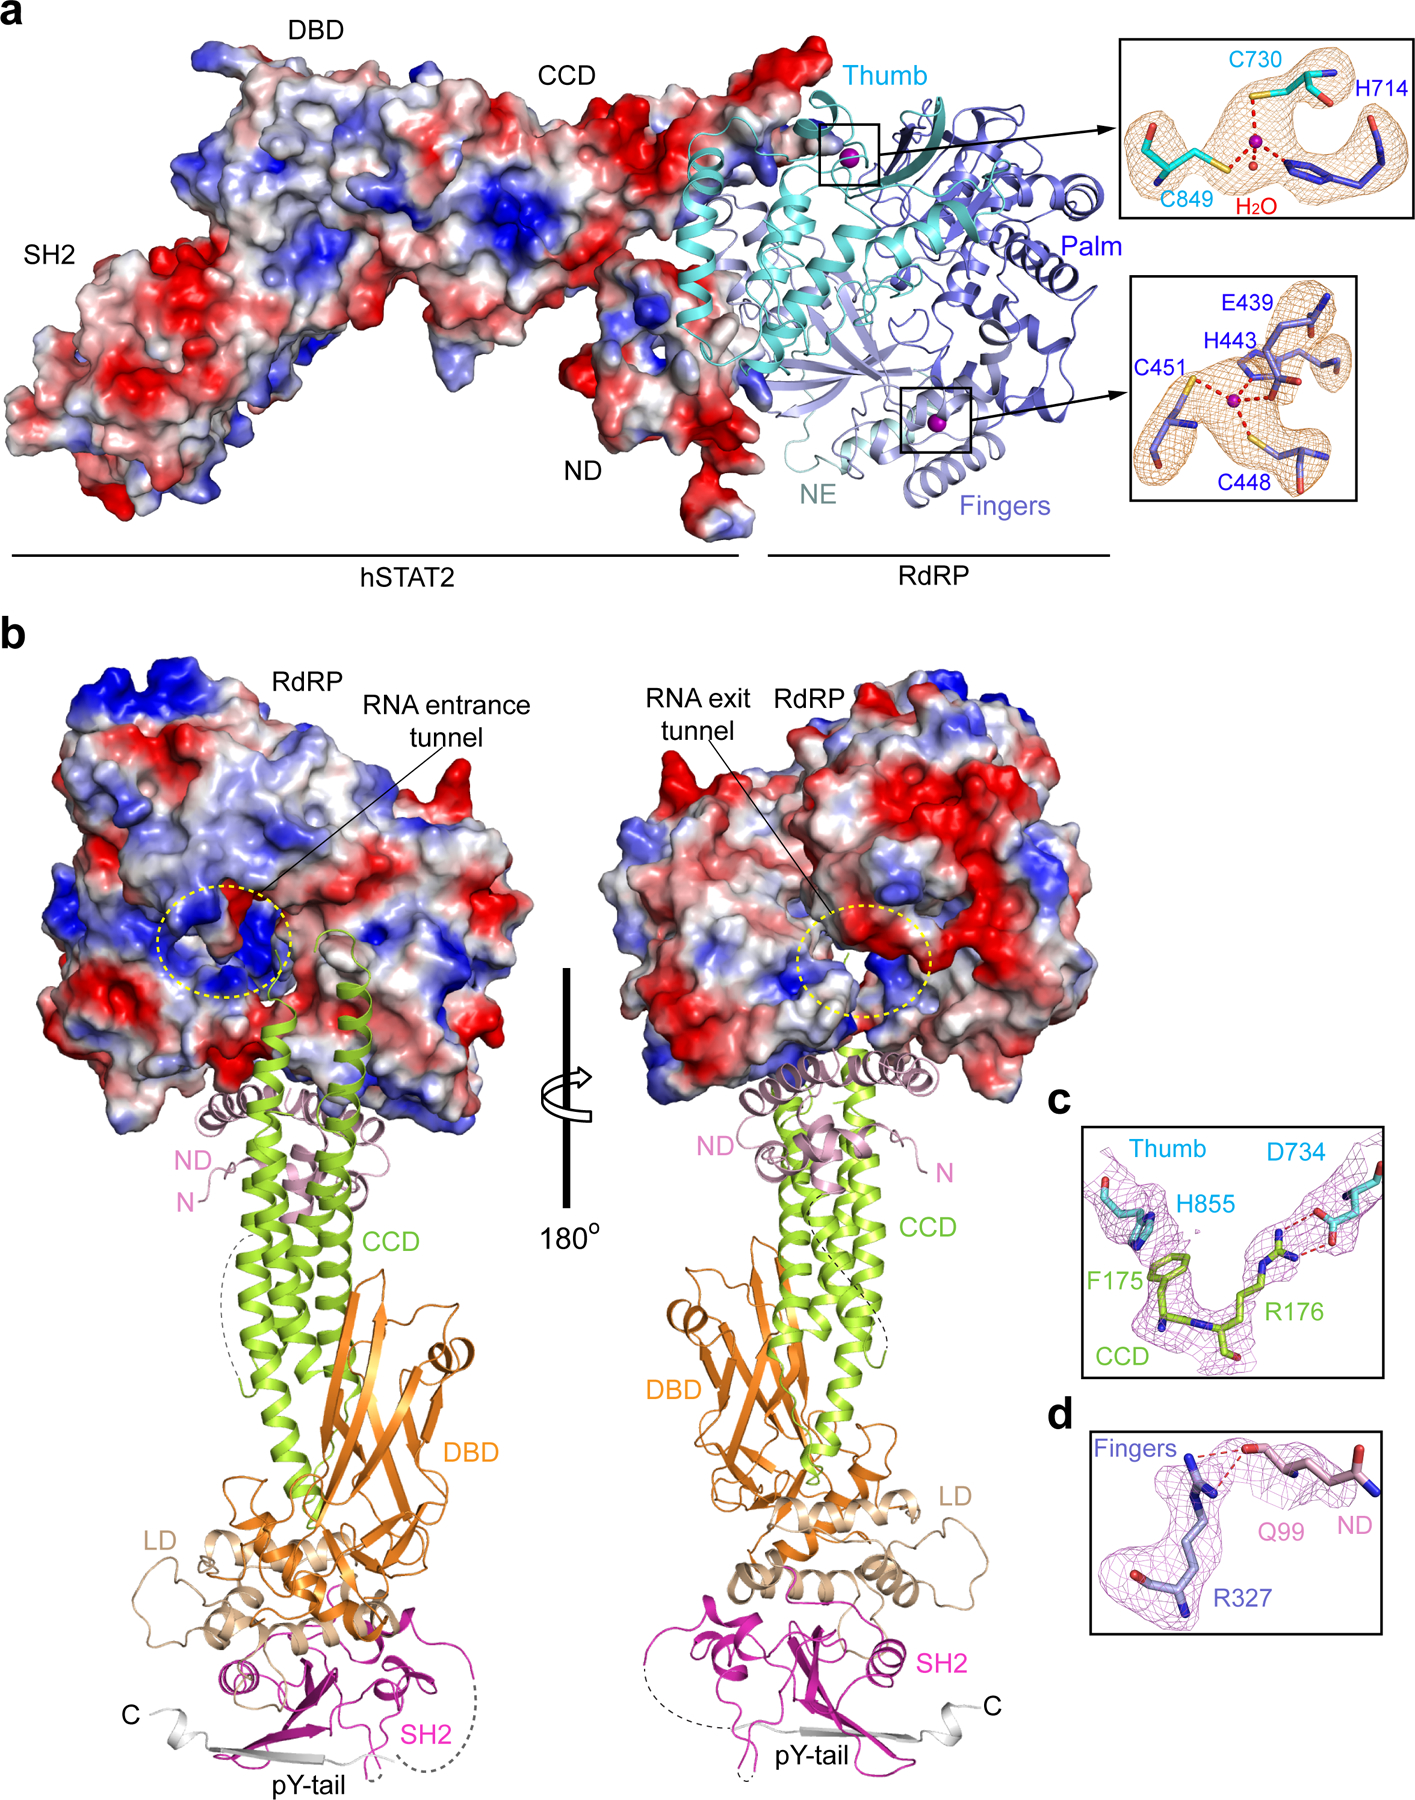
a, The structure of the NS5 RdRP-hSTAT21–713 complex, with hSTAT21–713 shown as electrostatic surface and RdRP shown as ribbon diagram. The two zinc clusters of NS5 RdRP are shown in expanded views, surrounded with Fo-Fc omit map (orange) contoured at 2.0 σ level. b, Two opposite views of the structure of the NS5 RdRP-hSTAT21–713 complex, with hSTAT21–713 shown as ribbon diagram and RdRP shown as electrostatic surface. The RNA entrance and exit tunnels of NS5 RdRP are marked with dashed circles (yellow). The disordered linkers of hSTAT21–713 are depicted as dashed lines. N- and C-termini are indicated by letter ‘N’ and ‘C’. c,d, Fo-Fc omit maps (violet) of selected residues for intermolecular interactions at the RdRP-CCD (c) and RdRP-ND (d) interfaces, contoured at 2.0 σ level. The color schemes for the RdRP and hSTAT2 are the same as that in Figure 1.
Extended Data Figure 2. Structural comparison of hSTAT2 and hSTAT1.
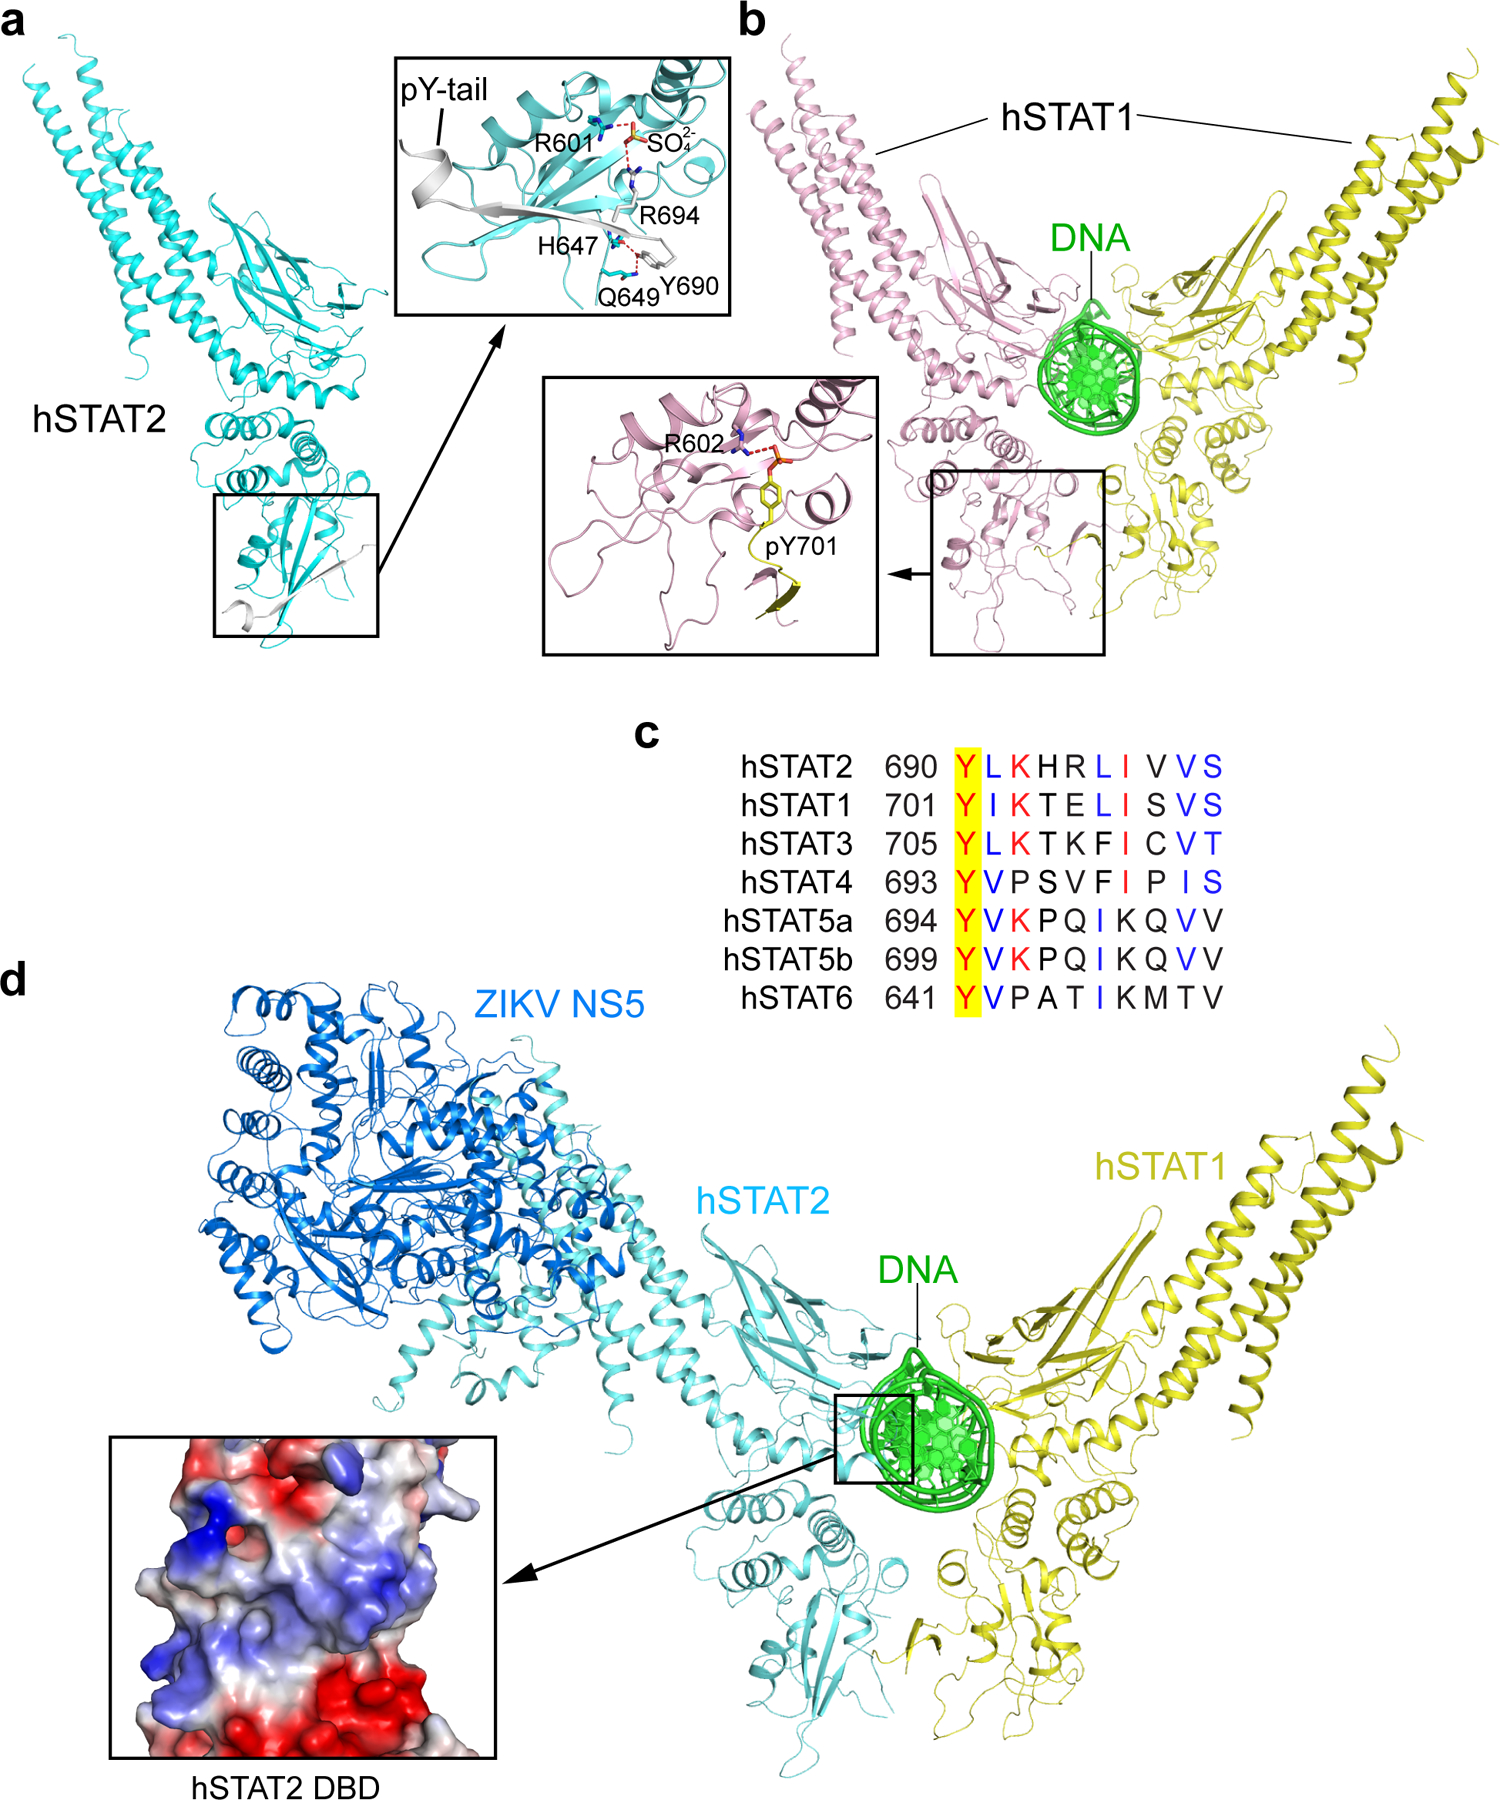
a, Ribbon representations of the CF of hSTAT2 (cyan) in association with its pY-tail segment (grey). The intramolecular interaction between the SH2 domain and the unphosphorylated pY-tail segment of hSTAT2 is highlighted in the expanded view. The hydrogen bonds are depicted as dashed lines. b, Ribbon representation of homodimeric hSTAT1 in complex with DNA, with the intermolecular interaction between the hSTAT1 SH2 domain (light pink) and the phosphorylated pY-tail segment from the other monomer (yellow) of the hSTAT1 homodimer shown in the expanded view. c, Sequence alignment of the pY-tail segments of human STAT proteins. Identical and similar residues are marked in red and blue, respectively. The target tyrosine is shaded in yellow. d, Structural model of the ZIKV NS5–hSTAT2–hSTAT1–DNA complex, with the surface electrostatic view of the hSTAT2 DBD shown in the expanded view.
Extended Data Figure 3. Cryo-EM analysis of the ZIKV NS5–hSTAT2 complex.
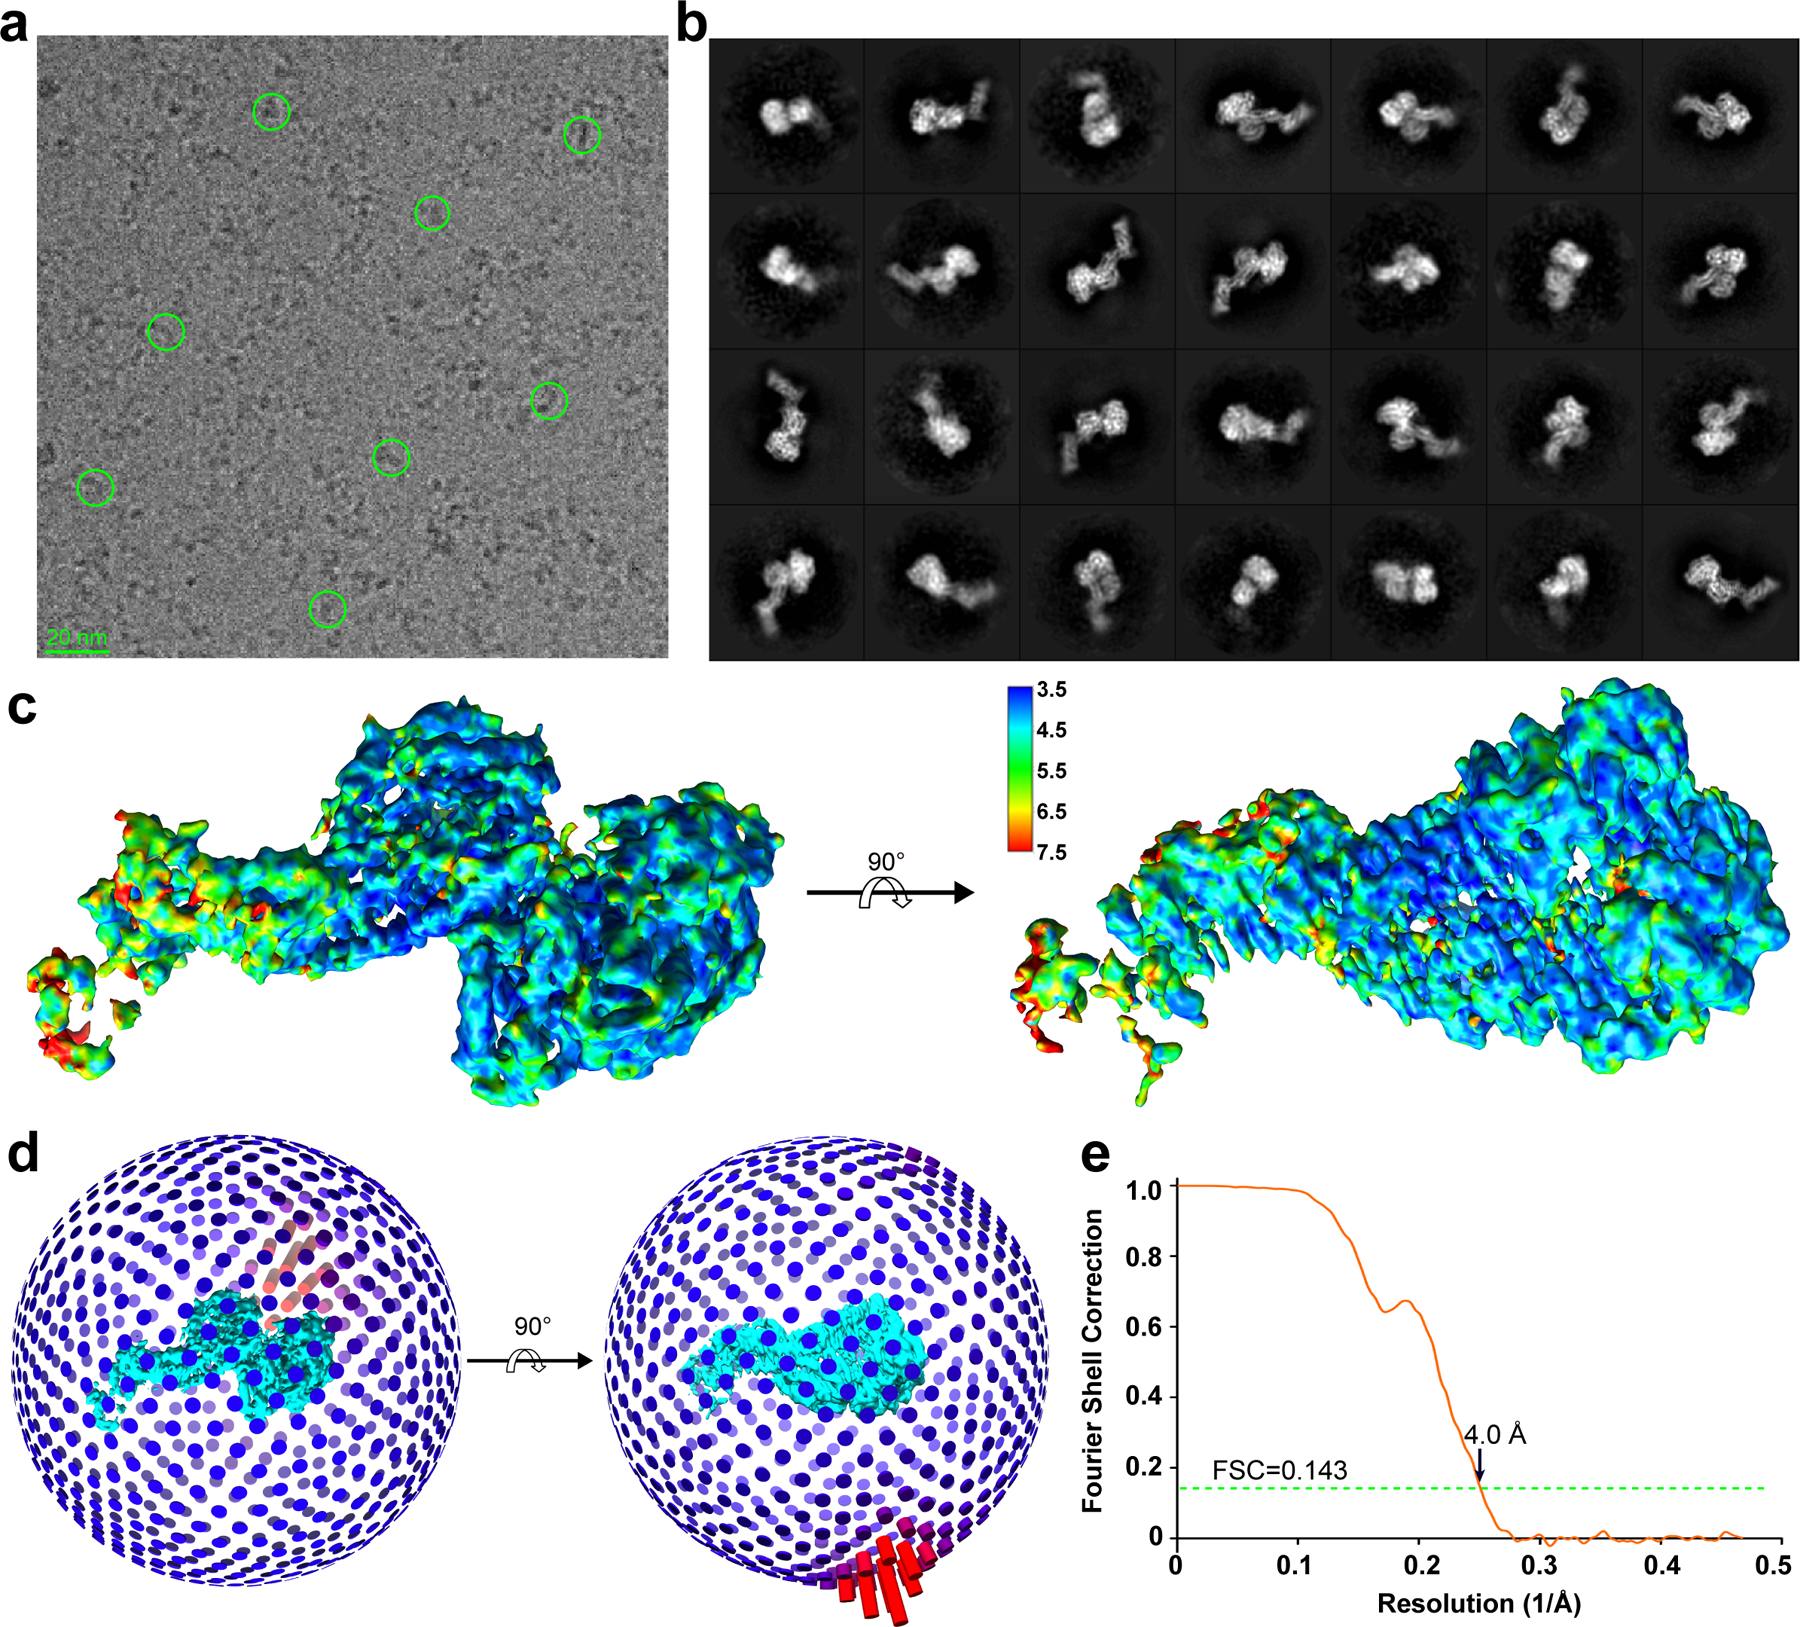
a, A representative cryo-EM micrograph with select particles circled. b, 2D class averages used to generate the model. c, Local resolution evaluation of the reconstructed map by Resmap. d,e, Angular distribution (d) and global resolution evaluation based on “gold-standard” Fourier shell correction (FSC) (e), both generated by RELION.
Extended Data Figure 4. Details of the cryo-EM densities overlaid with their atomic models (ribbon) of the domains in ZIKV NS5–hSTAT2 complex.
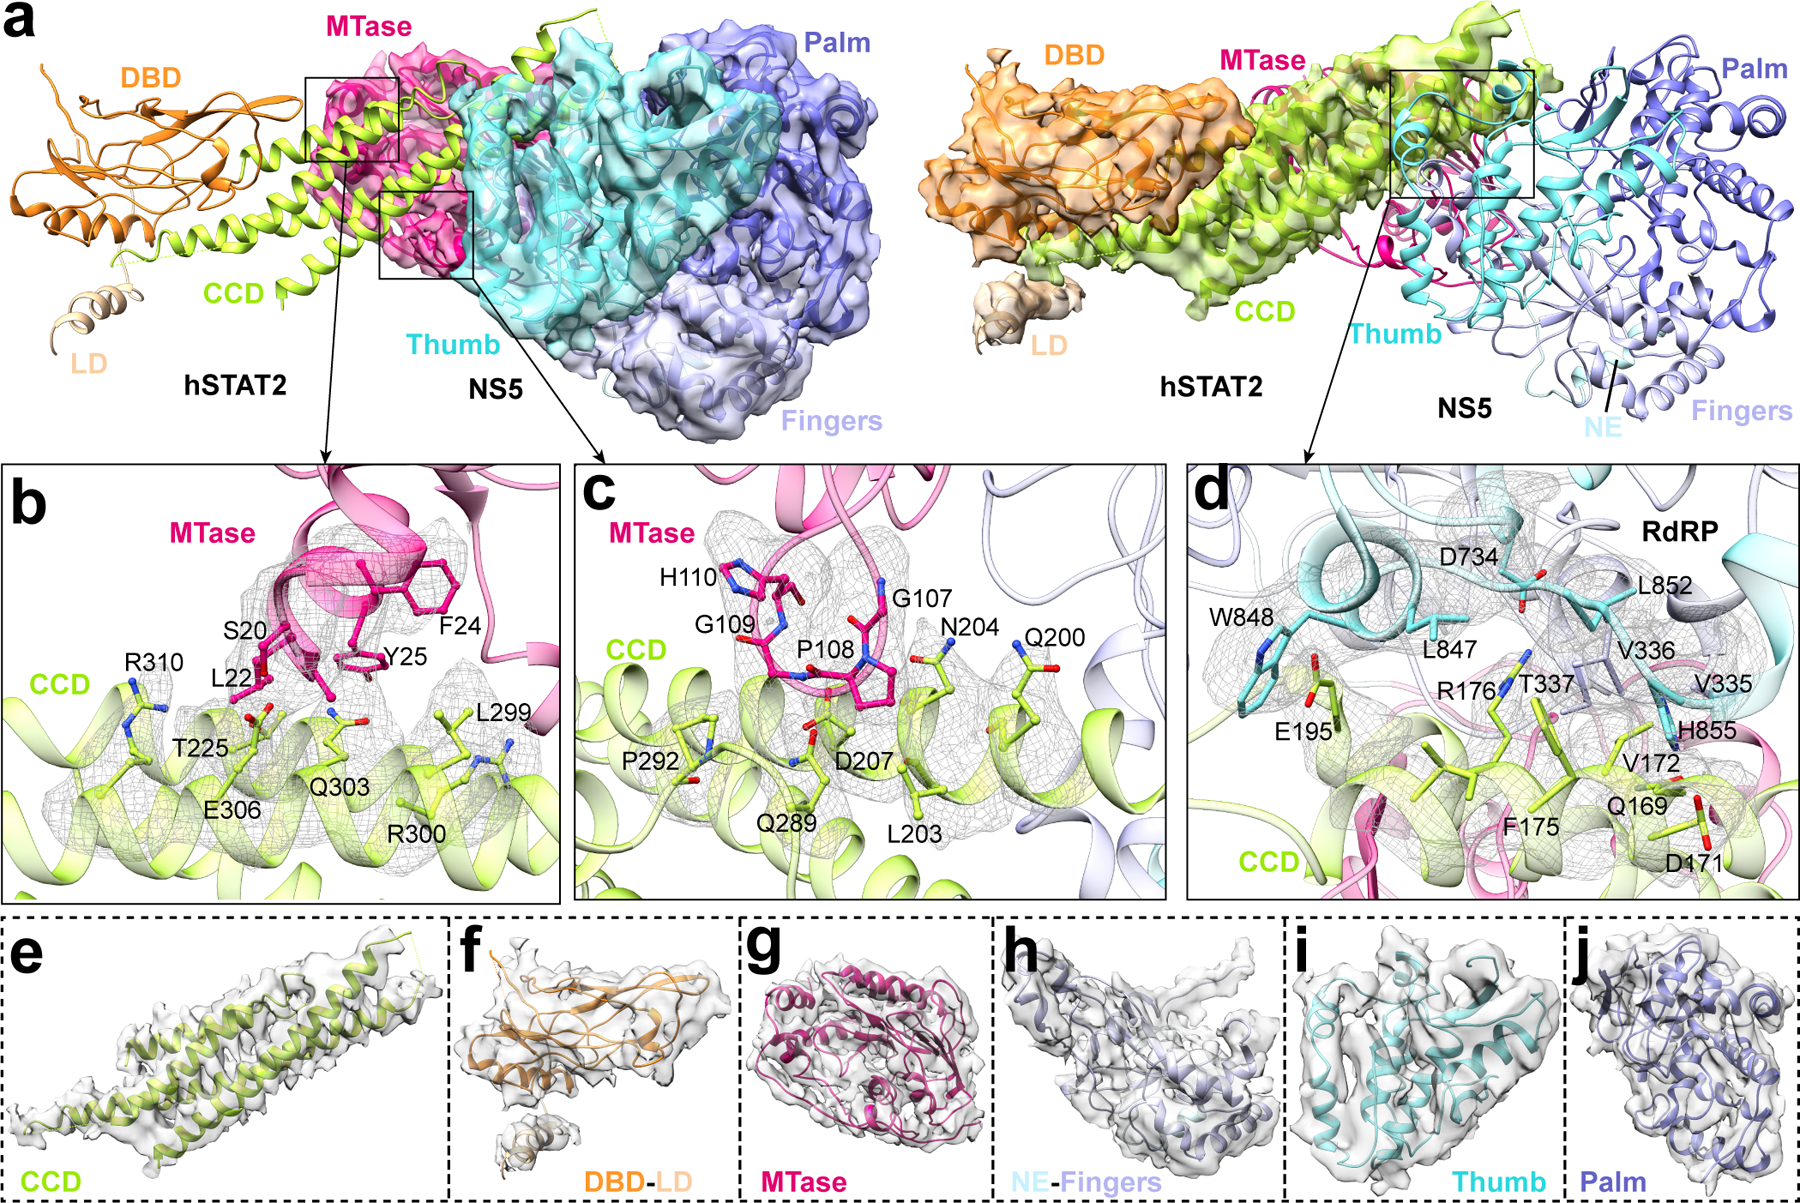
a, Ribbon representations of the atomic model of NS5–hSTAT2, with NS5 (left) and hSTAT2 (right) overlaid with their respective density maps. b,c, Details for the MTase–CCD interaction, with densities of interacting residues shown as mesh. d, Details for the RdRP–CCD interaction, with densities of interacting residues shown as mesh. e,f, CCD, DBD and LD domains in hSTAT2. g-j, MTase, NE and Fingers, Thumb, and Palm domains in NS5.
Extended Data Figure 5. Biochemical analysis of the interaction between ZIKV NS5 and hSTAT2.
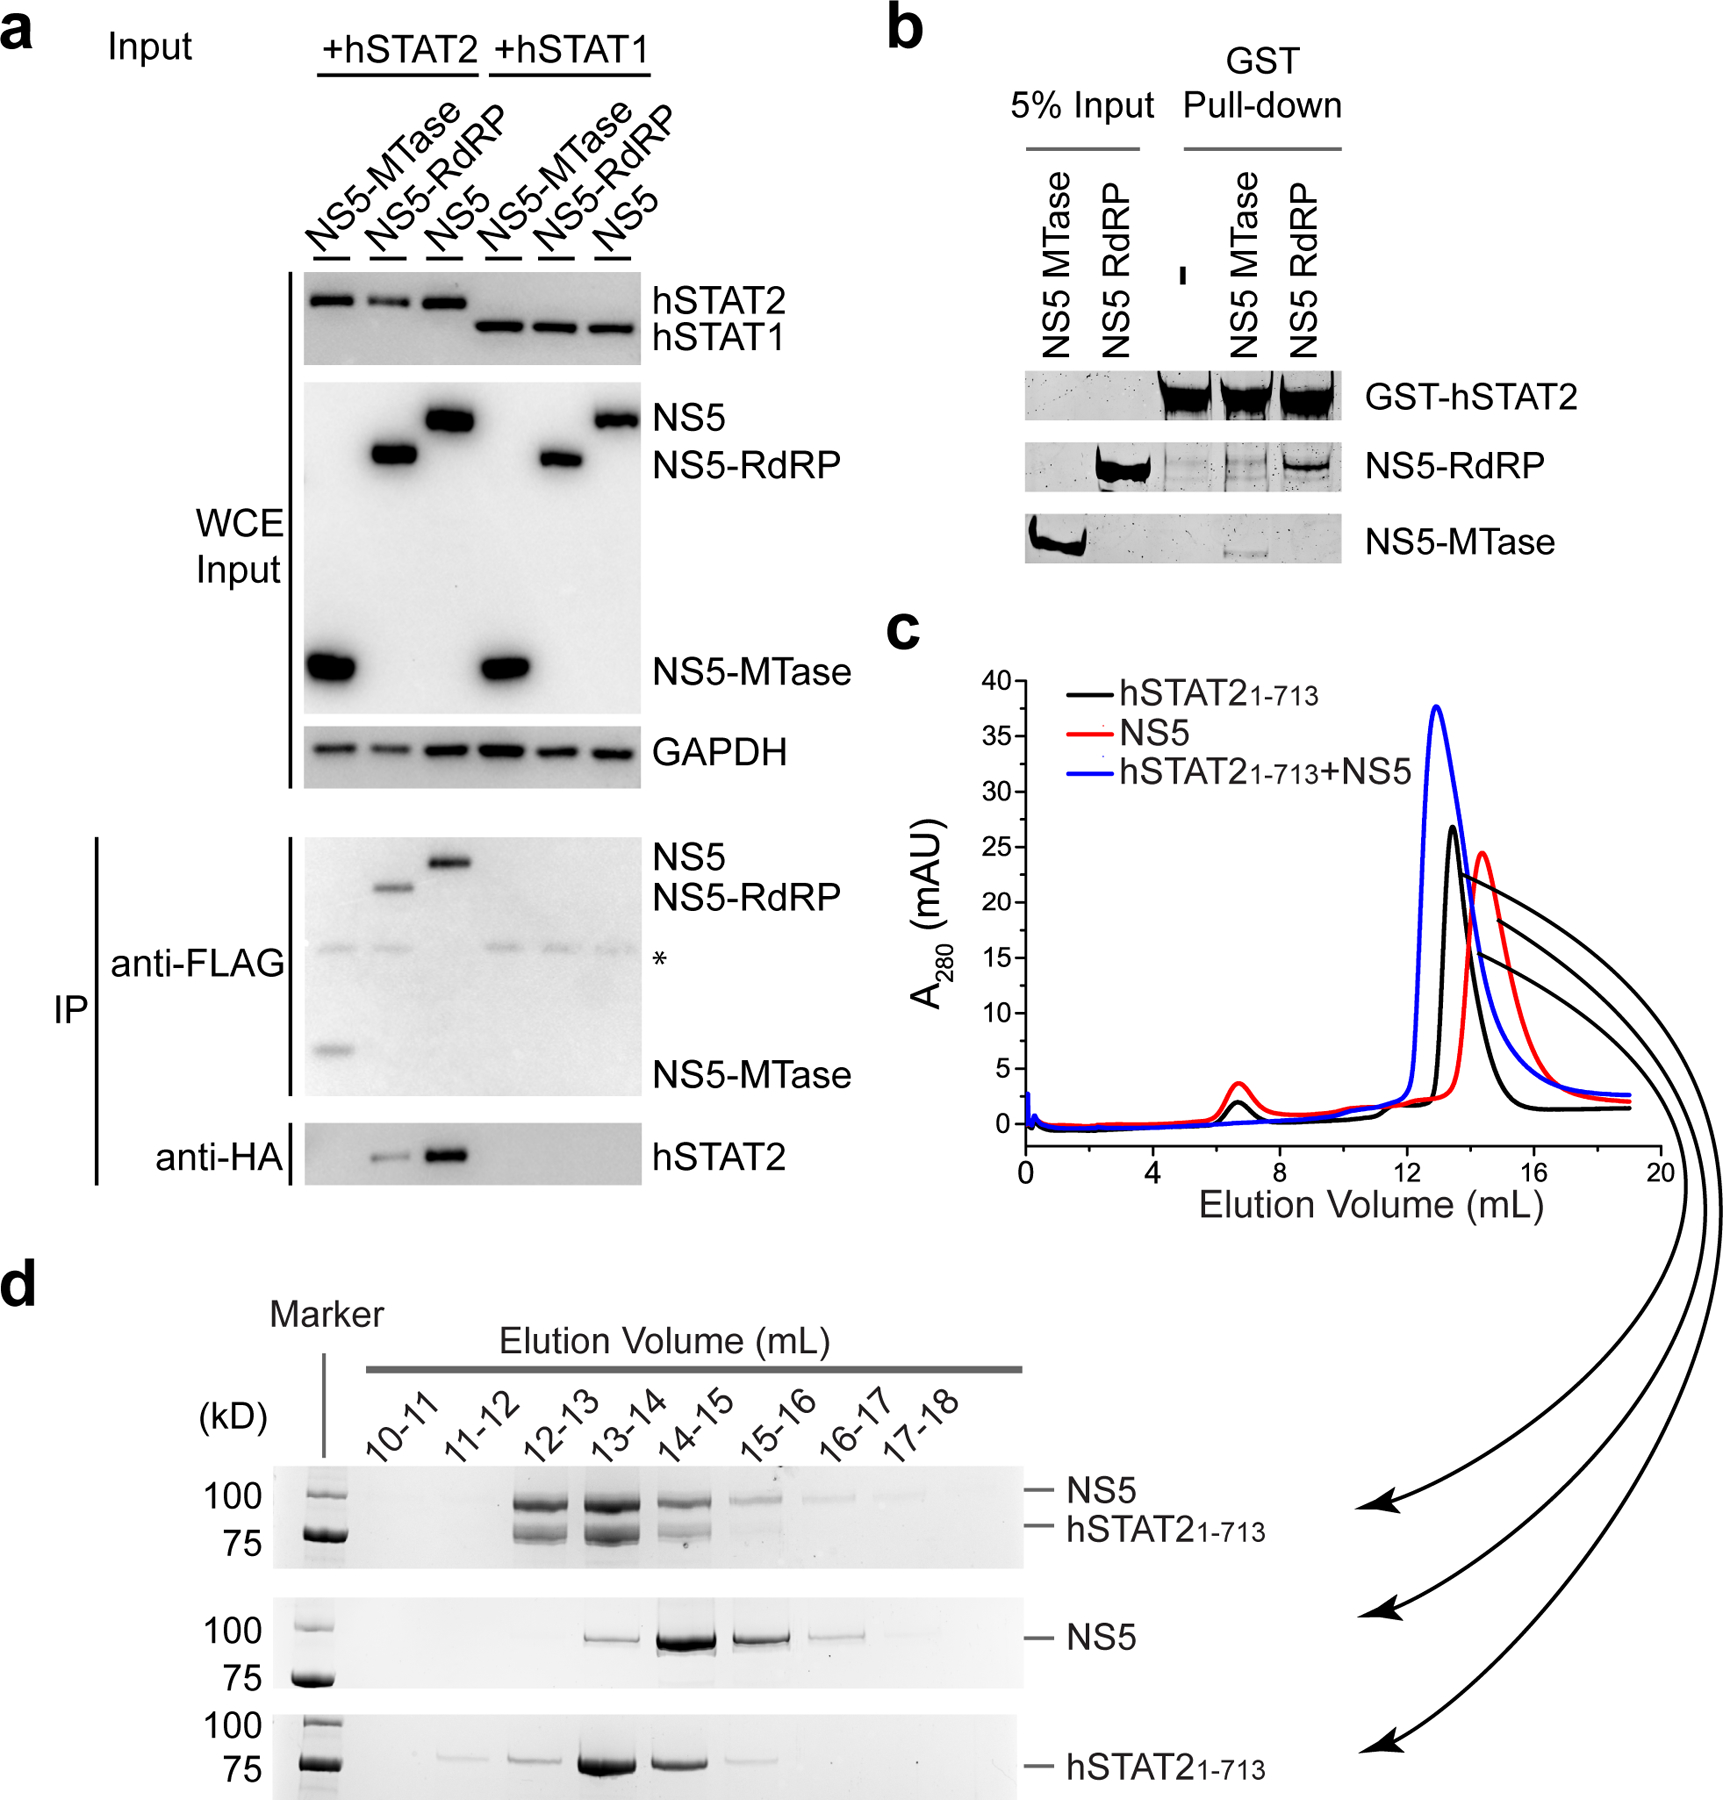
a, Co-IP assay of 293T cells transfected with plasmids encoding C-terminally HA-tagged NS5 (NS5-HA) and FLAG-tagged hSTAT2 (hSTAT2-FLAG) or hSTAT1 (hSTAT1-FLAG). Immunoblot analysis of the whole cell extract (WCE) was used as input. IP was performed using antibodies against HA, FLAG and GAPDH. *antibody heavy chain. b, GST pull-down assay of the MTase and RdRP domains of ZIKV NS5 using GST-tagged full-length hSTAT2. c, Size-exclusion chromatography analysis of the interaction between hSTAT21–713 and ZIKV NS5. d, SDS-PAGE analysis of the elution fractions in (c). Uncropped gel images for a,b,d are shown in Supplementary Data 1.
Extended Data Figure 6. Structural analysis of the ZIKV NS5–hSTAT2 interaction.
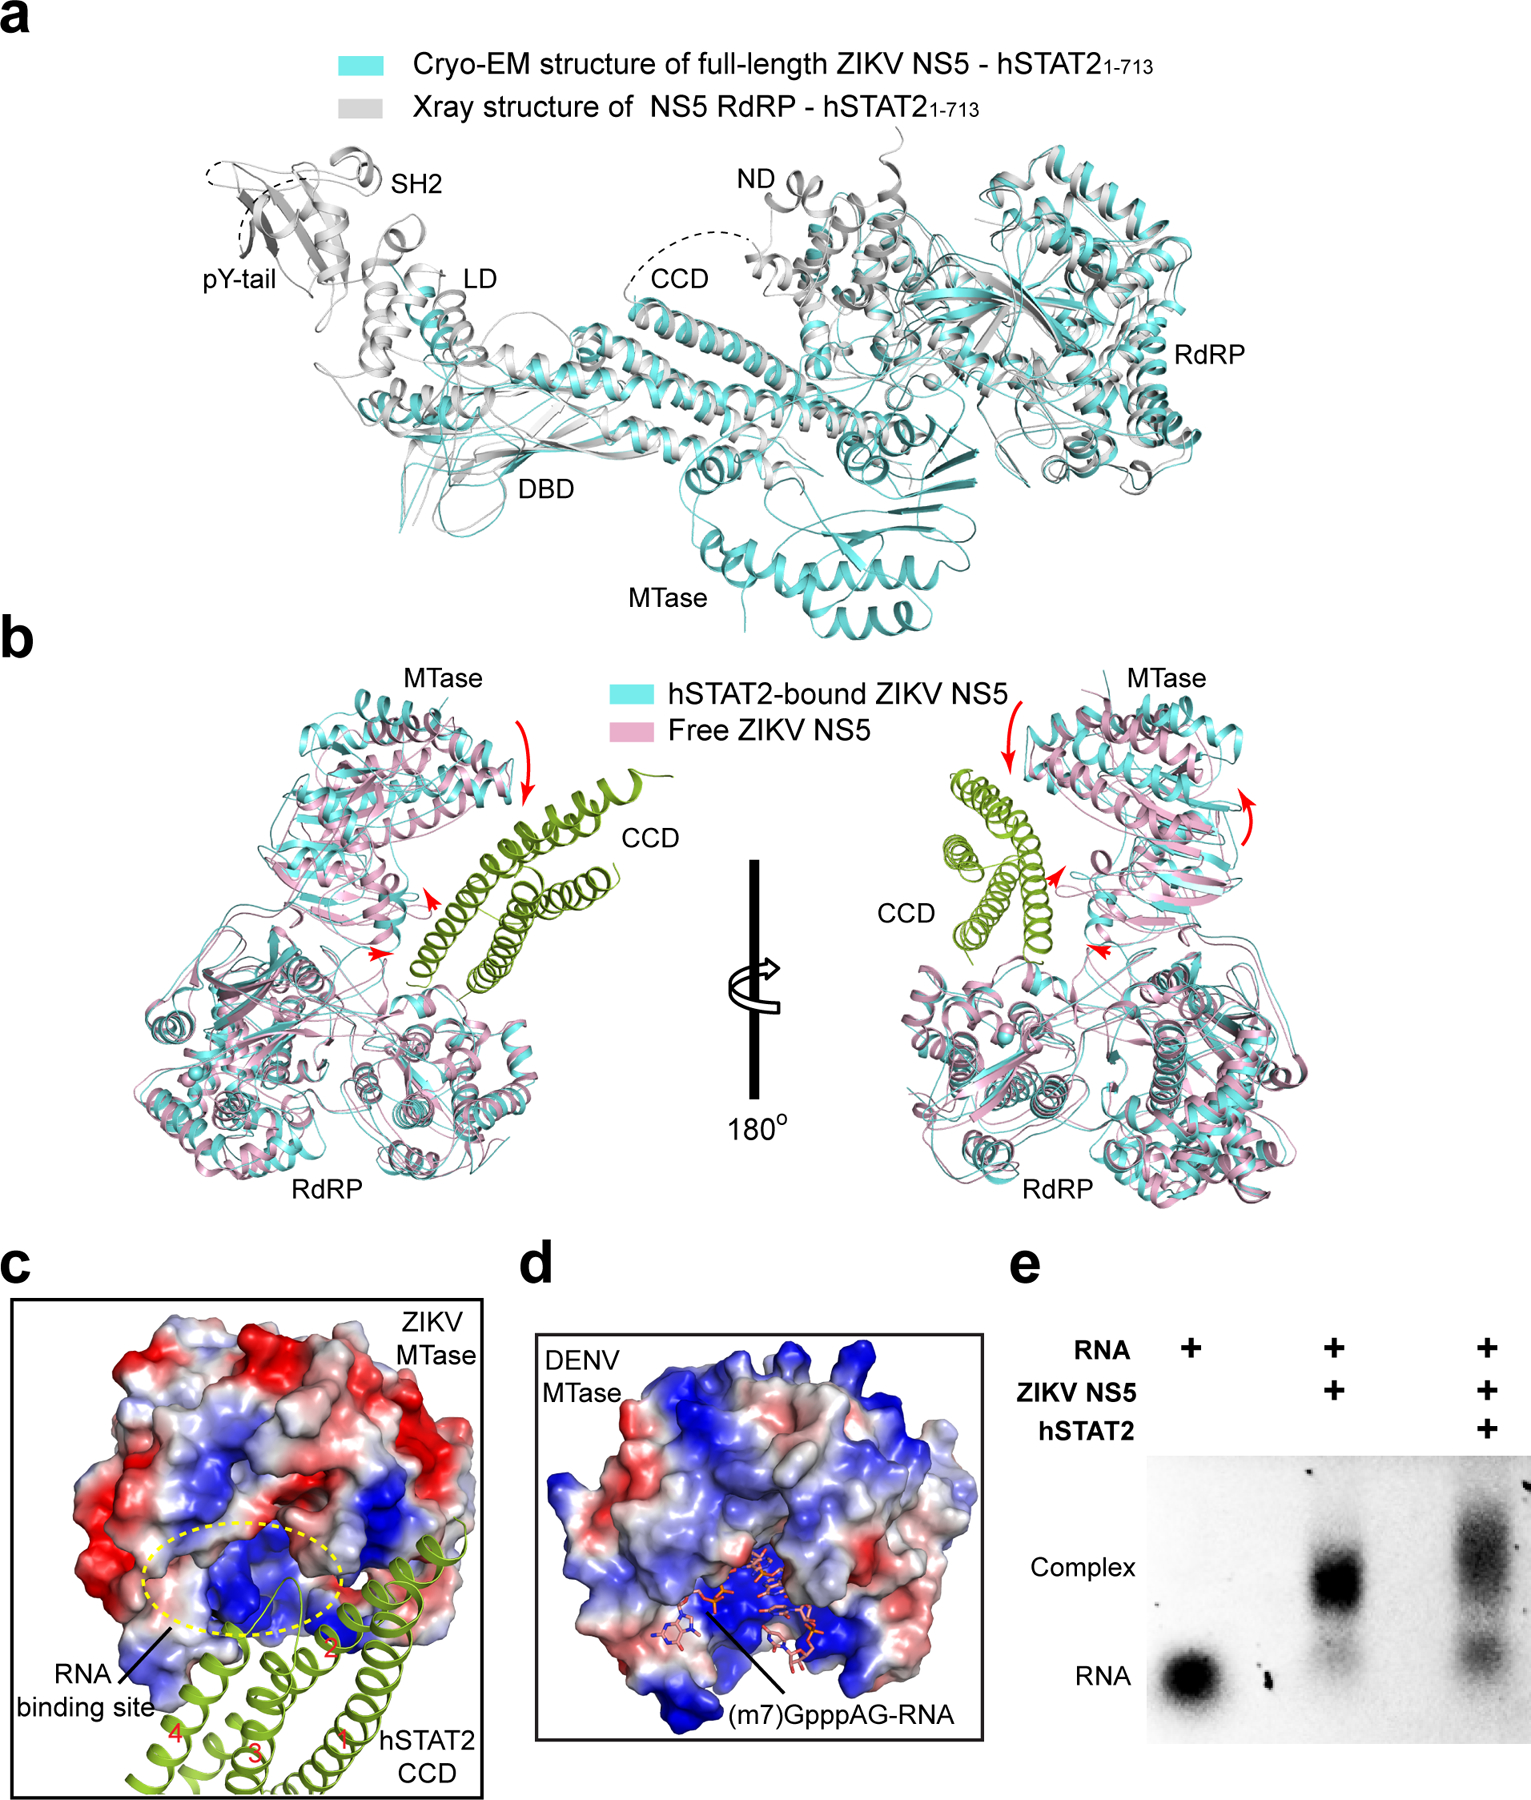
a, Superposition of the crystal structure of NS5 RdRP–hSTAT21–713 (grey) and the cryo-EM structure of full-length NS5–hSTAT21–713 (cyan). While the cryo-EM structure contains the MTase domain, there is no change in the relative orientations of different domains between the two structures. b, Structural superposition of free (PDB 5TMH) and hSTAT2-bound ZIKV NS5. The conformational transition of the MTase domain of ZIKV NS5 from free state to the hSTAT2-bound state is indicated by arrows. For clarity, all the hSTAT2 domains, except for the CCD, were removed. c, Surface view of the MTase domain of ZIKV NS5 bound to hSTAT2 CCD (green ribbon). The four helices of the CCD are sequentially numbered from ‘1’ to ‘4’. The potential RNA binding site is indicated by dashed circle. d, Surface of the DENV-3 MTase bound to viral cap-0 RNA (PDB 5DTO). e, hSTAT2 inhibition of ZIKV NS5–RNA binding assayed by electrophoretic mobility shift. Addition of NS5 to a cap-1 (m7GpppG2ʹOMe) yeast mRNA (YLR164W, 749 nt) resulted in a shift of the RNA band. Further addition of STAT2 resulted in release of RNA from the NS5–RNA complex, with concomitant accumulation of free RNA. Uncropped gel image for e is shown in Supplementary Data 1.
Extended Data Figure 7. Mutational analysis of the interaction between ZIKV NS5 and hSTAT2.
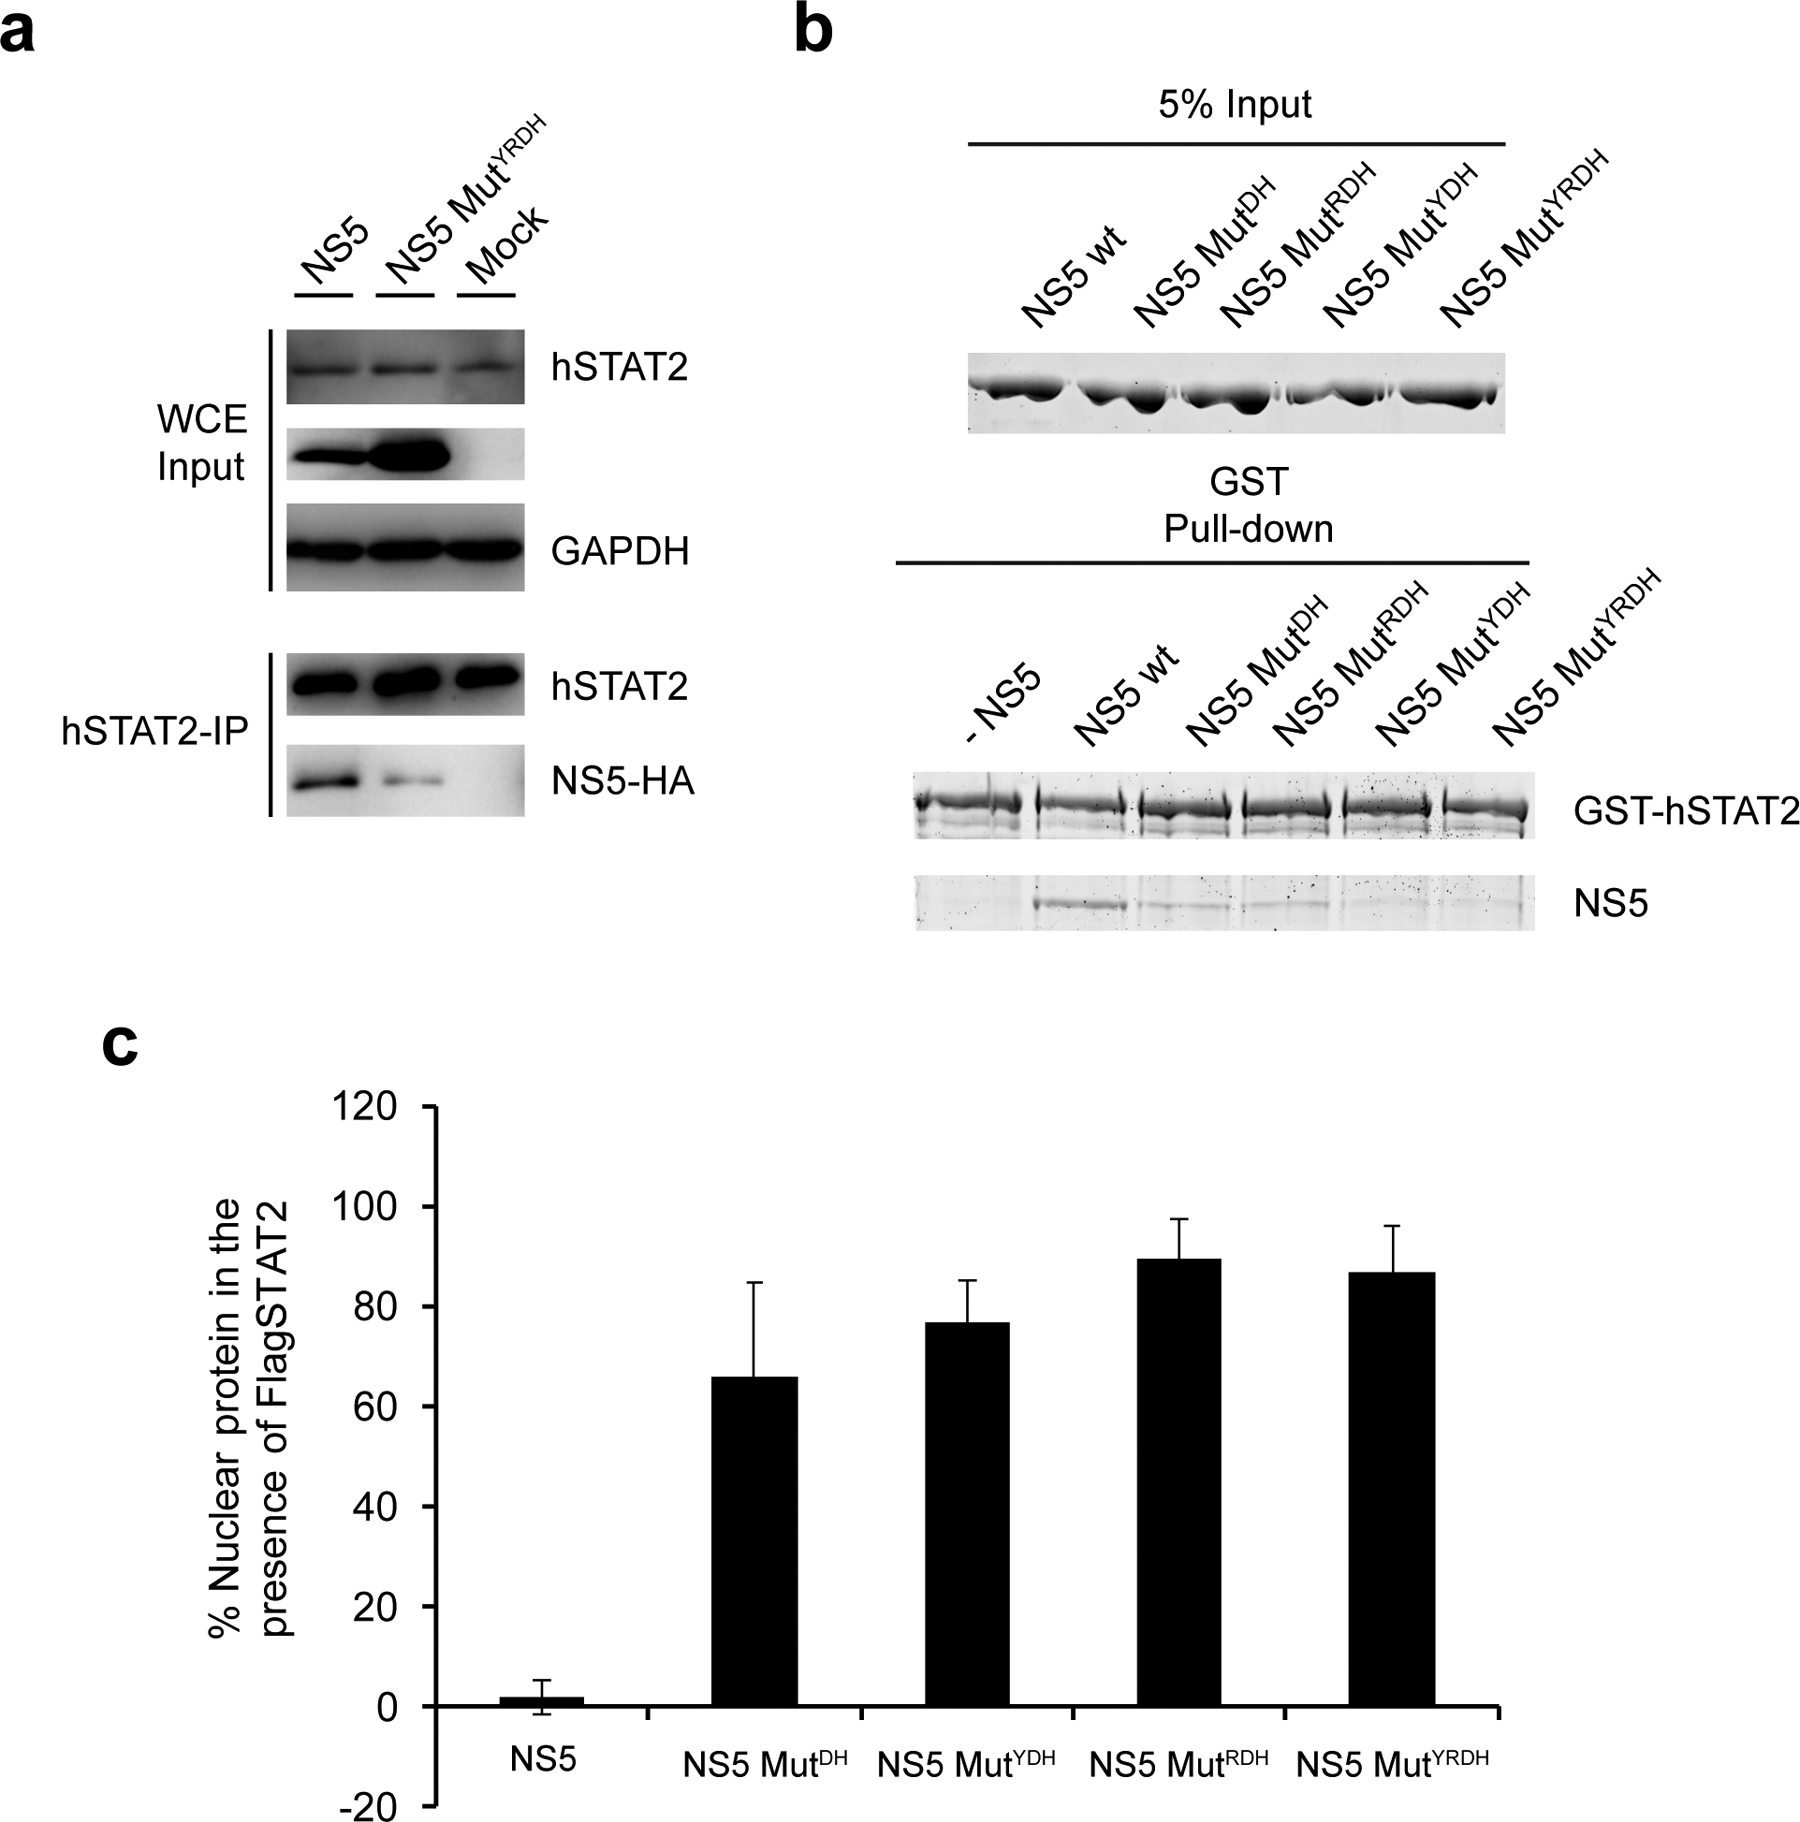
a, IP analysis of endogenous hSTAT2 in 293T cells transfected with WT or mutYRDH NS5. Immunoblot was performed using antibodies against hSTAT2, HA, and GAPDH. b, In vitro pull-down assay of ZIKV NS5 mutations using GST-hSTAT2 as bait. wt: wild type. The experiment was repeated twice with consistent results. c, Quantification of nuclear localization of NS5, WT or mutants as shown in Fig. 3i. Uncropped blots for a and source data for graphs in c are shown in Supplementary Data 1 and 2, respectively.
Extended Data Figure 8. ZIKV NS5 competes against IRF9 for hSTAT2 binding.
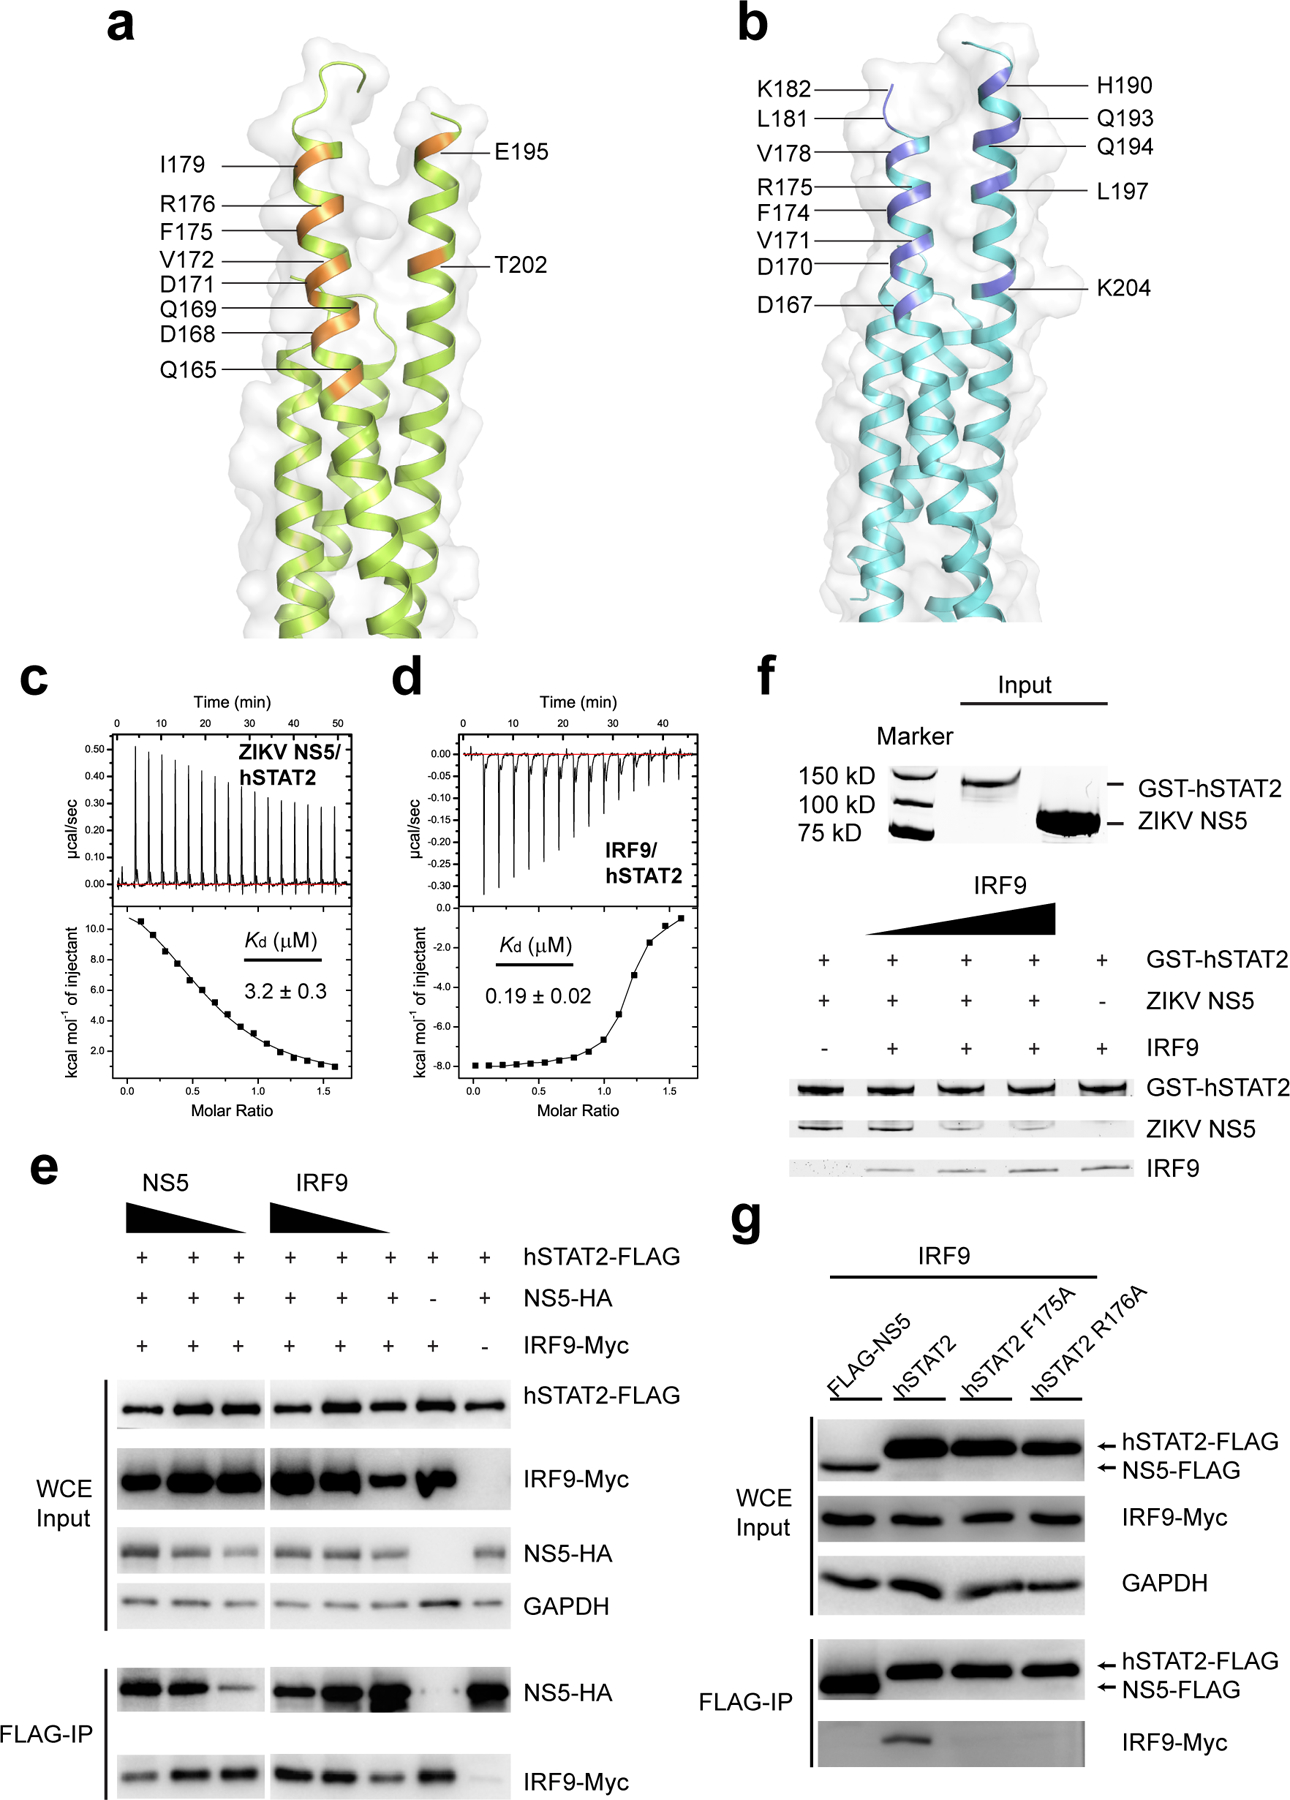
a, Ribbon and surface view of the ZIKV NS5-binding sites (orange) of hSTAT2 CCD. b, Ribbon and surface view of the ZIKV NS5-binding sites (blue) of mouse STAT2 CCD. c,d, ITC binding curves of hSTAT2 over ZIKV NS5 (c) and IRF9 (d). The ITC binding assays were performed twice for the hSTAT2-NS5 interaction with similar results, and once for the hSTAT2-IRF9 interaction. e, Co-IP assay of HA-tagged ZIKV NS5 (NS5-HA), FLAG-tagged hSTAT2 (hSTAT2-FLAG) or hSTAT1 (hSTAT1-FLAG) and Myc-tagged IRF9 (IRF9-Myc). f, In vitro pull-down assay of ZIKV NS5 using GST-hSTAT2 in the presence of various amount of IRF9. g, IP assay of IRF9-Myc with hSTAT2-FLAG, wild type or mutant. The experiment in (g) was repeated once with similar results. Uncropped gel or blot images for e-g are shown in Supplementary Data 1.
Extended Data Figure 9. Sequence and structural analyses of the DENV NS5–hSTAT2 interaction.
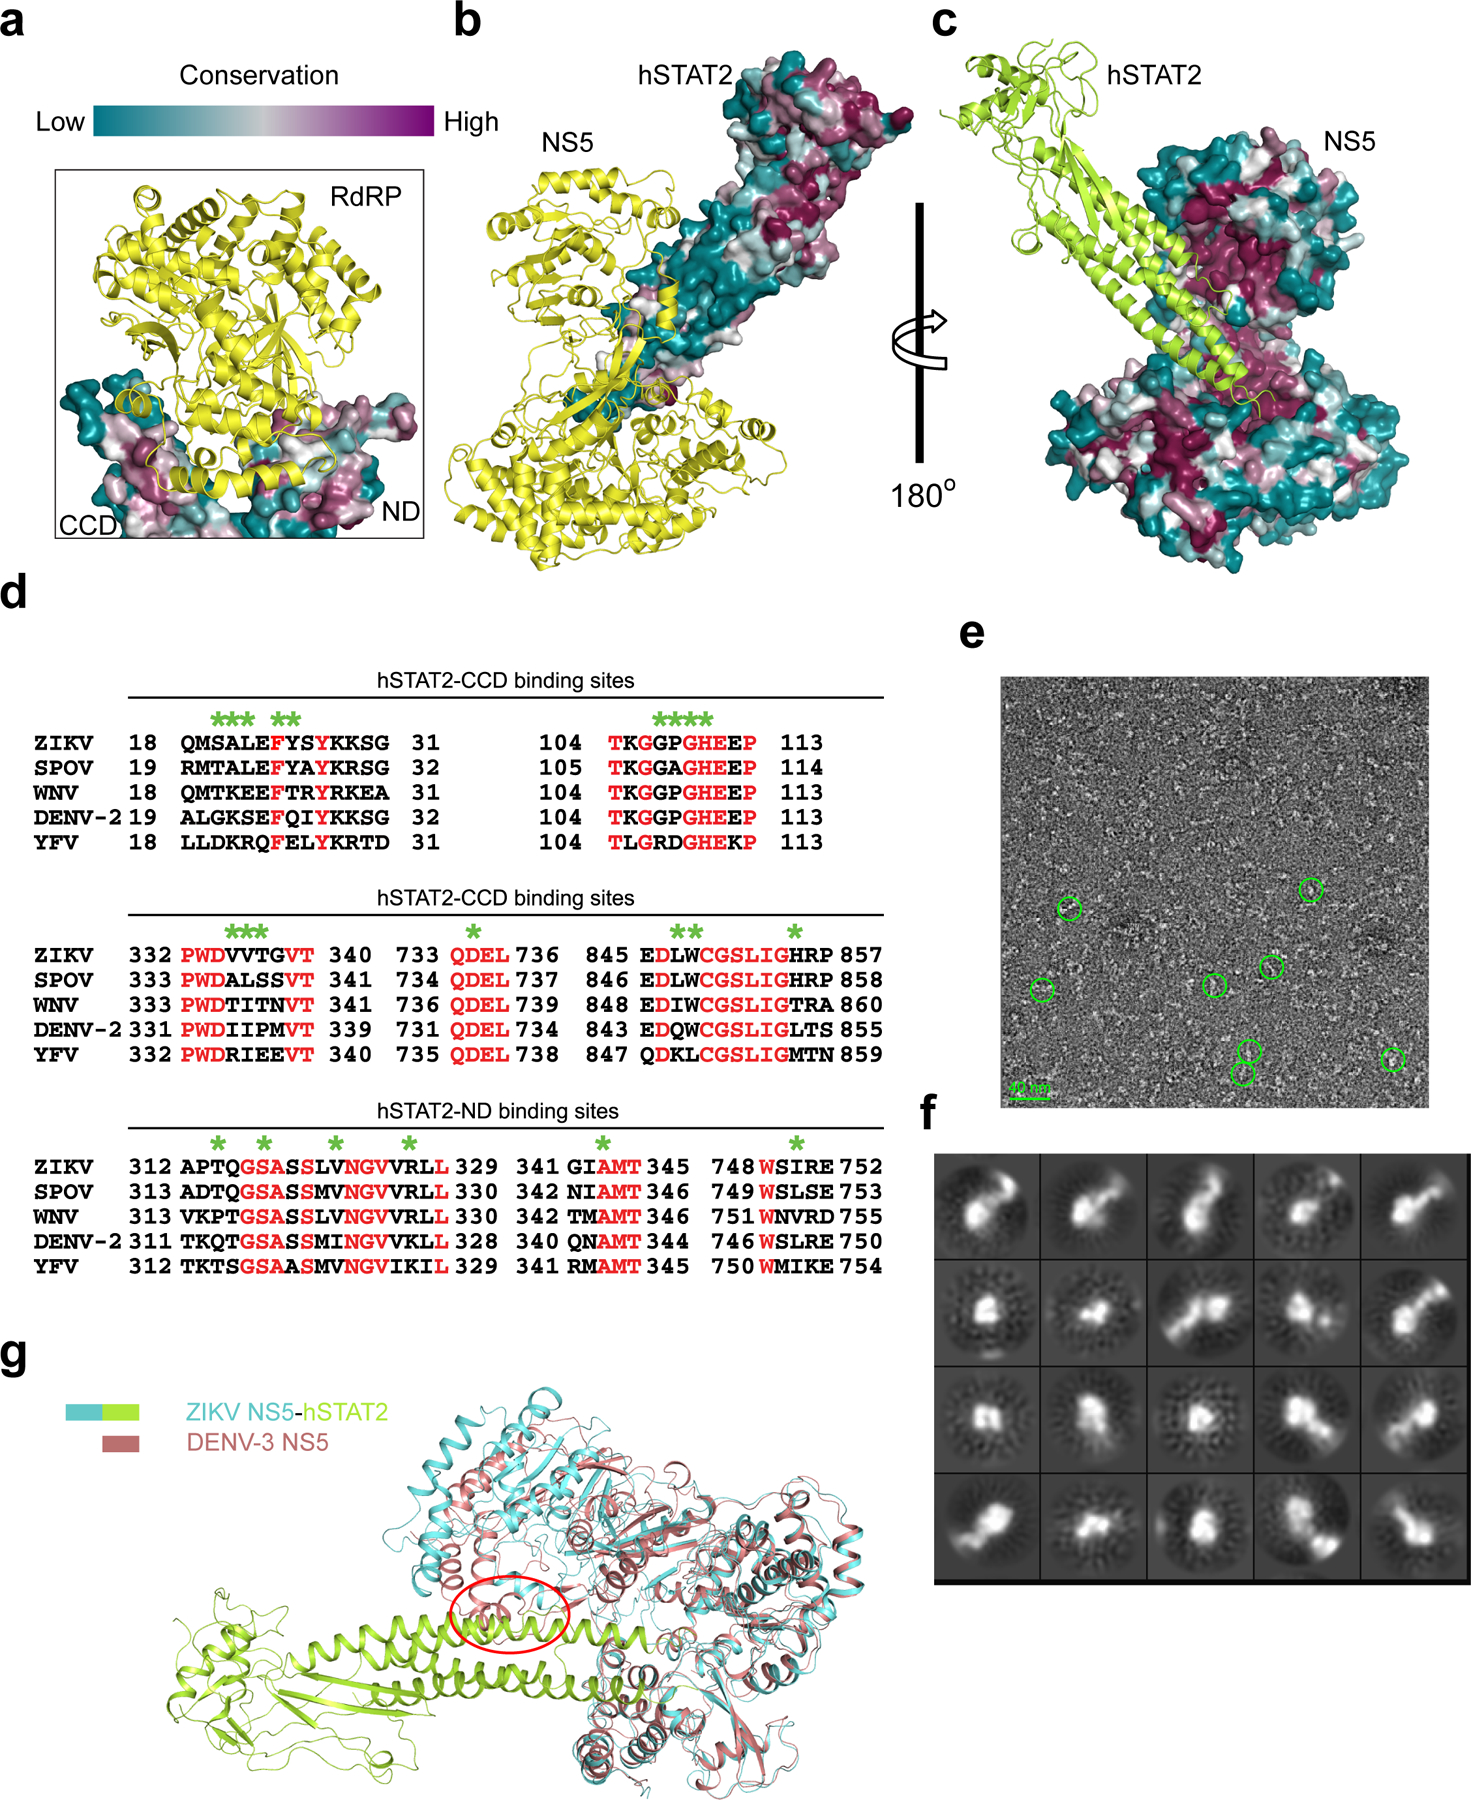
a-c, Sequence conservation analysis of the ZIKV NS5–hSTAT2 interaction using the ConSurf server (https://consurf.tau.ac.il/). The sequence conservation of hSTAT2 and ZIKV NS5 residues are colored coded and mapped onto the crystal structure of ZIKV RdRP–hSTAT2 (a) and cyro-EM structure of ZIKV NS5–hSTAT2 (b,c). d, Sequence alignment of the NS5 proteins from members of the Flaviviridae family, with the identical residues colored in red and the hSTAT2-binding sites of ZIKV NS5 marked by green asterisks. e, Representative negative-stain EM image of DENV NS5-hSTAT21–713. Bar: 40 nm. f, Characteristic 2D class averages with CTF correction. g, Structural overlay of DENV-3 NS5 and hSTAT2-bound ZIKV NS5. The potential steric clash between the “closed” conformation of DENV-3 NS5 (PDB 4V0Q) and hSTAT2 is marked by a red circle.
Extended Data Figure 10. Cellular analysis of the R327A (MutR) and G338E/D734A (MutGD) mutations of ZIKV NS5 on the hSTAT2 interaction and degradation.
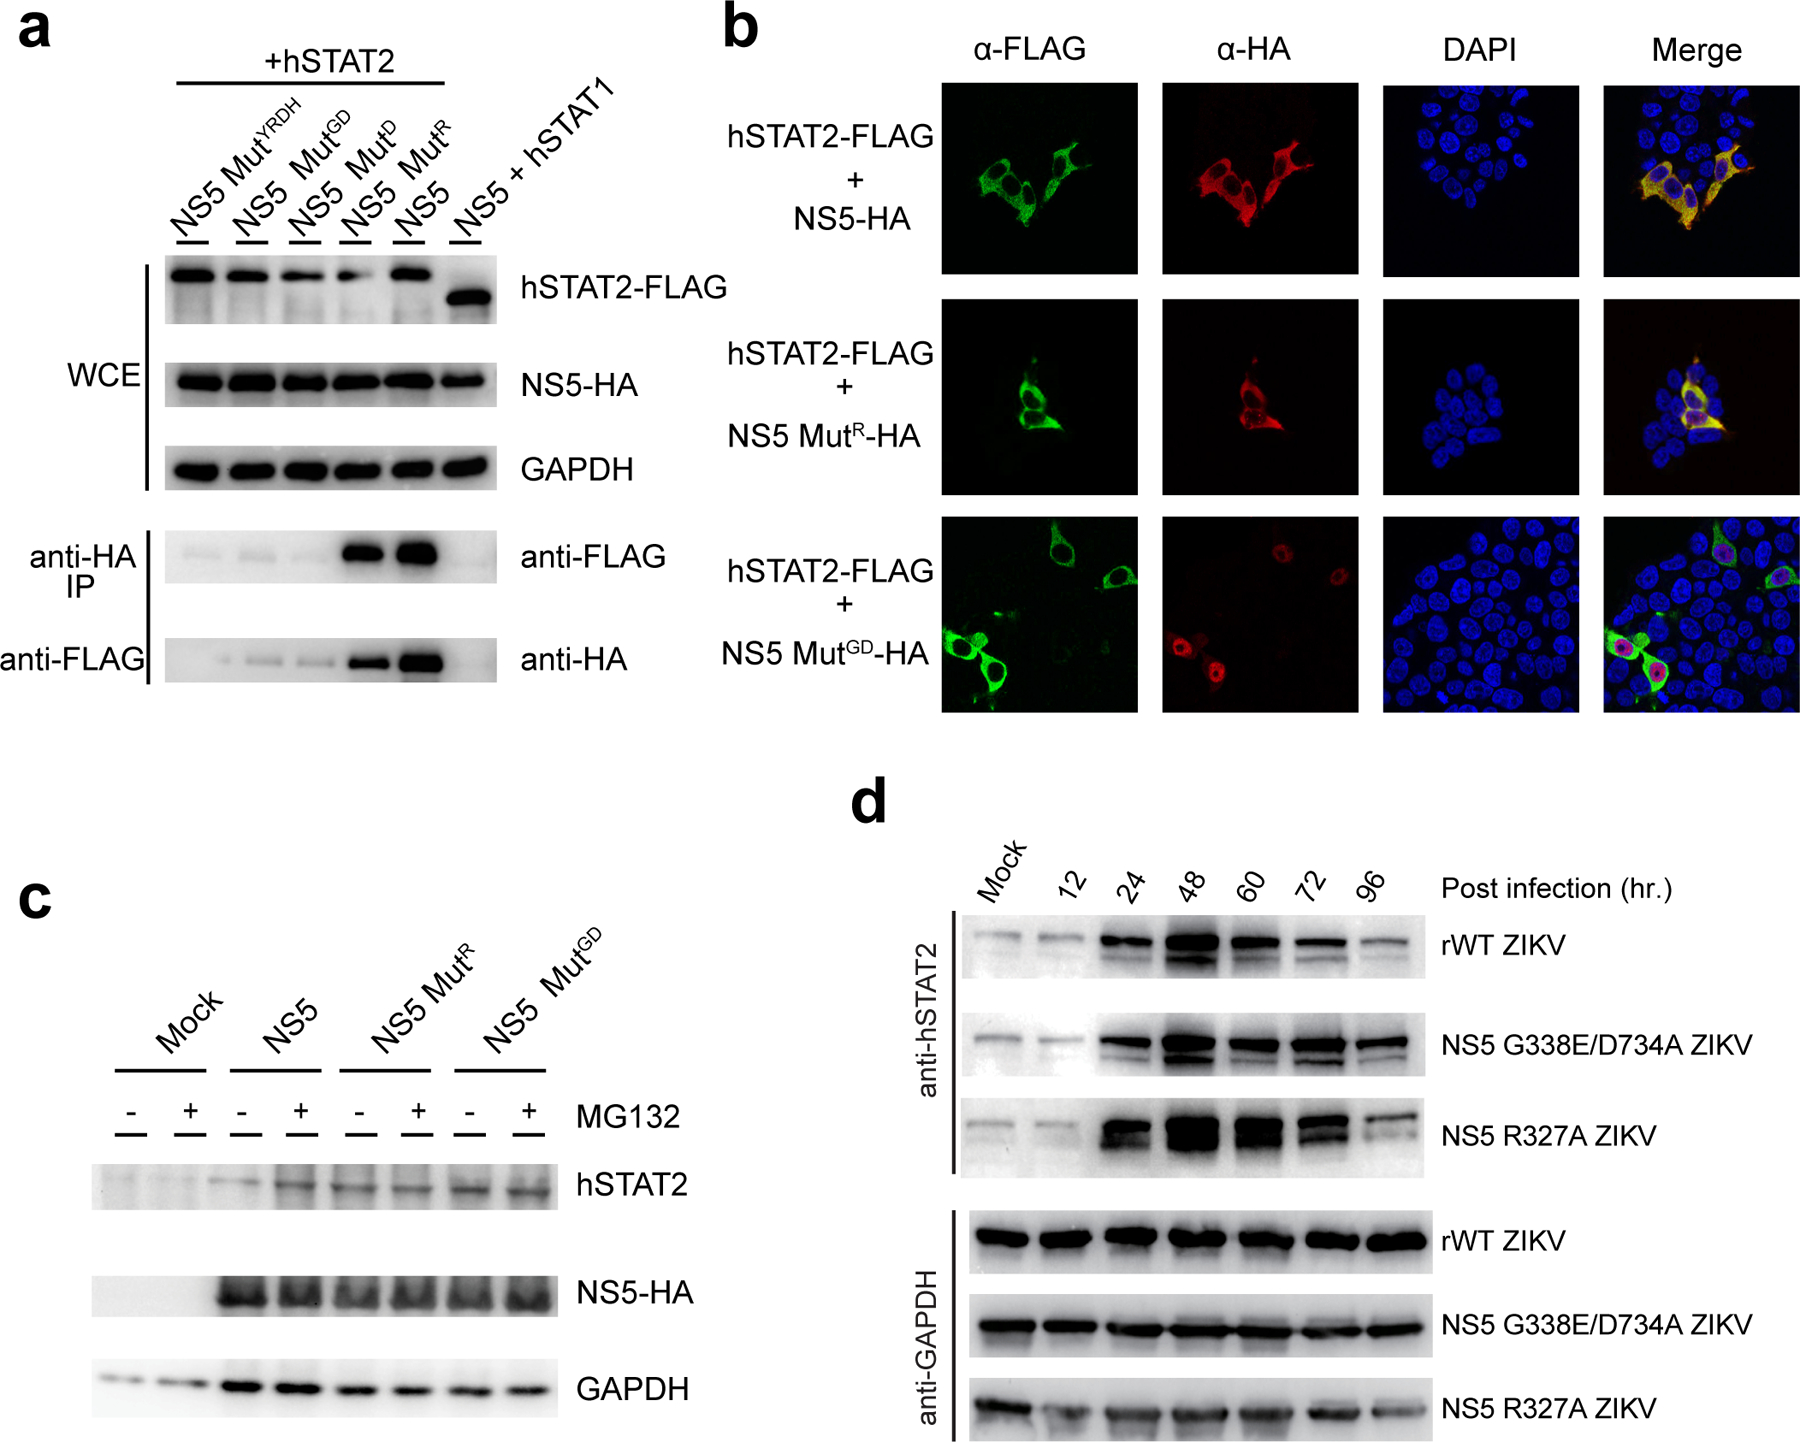
a, Co-IP analysis showing the effects of MutR and MutGD in comparison with D734A (MutD) and MutYRDH on the NS5–hSTAT2 interaction. Immunoblot analysis of the IP and whole cell extract (WCE) was performed using antibodies against HA, FLAG and GAPDH. b, IF analysis of 293T cells transfected with plasmids encoding NS5-HA, wild type or mutant, and hSTAT2-FLAG. The transfected cells were fixed for immune staining using antibodies against HA (red) and FLAG (green). Nuclei were visualized by DAPI (blue) counter staining. c, Immunoblot analysis of 293T cells transfected with indicated plasmids encoding wild-type or mutant NS5-HAs using antibodies against HA, hSTAT2, and GAPDH, incubated with or without proteasome inhibitor MG132. d, Western-blot analysis of virus-infected A549 cells using antibodies against hSTAT2 and GAPDH. Uncropped blots for a,c,d are shown in Supplementary Data 1.
Supplementary Material
Supplementary Video 1: Ribbon representation of the X-ray structure of ZIKV RdRP–hSTAT21–713 and zoom-in view of the interacting interface between RdRP and CCD.
Supplementary Video 2: Cryo-EM structure of ZIKV NS5–hSTAT21–713. The cryo-EM density map is shown as shaded surface colored according to the domain color scheme in Fig. 1a. The atomic model derived from the cryo-EM map is first superposed with the cryo-EM density map and subsequently alone as ribbon representation, followed by zoom-in views of the interacting interface between MTase and CCD.
Acknowledgments
This work was supported by a UC Cancer Research Coordinating Committee Faculty Seed Grant (CRR-20-634140) to J.S., and the NIH (1R35GM119721 to J.S, 1R21AI147057 to J.S. and R.H., R01GM071940 to Z.H.Z., R21 AI133649 to M.J.E. and R00GM111858 to S.E.O.). This work is also partly funded by the Trans fund of the State of California (AB2664) to J.S. and R.H, and by DHIPC (Dengue Human Immunology Project Consortium) and a NIAID funded program (U19AI118610) to A.G.-S. M.J.E. holds Investigator in Pathogenesis of Infectious Disease Awards from the Burroughs Wellcome Fund. K.Z. was partially supported by a fellowship from the China Scholarship Council. We acknowledge the assistance of D. Carter for microscopy imaging. Microscopy and/or image analysis was also performed at the Microscopy CoRE at the Icahn School of Medicine at Mount Sinai. We thank G. Tan for assisting with statistical analysis on the growth-curve data. We also acknowledge the use of instruments at the Electron Imaging Center for Nanomachines supported by UCLA and by instrumentation grants from NIH (1S10RR23057, 1S10OD018111 and U24GM116792) and NSF (DBI-1338135 and DMR-1548924). We would like to thank staff members at the Advanced Light Source, Lawrence Berkeley National Laboratory, for access to X-ray beamlines. The Advanced Light Source is supported by the director, office of science, office of basic energy sciences, of the US Department of Energy under contract no. DE-AC02-05CH11231. We thank S. Ding and D. Bogunovic for providing the DENV cDNA clone and VSV-GFP virus, respectively. We also thank Z. Hu for insightful discussions.
Footnotes
Competing Interest
The authors declare no competing interest.
References
- 1.Hoffmann HH, Schneider WM & Rice CM Interferons and viruses: an evolutionary arms race of molecular interactions. Trends in immunology 36, 124–138 (2015). [DOI] [PMC free article] [PubMed] [Google Scholar]
- 2.Sadler AJ & Williams BR Interferon-inducible antiviral effectors. Nature reviews. Immunology 8, 559–568 (2008). [DOI] [PMC free article] [PubMed] [Google Scholar]
- 3.Chowdhury FZ & Farrar JD STAT2: A shape-shifting anti-viral super STAT. Jak-Stat 2, e23633 (2013). [DOI] [PMC free article] [PubMed] [Google Scholar]
- 4.Lim CP & Cao X Structure, function, and regulation of STAT proteins. Molecular bioSystems 2, 536–550 (2006). [DOI] [PubMed] [Google Scholar]
- 5.Shuai K et al. Interferon activation of the transcription factor Stat91 involves dimerization through SH2-phosphotyrosyl peptide interactions. Cell 76, 821–828 (1994). [DOI] [PubMed] [Google Scholar]
- 6.Blaszczyk K et al. The unique role of STAT2 in constitutive and IFN-induced transcription and antiviral responses. Cytokine & growth factor reviews 29, 71–81 (2016). [DOI] [PubMed] [Google Scholar]
- 7.Fu XY, Kessler DS, Veals SA, Levy DE & Darnell JE Jr. ISGF3, the transcriptional activator induced by interferon alpha, consists of multiple interacting polypeptide chains. Proc Natl Acad Sci U S A 87, 8555–8559 (1990). [DOI] [PMC free article] [PubMed] [Google Scholar]
- 8.Platanitis E et al. A molecular switch from STAT2-IRF9 to ISGF3 underlies interferon-induced gene transcription. Nature communications 10, 2921 (2019). [DOI] [PMC free article] [PubMed] [Google Scholar]
- 9.Brierley MM & Fish EN Stats: multifaceted regulators of transcription. Journal of interferon & cytokine research : the official journal of the International Society for Interferon and Cytokine Research 25, 733–744 (2005). [DOI] [PubMed] [Google Scholar]
- 10.Rasmussen SA, Jamieson DJ, Honein MA & Petersen LR Zika Virus and Birth Defects--Reviewing the Evidence for Causality. N Engl J Med 374, 1981–1987 (2016). [DOI] [PubMed] [Google Scholar]
- 11.Cao-Lormeau VM et al. Guillain-Barre Syndrome outbreak associated with Zika virus infection in French Polynesia: a case-control study. Lancet 387, 1531–1539 (2016). [DOI] [PMC free article] [PubMed] [Google Scholar]
- 12.Gubler DJ Dengue and dengue hemorrhagic fever. Clinical microbiology reviews 11, 480–496 (1998). [DOI] [PMC free article] [PubMed] [Google Scholar]
- 13.Ashour J, Laurent-Rolle M, Shi PY & Garcia-Sastre A NS5 of dengue virus mediates STAT2 binding and degradation. J Virol 83, 5408–5418 (2009). [DOI] [PMC free article] [PubMed] [Google Scholar]
- 14.Grant A et al. Zika Virus Targets Human STAT2 to Inhibit Type I Interferon Signaling. Cell host & microbe 19, 882–890 (2016). [DOI] [PMC free article] [PubMed] [Google Scholar]
- 15.Morrison J et al. Dengue virus co-opts UBR4 to degrade STAT2 and antagonize type I interferon signaling. PLoS pathogens 9, e1003265 (2013). [DOI] [PMC free article] [PubMed] [Google Scholar]
- 16.Davidson AD Chapter 2. New insights into flavivirus nonstructural protein 5. Advances in virus research 74, 41–101 (2009). [DOI] [PubMed] [Google Scholar]
- 17.Chen X et al. Crystal structure of a tyrosine phosphorylated STAT-1 dimer bound to DNA. Cell 93, 827–839 (1998). [DOI] [PubMed] [Google Scholar]
- 18.Mao X et al. Structural bases of unphosphorylated STAT1 association and receptor binding. Mol Cell 17, 761–771 (2005). [DOI] [PubMed] [Google Scholar]
- 19.Becker S, Groner B & Muller CW Three-dimensional structure of the Stat3beta homodimer bound to DNA. Nature 394, 145–151 (1998). [DOI] [PubMed] [Google Scholar]
- 20.Li J et al. Structural basis for DNA recognition by STAT6. Proc Natl Acad Sci U S A 113, 13015–13020 (2016). [DOI] [PMC free article] [PubMed] [Google Scholar]
- 21.Neculai D et al. Structure of the unphosphorylated STAT5a dimer. J Biol Chem 280, 40782–40787 (2005). [DOI] [PubMed] [Google Scholar]
- 22.Duan W et al. The crystal structure of Zika virus NS5 reveals conserved drug targets. EMBO J 36, 919–933 (2017). [DOI] [PMC free article] [PubMed] [Google Scholar]
- 23.Godoy AS et al. Crystal structure of Zika virus NS5 RNA-dependent RNA polymerase. Nature communications 8, 14764 (2017). [DOI] [PMC free article] [PubMed] [Google Scholar]
- 24.Wang B et al. The structure of Zika virus NS5 reveals a conserved domain conformation. Nature communications 8, 14763 (2017). [DOI] [PMC free article] [PubMed] [Google Scholar]
- 25.Zhao B et al. Structure and function of the Zika virus full-length NS5 protein. Nature communications 8, 14762 (2017). [DOI] [PMC free article] [PubMed] [Google Scholar]
- 26.Shuai K, Stark GR, Kerr IM & Darnell JE Jr. A single phosphotyrosine residue of Stat91 required for gene activation by interferon-gamma. Science 261, 1744–1746 (1993). [DOI] [PubMed] [Google Scholar]
- 27.Improta T et al. Transcription factor ISGF-3 formation requires phosphorylated Stat91 protein, but Stat113 protein is phosphorylated independently of Stat91 protein. Proc Natl Acad Sci U S A 91, 4776–4780 (1994). [DOI] [PMC free article] [PubMed] [Google Scholar]
- 28.Uchil PD, Kumar AV & Satchidanandam V Nuclear localization of flavivirus RNA synthesis in infected cells. J Virol 80, 5451–5464 (2006). [DOI] [PMC free article] [PubMed] [Google Scholar]
- 29.Martinez-Moczygemba M, Gutch MJ, French DL & Reich NC Distinct STAT structure promotes interaction of STAT2 with the p48 subunit of the interferon-alpha-stimulated transcription factor ISGF3. J Biol Chem 272, 20070–20076 (1997). [DOI] [PubMed] [Google Scholar]
- 30.Rengachari S et al. Structural basis of STAT2 recognition by IRF9 reveals molecular insights into ISGF3 function. Proc Natl Acad Sci U S A 115, E601–E609 (2018). [DOI] [PMC free article] [PubMed] [Google Scholar]
- 31.El Sahili A et al. NS5 from Dengue Virus Serotype 2 Can Adopt a Conformation Analogous to That of Its Zika Virus and Japanese Encephalitis Virus Homologues. J Virol 94 (2019). [DOI] [PMC free article] [PubMed] [Google Scholar]
- 32.Zhao Y et al. A crystal structure of the Dengue virus NS5 protein reveals a novel inter-domain interface essential for protein flexibility and virus replication. PLoS pathogens 11, e1004682 (2015). [DOI] [PMC free article] [PubMed] [Google Scholar]
- 33.Bussetta C & Choi KH Dengue virus nonstructural protein 5 adopts multiple conformations in solution. Biochemistry 51, 5921–5931 (2012). [DOI] [PMC free article] [PubMed] [Google Scholar]
- 34.Chaudhary V et al. Selective Activation of Type II Interferon Signaling by Zika Virus NS5 Protein. J Virol 91 (2017). [DOI] [PMC free article] [PubMed] [Google Scholar]
- 35.Kumar A et al. Zika virus inhibits type-I interferon production and downstream signaling. EMBO reports 17, 1766–1775 (2016). [DOI] [PMC free article] [PubMed] [Google Scholar]
- 36.Speer SD et al. ISG15 deficiency and increased viral resistance in humans but not mice. Nature communications 7, 11496 (2016). [DOI] [PMC free article] [PubMed] [Google Scholar]
- 37.Xia H et al. An evolutionary NS1 mutation enhances Zika virus evasion of host interferon induction. Nature communications 9, 414 (2018). [DOI] [PMC free article] [PubMed] [Google Scholar]
- 38.Hertzog J et al. Infection with a Brazilian isolate of Zika virus generates RIG-I stimulatory RNA and the viral NS5 protein blocks type I IFN induction and signaling. European journal of immunology 48, 1120–1136 (2018). [DOI] [PMC free article] [PubMed] [Google Scholar]
- 39.Schwarz MC et al. Rescue of the 1947 Zika Virus Prototype Strain with a Cytomegalovirus Promoter-Driven cDNA Clone. mSphere 1 (2016). [DOI] [PMC free article] [PubMed] [Google Scholar]
- 40.Emeny JM & Morgan MJ Regulation of the interferon system: evidence that Vero cells have a genetic defect in interferon production. J Gen Virol 43, 247–252 (1979). [DOI] [PubMed] [Google Scholar]
- 41.Best SM et al. Inhibition of interferon-stimulated JAK-STAT signaling by a tick-borne flavivirus and identification of NS5 as an interferon antagonist. J Virol 79, 12828–12839 (2005). [DOI] [PMC free article] [PubMed] [Google Scholar]
- 42.Laurent-Rolle M et al. The NS5 protein of the virulent West Nile virus NY99 strain is a potent antagonist of type I interferon-mediated JAK-STAT signaling. J Virol 84, 3503–3515 (2010). [DOI] [PMC free article] [PubMed] [Google Scholar]
- 43.Laurent-Rolle M et al. The interferon signaling antagonist function of yellow fever virus NS5 protein is activated by type I interferon. Cell host & microbe 16, 314–327 (2014). [DOI] [PMC free article] [PubMed] [Google Scholar]
- 44.Lin RJ, Chang BL, Yu HP, Liao CL & Lin YL Blocking of interferon-induced Jak-Stat signaling by Japanese encephalitis virus NS5 through a protein tyrosine phosphatase-mediated mechanism. J Virol 80, 5908–5918 (2006). [DOI] [PMC free article] [PubMed] [Google Scholar]
- 45.Lubick KJ et al. Flavivirus Antagonism of Type I Interferon Signaling Reveals Prolidase as a Regulator of IFNAR1 Surface Expression. Cell host & microbe 18, 61–74 (2015). [DOI] [PMC free article] [PubMed] [Google Scholar]
- 46.Mazzon M, Jones M, Davidson A, Chain B & Jacobs M Dengue virus NS5 inhibits interferon-alpha signaling by blocking signal transducer and activator of transcription 2 phosphorylation. The Journal of infectious diseases 200, 1261–1270 (2009). [DOI] [PubMed] [Google Scholar]
- 47.Lu G & Gong P Crystal Structure of the full-length Japanese encephalitis virus NS5 reveals a conserved methyltransferase-polymerase interface. PLoS pathogens 9, e1003549 (2013). [DOI] [PMC free article] [PubMed] [Google Scholar]
- 48.Upadhyay AK et al. Crystal structure of full-length Zika virus NS5 protein reveals a conformation similar to Japanese encephalitis virus NS5. Acta crystallographica. Section F, Structural biology communications 73, 116–122 (2017). [DOI] [PMC free article] [PubMed] [Google Scholar]
- 49.Wang B, Thurmond S, Hai R & Song J Structure and function of Zika virus NS5 protein: perspectives for drug design. Cell Mol Life Sci (2018). [DOI] [PMC free article] [PubMed] [Google Scholar]
- 50.Tay MY et al. The C-terminal 18 Amino Acid Region of Dengue Virus NS5 Regulates its Subcellular Localization and Contains a Conserved Arginine Residue Essential for Infectious Virus Production. PLoS pathogens 12, e1005886 (2016). [DOI] [PMC free article] [PubMed] [Google Scholar]
- 51.Ng IHW et al. Zika Virus NS5 Forms Supramolecular Nuclear Bodies That Sequester Importin-alpha and Modulate the Host Immune and Pro-Inflammatory Response in Neuronal Cells. ACS infectious diseases 5, 932–948 (2019). [DOI] [PubMed] [Google Scholar]
- 52.Otwinowski Z & Minor W Processing of X-ray diffraction data collected in oscillation mode. Method Enzymol 276, 307–326 (1997). [DOI] [PubMed] [Google Scholar]
- 53.McCoy AJ et al. Phaser crystallographic software. J Appl Crystallogr 40, 658–674 (2007). [DOI] [PMC free article] [PubMed] [Google Scholar]
- 54.Emsley P & Cowtan K Coot: model-building tools for molecular graphics. Acta Crystallogr D Biol Crystallogr 60, 2126–2132 (2004). [DOI] [PubMed] [Google Scholar]
- 55.Adams PD et al. PHENIX: building new software for automated crystallographic structure determination. Acta Crystallogr D Biol Crystallogr 58, 1948–1954 (2002). [DOI] [PubMed] [Google Scholar]
- 56.Suloway C et al. Automated molecular microscopy: the new Leginon system. Journal of structural biology 151, 41–60 (2005). [DOI] [PubMed] [Google Scholar]
- 57.Zheng SQ et al. MotionCor2: anisotropic correction of beam-induced motion for improved cryo-electron microscopy. Nature methods 14, 331–332 (2017). [DOI] [PMC free article] [PubMed] [Google Scholar]
- 58.Zhang K Gctf: Real-time CTF determination and correction. Journal of structural biology 193, 1–12 (2016). [DOI] [PMC free article] [PubMed] [Google Scholar]
- 59.Scheres SH RELION: implementation of a Bayesian approach to cryo-EM structure determination. Journal of structural biology 180, 519–530 (2012). [DOI] [PMC free article] [PubMed] [Google Scholar]
- 60.Scheres SH A Bayesian view on cryo-EM structure determination. J Mol Biol 415, 406–418 (2012). [DOI] [PMC free article] [PubMed] [Google Scholar]
- 61.Punjani A, Rubinstein JL, Fleet DJ & Brubaker MA cryoSPARC: algorithms for rapid unsupervised cryo-EM structure determination. Nature methods 14, 290–296 (2017). [DOI] [PubMed] [Google Scholar]
- 62.Vilas JL et al. MonoRes: Automatic and Accurate Estimation of Local Resolution for Electron Microscopy Maps. Structure 26, 337–344 e334 (2018). [DOI] [PubMed] [Google Scholar]
- 63.Pettersen EF et al. UCSF Chimera--a visualization system for exploratory research and analysis. Journal of computational chemistry 25, 1605–1612 (2004). [DOI] [PubMed] [Google Scholar]
Associated Data
This section collects any data citations, data availability statements, or supplementary materials included in this article.
Supplementary Materials
Supplementary Video 1: Ribbon representation of the X-ray structure of ZIKV RdRP–hSTAT21–713 and zoom-in view of the interacting interface between RdRP and CCD.
Supplementary Video 2: Cryo-EM structure of ZIKV NS5–hSTAT21–713. The cryo-EM density map is shown as shaded surface colored according to the domain color scheme in Fig. 1a. The atomic model derived from the cryo-EM map is first superposed with the cryo-EM density map and subsequently alone as ribbon representation, followed by zoom-in views of the interacting interface between MTase and CCD.
Data Availability Statement
Coordinates and structure factors for the ZIKV RdRP – hSTAT21–713 complexes have been deposited in the wwProtein Data Bank with accession code PDB 6UX2. Cryo-EM density map and atomic coordinates of the NS5–hSTAT2 complex have been deposited to the EMDB and PDB under the accession numbers of EMD-21618 and PDB 6WCZ, respectively. Uncropped images and data behind graphs are available in Supplementary Data 1 and 2, respectively.


