

Abstract
Phosphatase non-receptor type 12 (PTPN12 or PTP-PEST) is a critical regulator of cell migration, acting as a tumor suppressor in cancer. Decreases in PTP-PEST expression correlate with aggressive phenotypes in hepatocellular carcinoma (HCC). Despite the importance of PTP-PEST in cellular signaling, methods to directly monitor its enzymatic activity are lacking. Herein, we report the design, synthesis, and optimization of a probe to directly monitor PTP-PEST enzymatic activity via a fluorescent readout. This activity sensor, termed pPEST1tide, is capable of detecting as little as 0.2 nM recombinant PTP-PEST. In addition, we demonstrate that this probe can selectively report on PTP-PEST activity using a panel of potential off-target enzymes. In the long-term, this activity probe could be utilized to identify small molecule modulators of PTP-PEST activity as well as provide a prognostic readout for HCC.
Graphical Abstract
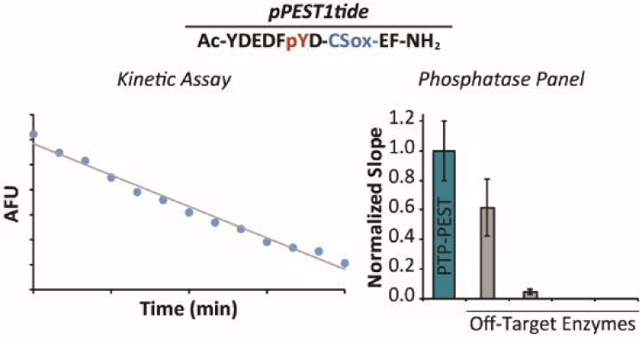
Design and optimization of a direct activity assay for PTP-PEST.
Introduction
Increasing evidence has demonstrated the critical role of protein tyrosine phosphatase (PTP) catalytic activity in human diseases such as cancer.1 For example, the ubiquitously expressed cytosolic PTP known as PTP-PEST inhibits the activity of oncogenic tyrosine kinases such as HER2 and EGFR2 and regulates cell migration through several downstream targets, such as p130CAS3,4 and FAK.5–7 PTP-PEST has been identified as a tumor suppressor in numerous cancers including breast,2,8 colon,9 and ovarian.10 Interestingly, decreased PTP-PEST expression has been associated with decreased survival in hepatocellular carcinoma (HCC).11,12 Thus, changes in PTP-PEST activity may represent a potential prognostic marker for aggressive HCC.
Despite the importance of phosphatases in cellular signaling,13 there are limited examples of methodologies for monitoring their activities.14–16 This has resulted in the use of indirect proxies such as expression levels to infer changes in enzymatic activity. Chemistry focused efforts have begun to address this issue.17–25 Our laboratory has introduced a method for directly monitoring protein phosphatase activity26–28 that relies on repurposing the phosphorylation-sensitive Sox fluorophore, developed by the Imperiali laboratory.29,30 The Sox fluorophore produces an increase in fluorescence in response to phosphorylation of an adjacent amino acid residue via chelation-enhanced fluorescence, enabling the construction of peptide-based kinase activity sensors to monitor changes in protein kinase activity in unfractionated cell lysates and tissue homogenates.31–39 Importantly, engineered cysteine residues within peptide sequences can be modified with Sox in order to afford CSox-based probes which differ from native peptide substrates by only one amino acid.32 These probes can be synthesized using published methods31 and are also readily available commercially (AssayQuant Technologies Inc., http://www.assayquant.com/),40 making Sox an attractive platform for the development of activity sensors. In repurposing this approach, dephosphorylation of a CSox-containing peptide by a target PTP results in a decrease in the fluorescence of the probe over time which is directly proportional to the activity of the target phosphatase. This approach has been utilized to construct probes for PTP as well as serine/threonine phosphatase enzymatic activities.26,27 In cases were highly selective substrates or appropriate off-target inhibitors are available, phosphatase activity can be monitored in heterogeneous mixtures such as cell lysates.27 Given our lab’s interest in profiling signaling changes associated with fatty liver disease progression to HCC,26,38,39,41,42 we set out to develop a CSox-based activity probe for PTP-PEST and optimization of conditions for monitoring enzymatic activity. In the long-term, this probe could provide insights into signaling changes associated with the development and progression of HCC.
Experimental
Instrumentation and Buffer Solutions.
HPLC purification of peptide probes was performed using a Waters 1525 Binary HPLC Pump with a 2489 UV/Visible detector. Semipreparative purification was done with a YMC-Pack ODS-A column, 5 μm, 250 × 20 mm. Mass spectra were acquired on a Finnigan LCQ with a Pauli ion trap. Absorbance measurements were performed on a BIOMATE 3S (Thermo Scientific) with a 1 cm quartz cuvette. Fluorescence spectra were acquired using a SynergyH1 hybrid reader (Bio-Tek) with Corning (3824) 384-well plates (white, low volume). Fluorescence was monitored by excitation at 360 nm and monitoring emission at 500 nm.
The following buffers were used for activity assays and dilution of recombinant enzymes: 1) Recombinant Enzyme Assay Buffer: 50 mM Tris-HCl (pH = 7.5 at 22 °C), 1 mM DTT, 2 mM EGTA, 0.01% Brij-35P and 2) Recombinant Enzyme Dilution Buffer: 50 mM Tris-HCl (pH = 7.5 at 22 °C), 2 mM EGTA, 1 mM DTT, 0.01% (v/v) Brij-35P, 0.1% (v/v) glycerol.
Synthesis of Peptide-Based Probes.
Peptides were synthesized using standard Fmoc-based solid-phase peptide synthesis and amino acid protection chemistry.28 The pPEST1tide and PEST1tide sequences were synthesized on Fmoc-Amide resin (Applied Biosystems, 0.66 mmol/g). The resin was first swelled in DCM (30 min) followed by N-methyl-2-pyrrolidine (NMP) for 30 min prior to synthesis. All amino acids except for Fmoc-Cys-(Sox)-OH were coupled according to the following procedure: Fmoc deprotection (20% 4-methylpiperidine in NMP, 3 × 5 min), rinsing step (5 × NMP), coupling step (amino acid/COMU/Oxyma/TMP, 6:6:6:6 equivalents based on resin loading capacity in NMP at a final concentration of 0.15 M amino acid, 45–60 min), rinsing step (5 × NMP, 5 × DCM). Fmoc-Cys-(Sox)-OH was synthesized in house as previously described43 and coupled in the following manner: amino acid/PyAOP/HOAt/collidine, 2:2:2:5 eqs based on resin loading capacity in DMF at a final concentration of 0.15 M amino acid, 2–12 hr. The coupling was repeated if necessary (amino acid/PyAOP/HOAt/collidine, 1:1:1:3 eqs based on resin loading capacity in DMF at a final concentration of 0.15 M amino acid, 2–12 hr) as determined by the chloranil or ninhydrin test for free amines. At the end of the synthesis, the Fmoc group was removed with 20% 4-methylpiperidine in DMF (3 × 5 min) and the resin rinsed with NMP (x 5). The resin-attached free amines were capped by exposure to Ac2O (20 equiv.) and pyridine (20 equiv.) in NMP for 30 min. The resin was rinsed with NMP (x 5), DCM (x 5), and MeOH (x 5), and the resin was dried under vacuum.
Cleavage and protecting group removal were achieved by exposing the resin-bound peptides to a cocktail of TFA/phenol/water/thioanisol/1,2-ethanedithiol/triisopropylsilane (80:5:5:5:2.5:2.5% v/v). The resulting solution was concentrated under a stream of N2 and precipitated by addition of cold Et2O. The pellet was triturated with cold Et2O (x 3), redissolved in nanopure water, and filtered through a 0.2 μm filter.
Purification of Peptide-Based Probes.
Peptides were purified by semi-preparative reverse-phase HPLC using a linear gradient of 5–95% acetonitrile (0.1% TFA) in nanopure water (0.1% TFA) for 30 min and monitoring absorption at 228 nm and 316 nms. Identities were confirmed by ESI-MS and stock solutions of peptides were prepared in nanopure water. The concentration of peptide stocks were determined using the molar extinction coefficient of Sox (ε = 8,247 M−1 cm−1 in 0.1 M NaOH with 1 mM Na2EDTA at 355 nm).30 An average of values from three separate trails was used to determine the concentration. Purity of synthesized probes was confirmed by analytical HPLC (Figure S1).
Mg2+ KD Determination of PTP-PEST Peptides.
Each peptide (1 μM) was assayed in the presence of Tris-HCl (50 mM, pH = 7.5 at 22 °C), NaCl (150 mM), and increasing concentrations of MgCl2. Samples were incubated for 30 minutes and fluorescence (λex = 360 nm, λem = 400 − 650 nm) was monitored in triplicate and averaged. The maximum emission (λem = 500 nm) versus MgCl2 concentration was fit in KaleidaGraph using a single-site binding isotherm.
Fold Fluorescence Increase Determination.
The Mg2+ concentration was varied based on multiples (0.5, 1.0, 1.5, and 2.0x) of the observed Mg2+ KD of the phosphorylated peptide and assayed in Tris buffer (50 mM Tris-HCl, pH = 7.5 at 22 °C, 150 mM NaCl). The fluorescence (λex = 360 nm, λem = 400 − 650 nm) was monitored in triplicate and averaged. The fold fluorescence increase is defined as the fluorescence of the substrate peptide (pPEST1tide) divided by the fluorescence of the corresponding non-phosphorylated peptide (PEST1tide) at the maximum emission wavelength (λem = 500 nm).
Determination of Kinetic Parameters with Recombinant PTP-PEST.
Wells containing varying concentrations of substrate peptide (1–50 μM) in Recombinant Enzyme Assay Buffer with the optimal Mg2+ concentration (as determined above) were prepared. Reaction velocities were determined by monitoring substrate depletion, correcting for the fluorescence of the dephosphorylated product peptide.14 Briefly, additional wells containing the non-phosphorylated peptide at varying concentrations were prepared under identical conditions as above. The average fluorescence of wells containing varying concentrations of phosphorylated or non-phosphorylated peptide without enzyme was determined. By plotting the average fluorescence as a function of peptide concentration, a linear equation can be generated for both the phosphorylated substrate and the non-phosphorylated product peptide. The difference between the slopes of these two lines (slope of the phosphorylated substrate minus the slope of the non-phosphorylated product) yields a correction factor that can be used to calculate the concentration of the phosphorylated peptide remaining in solution at a given time after addition of enzyme. The change in fluorescence over time for wells containing phosphorylated substrate peptide was obtained after addition of 2.5 nM full-length, recombinant PTP-PEST (Lifespan BioSciences, LSG30042). The resulting reaction slopes were divided by the correction factor obtained above, yielding the rate of substrate depletion (μM/min). Rates of substrate depletion were converted to rates of product formation and fit in KaleidaGraph using the following equation:
Where d[P]/dt is change in product concentration versus time, d[S]/dt is the change in substrate concentration versus time, Vmax is the maximal velocity of the reaction, KM is the Michaelis-Menten constant, and [S] is the concentration of substrate.
Limit of Detection Determination with Recombinant PTP-PEST.
Recombinant PTP-PEST (Lifespan BioSciences, LS-G30042) was assayed at 10, 5, 2.5, 1.0, and 0.0 (blank) nM with 10 μM pPEST1tide and 6 mM MgCl2 in Recombinant Enzyme Assay Buffer. The resulting fluorescence data was fit to a linear trend line. The limit of detection was determined by using the following equation:
Protein Tyrosine Phosphatase Panel Assays.
Full-length PTP-PEST (Lifespan BioSciences, LS-G30042), full-length PTP1B (BPS Biosciences, 30009), TCPTP catalytic domain (Life Technologies, 10570H20B5), full-length SHP-1 (SignalChem, P33–20G-05), and SHP-2 catalytic domain (SignalChem, P38–21G05) were assayed in Recombinant Enzyme Assay Buffer at 2.5 nM each with 10 μM pPEST1tide and 6 mM MgCl2. Readings were background subtracted using wells containing no enzyme.
DiFMUP Assays with MSI-1436.
Full-length recombinant PTP1B (2.5 nM) or PTP-PEST (2.5 nM) were assayed in Recombinant Enzyme Assay Buffer with 100 μM DiFMUP (Molecular Probes, D6567) and 10 μM MSI-1436 (MedChemExpress, HY-12219) where indicated.
Results and Discussion
Design and Synthesis of a PTP-PEST Probe.
In order to develop a CSox-based probe for PTP-PEST activity, we first sought an efficient, selective substrate sequence for PTP-PEST. Accordingly, we turned to the work of Pei and coworkers, who performed a large scale analysis of the sequence specificity of 14 PTPs by screening catalytic domains against peptide libraries.44 This study demonstrated the preference of PTP-PEST for acidic residues flanking the site of dephosphorylation, yielding a peptide (YDEDFpYDYEF) which displayed a ≥4-fold increase in catalytic efficiency for PTP-PEST relative to other PTPs in the panel. Due to the preference of PTP-PEST for an acidic residue at the −2 position relative to pTyr, we chose to incorporate CSox at the +2 position in place of a Tyr residue. We termed the resulting substrate pPEST1tide (YDEDFpYD-CSox-EF, Figure 1). This peptide along with the corresponding non-phosphorylated analog PEST1tide (YDEDFYD-CSox-EF) that serves positive control for dephosphorylation, were synthesized using published methods (see Materials and Methods).28 Both the substrate and control peptides were capped on the N-termini with an acetyl group and the C-termini with an amide. Each peptide was purified by reverse-phase HPLC (Figure S1) and identities were confirmed by ESI-MS (Table S1).
Figure 1.
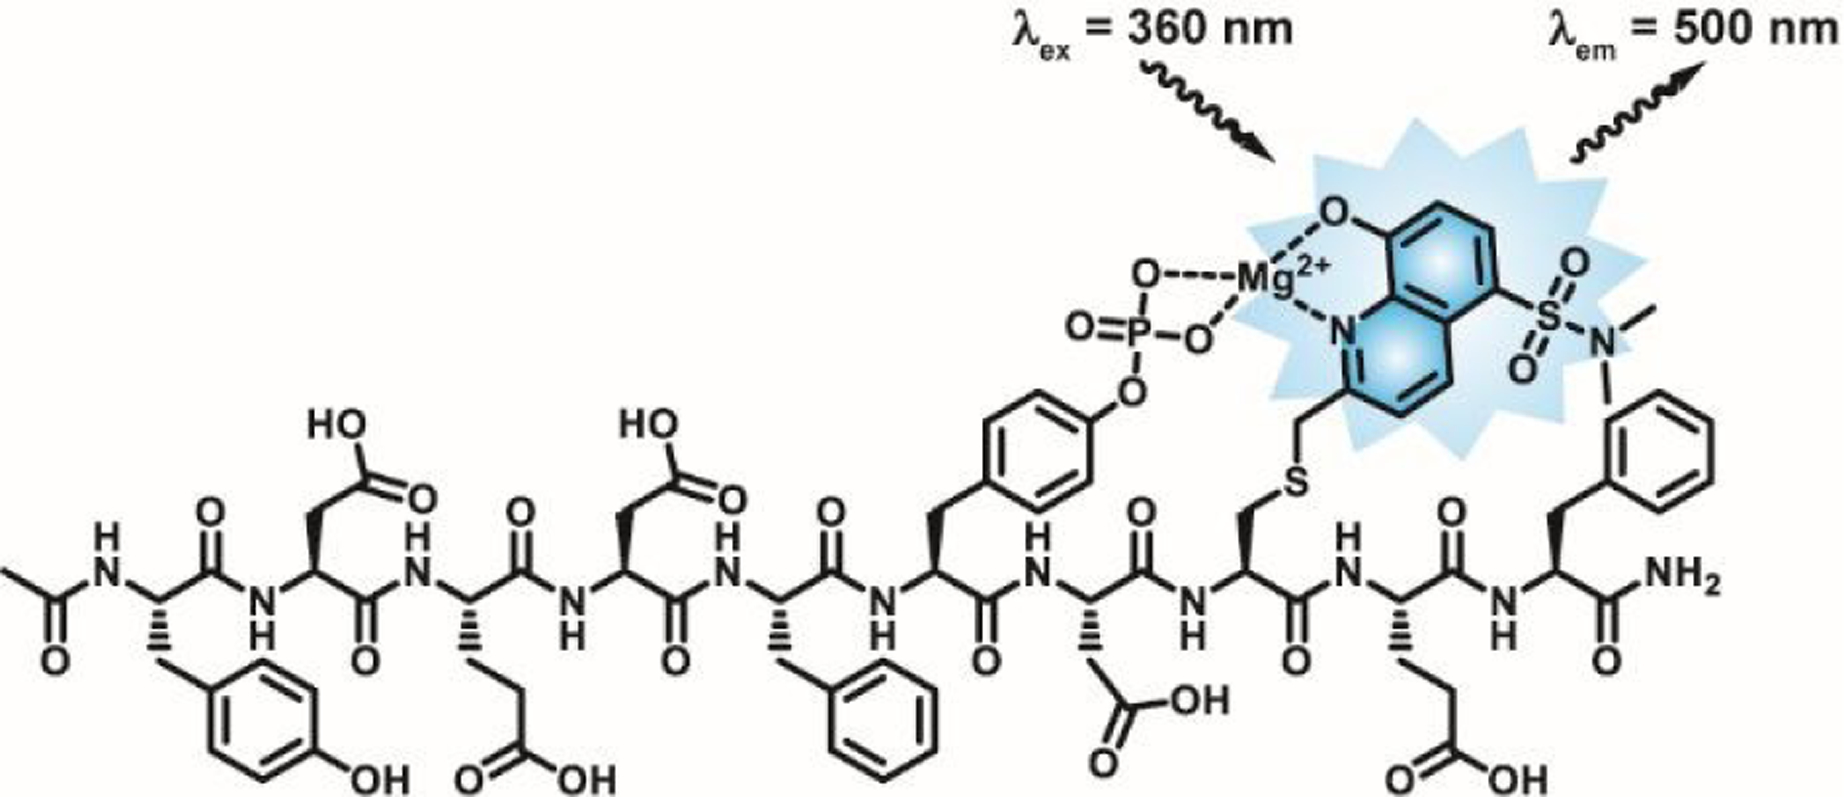
Structure of pPEST1tide. The CSox residue in pPEST1tide coordinates Mg2+ in concert with the adjacent pY residue. Removal of the phosphoryl group leads to a decrease in CSox fluorescence that is proportional to PTP activity.
Analysis of Magnesium Binding.
With this potential probe in-hand, we measured the dissociation constants (KD) for Mg2+ for both the phosphorylated and non-phosphorylated peptides. During the course of these experiments, we observed an emission maxima of 500 nm for pPEST1tide saturated with Mg2+, corresponding to a 15 nm red-shift compared to previously reported Sox-based probes (Figure S2).29,30,32,43 The same phenomenon was observed in the emission of PEST1tide at saturating concentrations of Mg2+ (Figure S3). Although the origin of this red-shift in fluorescence emission is unknown, we proceeded with further characterization of pPEST1tide by exciting at 360 nm and monitoring emission at 500 nm. The Mg2+ titration experiments demonstrated a 2.6-fold decrease in the affinity of PEST1tide for Mg2+ compared to pPEST1tide (Figure S4). Next, we determined the optimal concentration of Mg2+ for discrimination between the product and substrate by measuring the fold fluorescence increase of pPEST1tide relative to PEST1tide in the presence of varying concentrations of Mg2+. This analysis yielded a maximal increase in fluorescence of 4.4-fold for pPEST1tide compared to PEST1tide when using 6 mM Mg2+ (Figure S5, Table S2). Thus 6 mM Mg2+ was used in all subsequent experiments.
The Ability of pPEST1tide to Monitor PTP-PEST Activity.
Having determined optimized assay conditions, we next focused on the ability of pPEST1tide to detect PTP-PEST catalytic activity. We observed a clear decrease in fluorescence of pPEST1tide over time in the presence of full-length recombinant PTP-PEST (Figure 2A). This decrease in pPEST1tide fluorescence was reproducible and dependent upon the presence of PTP-PEST (Figure 2B). Encouraged by these results, we determined the kinetic parameters of pPEST1tide for PTP-PEST, yielding a kcat/KM =1.1 × 10⁵ M−1 s−1 (Figure 3). In comparison to the parent peptide (kcat/KM = 220 × 106 M−1 s−1), the CSox-containing probe was 2,000-fold less efficient,44 reinforcing the sensitivity of PTP-PEST to substitutions near the site of dephosphorylation. Nonetheless, these results clearly demonstrate the ability of pPEST1tide to directly report on PTP-PEST catalytic activity. Reactions conducted in the presence of decreasing concentrations of PTP-PEST yielded a limit of detection of 0.2 nM with pPEST1tide (Figure 4). This level of sensitivity is comparable with previous CSox-based probes for protein phosphatases,26,27 enabling potential monitoring of PTP-PEST activity in unfractionated lysates.
Figure 2.

pPEST1tide is capable of reporting on PTP-PEST enzymatic activity. (A) A clear decrease in the fluorescence of pPEST1tide (10 μM) is observed over time in the presence of full-length recombinant PTP-PEST (2.5 nM). (B) Normalized, absolute reaction slopes for pPEST1tide (10 μM) incubated in the presence or absence of PTP-PEST (2.5 nM). Error bars represent the standard deviation of triplicate experiments.
Figure 3.

Kinetic parameters for pPEST1tide with PTP-PEST (2.5 nM). Values were determined as described in the Materials and Methods section (R2 = 0.87). Error bars represent the standard deviation of triplicate experiments.
Figure 4.

Limit of detection of pPEST1tide for PTP-PEST. Normalized, absolute reaction slopes corresponding to reactions containing decreasing concentrations of PTP-PEST in the presence of pPEST1tide (10 μM). Error bars represent the standard deviation of six replicates.
Selectivity of pPEST1tide.
Confident in the ability of pPEST1tide to act as a substrate for PTP-PEST, we next sought to determine the specificity of pPEST1tide against a panel of protein phosphatases comprising PTP1B, TCPTP, SHP-1, and SHP-2. Based on previously published selectivity data for the parent peptide that showed a marginal decrease of 4-fold in kcat/KM for PTP1B relative to PTP-PEST,44 we expected to observe potential off-target activity from PTP1B. Indeed, while pPEST1tide was preferentially dephosphorylated by PTP-PEST, PTP1B displayed 62% of the reactivity of PTP-PEST when assayed against the probe (Figure 5). The remaining phosphatases in the panel displayed virtually no activity on pPEST1tide under the conditions used (Figure 5). As a step towards the identification of conditions to selectivity monitor PTP-PEST activity in the presence of PTP1B, we asked whether MSI-1436 (Figure S6A), a selective inhibitor for PTP1B,45 influenced the activity of PTP-PEST. For this purpose, we chose the universal PTP substrate DiFMUP. As expected, 10 μM MSI-1436 virtually abolished PTP1B activity (Figure S6B). However, the same concentration of inhibitor reduced PTP-PEST activity by a modest 38% (Figure S6B). Thus, MSI-1436 could potentially be used to reduce off target activity from PTP1B in assays containing mixtures of PTPs, such as cell lysates.
Figure 5.

Selectivity of pPEST1tide for a panel of PTPs. Normalized, absolute reaction slopes corresponding to assays with the indicated protein phosphatase (2.5 nM) in the presence of pPEST1tide (10 μM). Error bars represent the standard deviation of triplicate experiments.
Conclusions
We present the design, synthesis, and optimization of a direct activity sensor for monitoring PTP-PEST enzymatic activity. pPEST1tide displayed of limit of detection of 0.2 nM with recombinant PTP-PEST, enabling potential applications in unfractionated cell lysates. We also defined the selectivity profile of pPEST1tide among a panel of phosphatases and provide conditions for potentially suppressing off-target activity from PTP1B. In the long term, this activity probe could be used to identify inhibitors of PTP-PEST activity which could be used to probe the function of this enzyme in biological systems. Alternatively, this new probe may find applications in interrogating PTP-PEST activity in human disease, such as HCC, as well as identifying aggressive tumors.
Supplementary Material
Acknowledgements
We acknowledge the Research Instrumentation Facility and the Nebraska Center for Mass Spectrometry for assistance with characterization of probes. This work was supported by the NIH (R35GM119751) and the University of Virginia. The content of this work is solely the responsibility of the authors and does not necessarily represent the official views of the NIH.
Footnotes
Conflicts of Interest
There are no conflicts to declare.
Notes and References
- 1.Julien SG, Dubé N, Hardy S and Tremblay ML, Nat. Rev. Cancer, 2010, 11, 35. [DOI] [PubMed] [Google Scholar]
- 2.Sun T, Aceto N, Meerbrey Kristen L., Kessler Jessica D., Zhou C, Migliaccio I, Nguyen Don X., Pavlova Natalya N., Botero M, Huang J, Bernardi Ronald J., Schmitt E, Hu G, Li MZ, Dephoure N, Gygi Steven P., Rao M, Creighton Chad J., Hilsenbeck Susan G., Shaw Chad A., Muzny D, Gibbs Richard A., Wheeler David A., Osborne CK, Schiff R, Bentires-Alj M, Elledge Stephen J. and Westbrook Thomas F., Cell, 2011, 144, 703. [DOI] [PMC free article] [PubMed] [Google Scholar]
- 3.Angers-Loustau A, Côté JF, Charest A, Dowbenko D, Spencer S, Lasky LA and Tremblay ML, J. Cell Biol, 1999, 144, 1019. [DOI] [PMC free article] [PubMed] [Google Scholar]
- 4.Angers-Loustau A, Cote JF and Tremblay ML, Biochem. Cell Biol, 1999, 77, 493. [PubMed] [Google Scholar]
- 5.Souza CM, Davidson D, Rhee I, Gratton JP, Davis EC and Veillette A, J. Biol. Chem, 2012, 287, 43180. [DOI] [PMC free article] [PubMed] [Google Scholar]
- 6.Zheng Y, Xia Y, Hawke D, Halle M, Tremblay ML, Gao X, Zhou XZ, Aldape K, Cobb MH, Xie K, He J and Lu Z, Mol. Cell, 2009, 35, 11. [DOI] [PMC free article] [PubMed] [Google Scholar]
- 7.Zheng Y, Yang W, Xia Y, Hawke D, Liu DX and Lu Z, Mol. Cell. Biol, 2011, 31, 4258. [DOI] [PMC free article] [PubMed] [Google Scholar]
- 8.Wu MQ, Hu P, Gao J, Wei WD, Xiao XS, Tang HL, Li X, Ge QD, Jia WH, Liu RB and Xie XM, Asian Pac. J. Cancer Prev, 2013, 14, 287. [DOI] [PubMed] [Google Scholar]
- 9.Espejo R, Rengifo-Cam W, Schaller MD, Evers BM and Sastry SK, Am. J. Physiol. Cell Physiol, 2010, 299, C454. [DOI] [PMC free article] [PubMed] [Google Scholar]
- 10.Villa-Moruzzi E, Anal. Cell. Pathol, 2011, 34, 101. [DOI] [PMC free article] [PubMed] [Google Scholar]
- 11.Kodama T, Newberg JY, Kodama M, Rangel R, Yoshihara K, Tien JC, Parsons PH, Wu H, Finegold MJ, Copeland NG and Jenkins NA, Proc. Natl. Acad. Sci. U. S. A, 2016, 113, E3384. [DOI] [PMC free article] [PubMed] [Google Scholar]
- 12.Luo RZ, Cai PQ, Li M, Fu J, Zhang ZY, Chen JW, Cao Y, Yun JP, Xie D and Cai MY, PLOS One, 2014, 9, e85592. [DOI] [PMC free article] [PubMed] [Google Scholar]
- 13.Kohn M, ACS Cent. Sci, 2020, 6, 467. [DOI] [PMC free article] [PubMed] [Google Scholar]
- 14.Casey GR and Stains CI, Chem. Eur. J, 2018, 24, 7810. [DOI] [PMC free article] [PubMed] [Google Scholar]
- 15.Fahs S, Lujan P and Köhn M, ACS Chem. Biol, 2016, 11, 2944. [DOI] [PubMed] [Google Scholar]
- 16.Stanford SM, Ahmed V, Barrios AM and Bottini N, Antioxid. Redox Signal, 2014, 20, 2160. [DOI] [PMC free article] [PubMed] [Google Scholar]
- 17.Biswas S, McCullough BS, Ma ES, LaJoie D, Russell CW, Garrett Brown D, Round JL, Ullman KS, Mulvey MA and Barrios AM, Chem. Commun, 2017, 53, 2233. [DOI] [PubMed] [Google Scholar]
- 18.McCullough BS and Barrios AM, Biochemistry, 2018, 57, 2584. [DOI] [PubMed] [Google Scholar]
- 19.Mitra S and Barrios AM, Bioorg. Med. Chem. Lett, 2005, 15, 5142. [DOI] [PubMed] [Google Scholar]
- 20.Choi Y, Shin SH, Jung H, Kwon O, Seo JK and Kee JM, ACS Sens, 2019, 4, 1055. [DOI] [PubMed] [Google Scholar]
- 21.Jung H, Choi Y, Lee D, Seo JK and Kee JM, Chem. Commun, 2019, 55, 7482. [DOI] [PubMed] [Google Scholar]
- 22.Szymczak LC, Huang CF, Berns EJ and Mrksich M, Methods Enzymol, 2018, 607, 389. [DOI] [PMC free article] [PubMed] [Google Scholar]
- 23.Szymczak LC, Sykora DJ and Mrksich M, Chemistry, 2020, 26, 165. [DOI] [PubMed] [Google Scholar]
- 24.Huang CF and Mrksich M, ACS Comb. Sci, 2019, 21, 760. [DOI] [PMC free article] [PubMed] [Google Scholar]
- 25.Moully EH, Berns EJ and Mrksich M, Anal. Chem, 2019, 91, 13206. [DOI] [PMC free article] [PubMed] [Google Scholar]
- 26.Beck JR, Lawrence A, Tung AS, Harris EN and Stains CI, ACS Chem. Biol, 2016, 11, 284. [DOI] [PubMed] [Google Scholar]
- 27.Beck JR, Truong T and Stains CI, ACS Chem. Biol, 2016, 11, 3284. [DOI] [PMC free article] [PubMed] [Google Scholar]
- 28.Casey GR, Beck JR and Stains CI, Methods Enzymol, 2019, 622, 29. [DOI] [PMC free article] [PubMed] [Google Scholar]
- 29.Shults MD and Imperiali B, J. Am. Chem. Soc, 2003, 125, 14248. [DOI] [PubMed] [Google Scholar]
- 30.Shults MD, Pearce DA and Imperiali B, J. Am. Chem. Soc, 2003, 125, 10591. [DOI] [PubMed] [Google Scholar]
- 31.Beck JR, Peterson LB, Imperiali B and Stains CI, Curr. Protoc. Chem. Biol, 2014, 6, 135. [DOI] [PMC free article] [PubMed] [Google Scholar]
- 32.Lukovic E, Vogel Taylor E and Imperiali B, Angew. Chem. Int. Ed, 2009, 48, 6828. [DOI] [PMC free article] [PubMed] [Google Scholar]
- 33.Peterson LB, Yaffe MB and Imperiali B, Biochemistry, 2014, 53, 5771. [DOI] [PMC free article] [PubMed] [Google Scholar]
- 34.Shults MD, Janes KA, Lauffenburger DA and Imperiali B, Nat. Methods, 2005, 2, 277. [DOI] [PubMed] [Google Scholar]
- 35.Stains CI, Tedford NC, Walkup TC, Lukovic E, Goguen BN, Griffith LG, Lauffenburger DA and Imperiali B, Chem. Biol, 2012, 19, 210. [DOI] [PMC free article] [PubMed] [Google Scholar]
- 36.Warthaka M, Adelmann CH, Kaoud TS, Edupuganti R, Yan C, Johnson WH Jr., Ferguson S, Tavares CD, Pence LJ, Anslyn EV, Ren P, Tsai KY and Dalby KN, ACS Med. Chem. Lett, 2015, 6, 47. [DOI] [PMC free article] [PubMed] [Google Scholar]
- 37.Zamora-Olivares D, Kaoud TS, Zeng L, Pridgen JR, Zhuang DL, Ekpo YE, Nye JR, Telles M, Anslyn EV and Dalby KN, ACS Chem. Biol, 2020, 15, 83. [DOI] [PMC free article] [PubMed] [Google Scholar]
- 38.Beck JR, Cabral F, Rasineni K, Casey CA, Harris EN and Stains CI, Biochemistry, 2019, 58, 3911. [DOI] [PMC free article] [PubMed] [Google Scholar]
- 39.Beck JR, Harris EN and Stains CI, Methods Mol. Biol, 2017, 1636, 61. [DOI] [PMC free article] [PubMed] [Google Scholar]
- 40.Broughton K, Korski K, Echeagaray O, Adamson R, Dembitsky W, Lu Z, Schaefer E and Sussman MA, Gene Ther, 2019, 26, 324. [DOI] [PubMed] [Google Scholar]
- 41.Beck JR, Zhou X, Casey GR and Stains CI, Anal. Chim. Acta, 2015, 897, 62. [DOI] [PubMed] [Google Scholar]
- 42.Kelly MI, Bechtel TJ, Reddy DR, Hankore ED, Beck JR and Stains CI, Anal. Chim. Acta, 2015, 891, 284. [DOI] [PubMed] [Google Scholar]
- 43.Luković E, González-Vera JA and Imperiali B, J. Am. Chem. Soc, 2008, 130, 12821. [DOI] [PMC free article] [PubMed] [Google Scholar]
- 44.Selner NG, Luechapanichkul R, Chen X, Neel BG, Zhang Z-Y, Knapp S, Bell CE and Pei D, Biochemistry, 2014, 53, 397. [DOI] [PMC free article] [PubMed] [Google Scholar]
- 45.Krishnan N, Koveal D, Miller DH, Xue B, Akshinthala SD, Kragelj J, Jensen MR, Gauss CM, Page R, Blackledge M, Muthuswamy SK, Peti W and Tonks NK, Nat. Chem. Biol, 2014, 10, 558. [DOI] [PMC free article] [PubMed] [Google Scholar]
Associated Data
This section collects any data citations, data availability statements, or supplementary materials included in this article.