Abstract
The Rbfox family of splicing factors regulate alternative splicing during animal development and in disease, impacting thousands of exons in the maturing brain, heart, and muscle. Rbfox proteins have long been known to bind to the RNA sequence GCAUG with high affinity, but just half of Rbfox binding sites contain a GCAUG motif in vivo. We incubated recombinant RBFOX2 with over 60,000 mouse and human transcriptomic sequences to reveal substantial binding to several moderate-affinity, non-GCAYG sites at a physiologically relevant range of RBFOX concentrations. We find that many of these “secondary motifs” bind Rbfox robustly in cells and that several together can exert regulation comparable to GCAUG in a trichromatic splicing reporter assay. Furthermore, secondary motifs regulate RNA splicing in neuronal development and in neuronal subtypes where cellular Rbfox concentrations are highest, enabling a second wave of splicing changes as Rbfox levels increase.
Introduction
The Rbfox family of RNA-binding proteins (RBPs) have been the subjects of numerous genetic, biochemical, and structural studies since their discovery over twenty-five years ago. Rbfox1 was identified in 1994 as the genomic locus feminizing on X (fox-1) in C. elegans; it was subsequently shown that the encoded protein peaks in expression in larval development and controls sex determination by repressing the dosage compensation factor xol-1 post-transcriptionally1,2. Mammalian Rbfox1 (A2BP1) and its paralogs Rbfox2 (RBM9) and Rbfox3 (NeuN) are highly expressed in heart, skeletal muscle, and in the brain, with a characteristic spike in expression in late neuronal development3–6. While Rbfox proteins are predominantly nuclear and regulate pre-mRNA splicing, some isoforms are also expressed in the cytoplasm, where they regulate RNA stability7.
The three mammalian paralogs have high sequence identity (94–99%) in their RNA-binding domains (RBDs), substantially overlapping gene targets, and similar activities, making single knockouts difficult to interpret and regulatory targets challenging to define8,9. Mouse Rbfox1 central nervous system (CNS) knockouts have seizures and defects in neuronal excitability, while Rbfox2 CNS knockout mice exhibit defects in cerebellar development9,10. Binding targets of RBFOX1, both mRNA splicing- and mRNA stability-related, are enriched for genes related to autism, axon and dendrite formation, and electrophysiology in mice11–14, and mutations in Rbfox1 and Rbfox3 have been associated with autism and epilepsy in humans15–18. Recently, it was shown that Rbfox triple knockout mouse embryonic stem cells fail to develop a mature splicing profile when differentiated into ventral motor neurons, underscoring the roles of these proteins in neuronal maturation8.
In 2003, RBFOX1 was found to bind the pentanucleotide GCAUG with high affinity and regulate alterative exon inclusion through binding to flanking intronic regions19. (U)GCAUG had long been established as a prominent signal in computational analyses of neuronal alternative splicing, and Rbfox proteins have been shown to regulate numerous alternative exons through this motif in a variety of neuronal subtypes8,14,20,21. Binding to the GCAUG motif is mediated by canonical and non-canonical interactions between the protein’s single RNA recognition motif (RRM) and target RNA22. Generally, binding of Rbfox proteins to motifs in the proximal ~200 nucleotides (nt) of the intron downstream of an alternative exon activates exon inclusion, while binding in the proximal upstream intron or alternative exon promotes exon exclusion23. However, more distal motifs are also able to regulate splicing24. Proteins recruited by the Ala/Tyr/Gly-rich C-terminal domain of Rbfox mediate its effects on splicing, whereas its effects on stability may be related to competition with other RBPs and microRNAs13,25.
Although Rbfox binding to canonical GCAUG motifs and rarer GCACG motifs is well characterized, studies of binding sites in vivo using crosslinking-immunoprecipitation (CLIP) have observed that about half of CLIP peaks lack an associated GCAYG (Y = C or U) motif23, suggesting the existence of additional binding determinants26. Indeed, recent studies have noted GUGUG motifs and motifs differing by one base from the canonical GCAUG in CLIP peaks12,27–29, and RBFOX1 was shown to compete with MBNL1 at a GCCUG motif30. It has been proposed that binding to GUGUG is mediated by partner proteins such as SUP12 or members of the large assembly of splicing regulators (LASR) complex31–33. Direct binding of Rbfox proteins to these motifs has not been excluded, but if such binding occurs it is not known to have any functional consequence. Almost all studies of Rbfox binding to date have filtered their datasets for the presence of a GCAUG element, discarding many other CLIP peaks8–10,12–14,34.
Studies of Rbfox in vivo binding and regulation using CLIP have identified important regulatory targets and uncovered complex regulatory networks. However, CLIP is known to have substantial rates of false positives and false negatives35–37, making it challenging to confidently infer binding sites. Here we employ RNA Bind-n-Seq with natural sequences (nsRBNS) as a biochemical approach to refine our understanding of Rbfox binding across mammalian transcriptomes28,38. Our method detects strong binding to the canonical Rbfox motif GCAYG, but also binding to several additional motif variants. We show that Rbfox proteins bind to these “secondary motifs” in vivo, and exert regulatory activity in a manner dependent on Rbfox concentration. Furthermore, we find evidence of important roles for secondary motifs in splicing programs involved in neuronal differentiation and subtype specification, and we propose a model for Rbfox regulation that incorporates these motifs.
Results
Natural sequence RBNS recovers known features of RBFOX2 binding
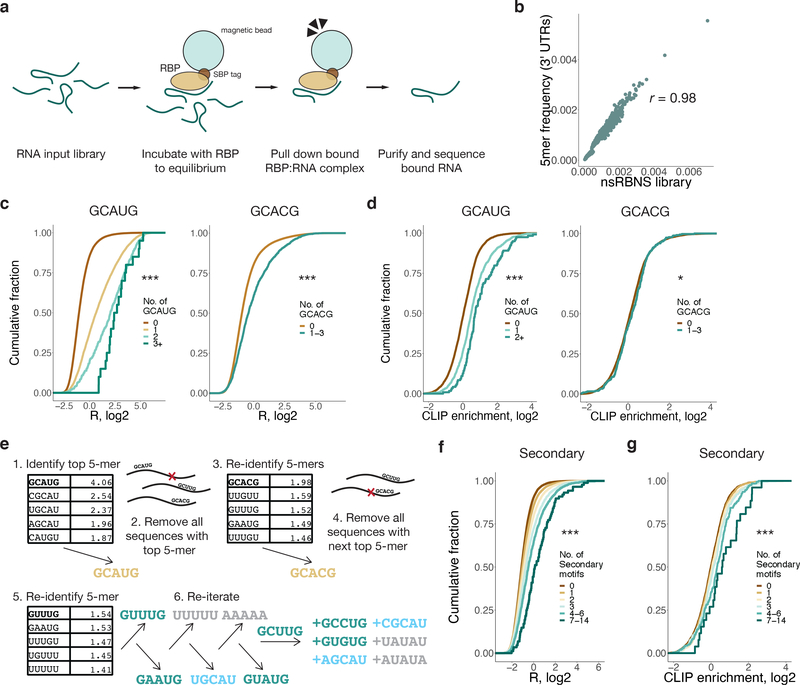
To better understand the transcriptomic RNA binding preferences of RBFOX2 across the transcriptome, we designed an nsRBNS library based on naturally-occurring mammalian 3' untranslated region (UTR) sequences (Figure 1a). To construct the library, ~2,200 well-annotated human and mouse 3' UTRs were selected that matched the base and 5mer composition of the entire 3' UTR transcriptome (Figure 1b). The 3' UTRs of each of these transcripts were divided into overlapping 110-base segments (Supplementary Table 1), which are longer than those used in random sequence RBNS (typically 20–40 nt), enabling analysis of binding of RBFOX2 to motif clusters.
Figure 1. 3' UTR natural sequence nsRBNS (nsRBNS) with RBFOX2 captures variation in binding affinity.
a. Schematic of nsRBNS. Recombinant protein is incubated with a designed RNA library to equilibrium and bound RBP:RNA complexes are purified. Oligonucleotides are sequenced and the enrichment (R) value is calculated ((reads per million)input/(reads per million)pulldown). b. nsRBNS 5mer frequencies correlated with 5mer frequencies of the 3' UTR transcriptome (n = 1024 5mers). Pearson correlation. c. Distribution of R for nsRBNS sequences containing 0 (n = 49931), 1 (n = 5586), 2 (n = 392), or 3+ (n = 22) Rbfox GCAUG motifs and 0 (n = 54637) or 1–3 (n = 1294) GCACG motifs *** P < 0.001 between lowest and highest counts (two-sided Wilcoxon Rank-Sum test). d. Distribution of enrichment of RBFOX2 eCLIP reads in HepG2 cells with increased motif count for 0 (n = 8004), 1 (n = 1244), or 2+ (n = 118) GCAUG motifs and 0 (n = 9065) or 1–3 (n = 301) GCACG motifs in transcriptomic regions corresponding to those in nsRBNS library (normalized to IgG control). *** P < 0.001, * P < 0.05 between lowest and highest counts (two-sided Wilcoxon Rank-Sum test). e. An iterative method discovers moderate binding by RBFOX2 to six motifs of the sequence format GHNUG (teal) beyond two known Rbfox motifs (gold). After nine rounds of enrichment analysis, remaining GNNUG 5mers (teal) were also included as secondary motifs, while AU-rich (grey) and shifted (light blue) 5mers were excluded from subsequent analyses. f. Distribution of R for nsRBNS sequences containing 0 (n = 25501), 1 (n = 18682), 2 (n = 7957), 3 (n = 2576), 4–6 (n = 1069), or 7–14 (n = 146) secondary motifs. *** P < 0.001 between lowest and highest counts (two-sided Wilcoxon Rank-Sum test). g. Distribution of enrichment of RBFOX2 eCLIP reads in HepG2 cells at 0 (n = 3922), 1 (n = 3188), 2 (n = 1453), 3 (n = 498), 4–6 (n = 262), or 7–14 (n = 43) secondary motifs at library positions in the transcriptome (normalized to IgG control). *** P < 0.001 between lowest and highest counts (two-sided Wilcoxon Rank-Sum).
We performed nsRBNS with recombinant RBFOX2 at 4 nM, 14 nM, 43 nM, 121 nM (in technical duplicate), 365 nM and 1.1μM, as well as a 0 nM (no protein) control, with a constant 250 nM RNA concentration. This range, spanning 2.5 orders of magnitude, is comparable to the natural range of total Rbfox family expression, which varies at the mRNA level by at least three orders of magnitude across cell types4, and by at least an order of magnitude during neuronal differentiation39.
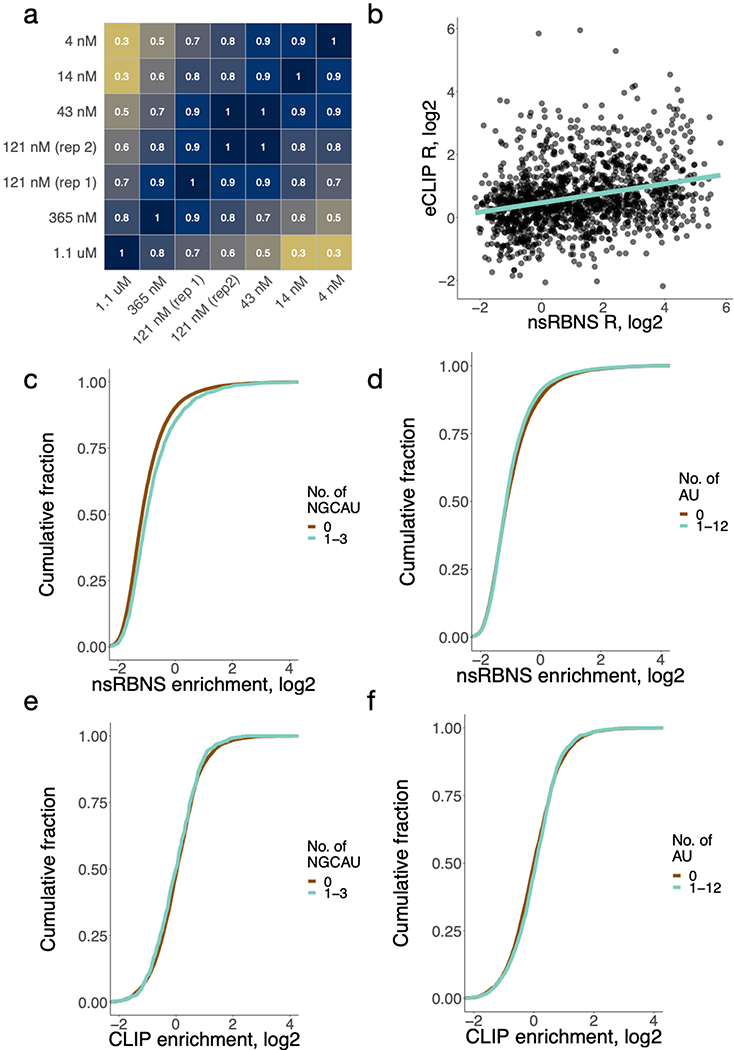
Enrichment (R) values were calculated for each individual oligonucleotide as the ratio of the frequency in the bound pool of RNA over the frequency in control (no protein) conditions (Supplementary Table 2). R values of bound oligonucleotides at similar concentrations were strongly correlated (r ≥ 0.74) (Extended Data Figure 1a), indicating high reproducibility of oligonucleotide-specific binding. Of the 55,931 sequences (87% of the total) that were detectable at 365 nM, 8,412 (15%) bound with R ≥ 1.1 (10% enrichment) about half of which (4,032) contained a canonical GCAYG motif. The distribution of R values was shifted upwards with increasing counts of each motif (Figure 1c, P < 2.01 × 10⁻¹³ and P < 5.64 × 10−46, respectively), consistent with previous work38. Similar trends were observed when considering in vivo binding, assessed by the density of reads mapping to the genomic region of each oligonucleotide, using published eCLIP data (Figure 1d, P < 2.7 × 10⁻²³ and P < 0.10, respectively)37. The nsRBNS R values of sequences in the library that contained a single GCAUG had a moderate positive correlation with eCLIP read density in the corresponding mRNA regions (r = 0.28, P < 1.1 × 10⁻²⁵, Extended Data Figure 1b), as observed previously38, confirming that this assay captures some aspects of motif context that are relevant in vivo.
RBFOX2 binds a set of secondary motifs of intermediate affinity in vitro
We aimed to systematically identify sequence elements beyond the “primary” GCAYG motifs that might help to explain the large dynamic range of RBFOX2 binding and the presence of many oligonucleotides with binding above background that lacked GCAYG motifs. We employed an iterative analysis, identifying the most enriched 5mer (GCAUG), then removing all oligonucleotides containing this 5mer and recalculating motif enrichments from the remaining oligonucleotides (Figure 1e). This procedure, similar to that employed in the SKA algorithm for random-library RBNS28, is designed to prevent the spurious detection of 5mers that are enriched due to overlap with a higher-affinity 5mer. We performed the iterative enrichment analysis on data from the highest RBFOX2 concentration, 1.1 μM, which should favor binding to lower-affinity sites28.
At each of the first four iterations, the most enriched 5mers matched the pattern GNNYG. At iterations 5–9, 5mers matched either: GHWUG (GUAUG, GCUUG), where H = A, C or U; NGCAU (UGCAU), where N = A, C, G or U; or W5 (AAAAA, UUUUU), where W = A or U. We considered these three different classes of potential binding motifs, which might bind RBFOX2 directly or be enriched for other reasons. To cast a wide net, we also considered other 5mers matching these patterns that had R values at least 2.5 standard deviations above the mean in the remaining oligonucleotides, adding the GNNUG 5mers GCCUG and GUGUG, the NGCAU 5mers CGCAU and AGCAU, and the W5 motifs UAUAU and AUAUA to our list of potential binding motifs.
At the oligonucleotide level, the six GHNUG secondary motifs robustly increased the R-value of an oligonucleotide when several motif occurrences were present (Figure 1f, P < 9.3 × 10⁻²⁵). The NGCAU and W5 5mers did so to a somewhat lesser extent (Extended Data Figure 1c–d; P < 8.8 × 10⁻²⁸ and P < 0.001, respectively). We also observed increased eCLIP enrichment in regions with increasing numbers of GHNUG motifs (Figure 1g, P < 6.1 × 10⁻⁷)40. However, NGCAU and W5 5mers are not robustly enriched in eCLIP data (Extended Data Figure 1e–f, P < 0.071, P < 0.017, respectively). Because of the highly significant binding signal for the six GHNUG 5mers in both nsRBNS and eCLIP, we chose to pursue only this subclass of secondary motifs for further study. Together, these six non-GCAYG 5mers comprised our set of candidate “secondary” Rbfox motifs.
Biochemical characterization of Rbfox secondary motifs
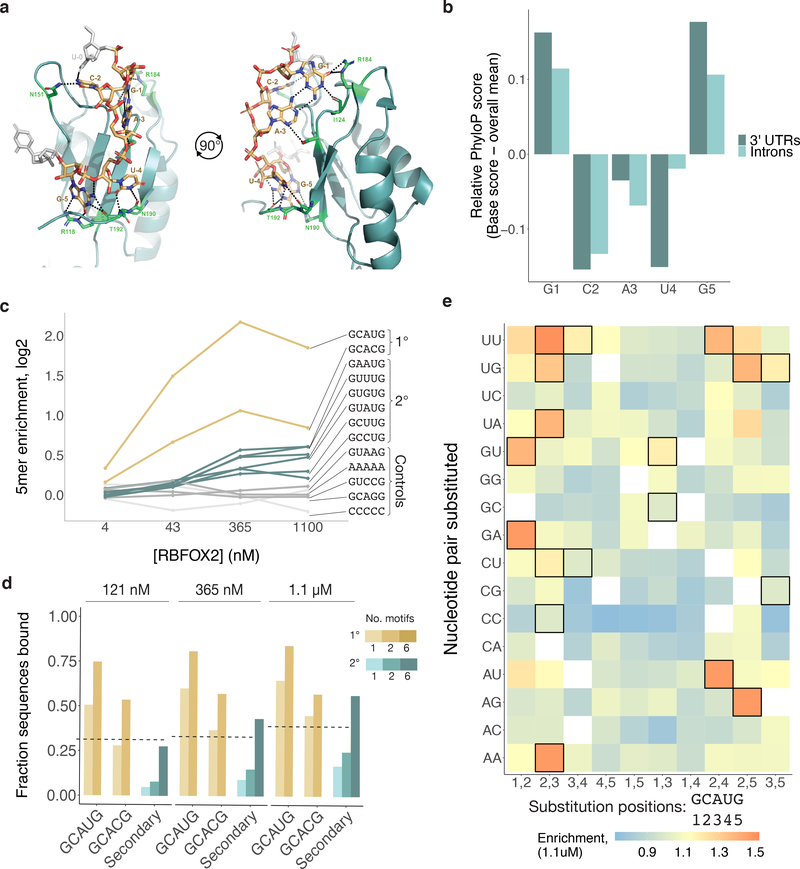
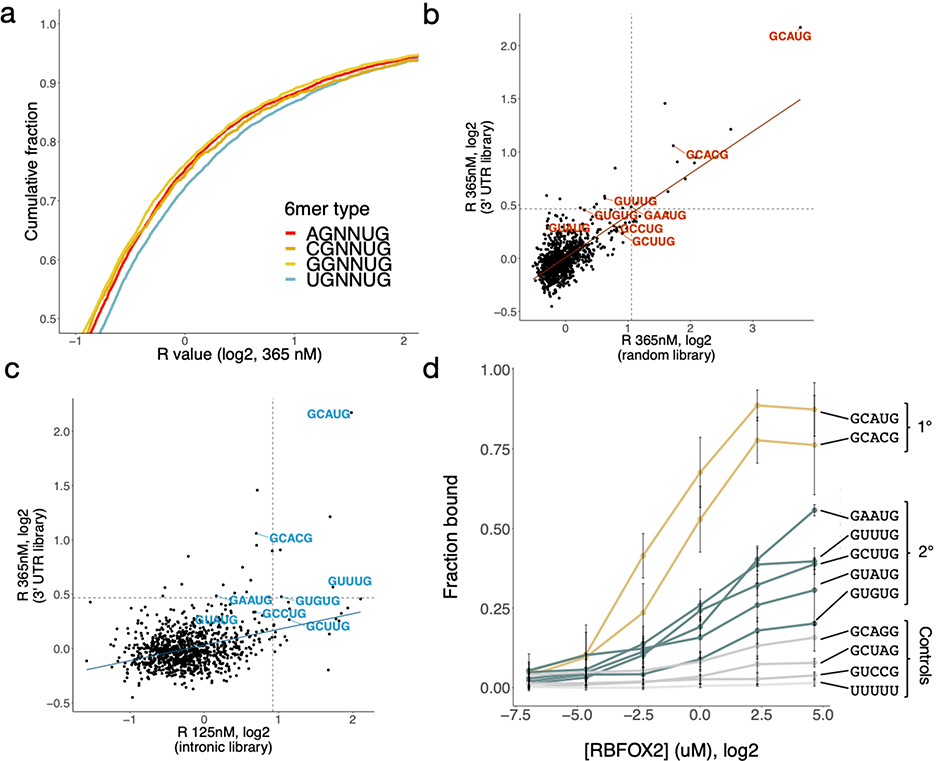
Our iterative method suggested that the G1, G5 and U4 positions of the Rbfox motif are the most critical sites of recognition for the protein. This observation is consistent with published structures of RBFOX1 bound to (U)GCAUG(U), in which the primary hydrogen bonding contacts occur at G1, U4, and G5, while the other bases are recognized mostly by shape (Figure 2a)41. Rbfox tolerating nucleotide variants at positions 2 and 3 is also consistent with the conservation pattern of GCAUG in introns and 3' UTRs, where we observed that the G1 and G5 positions are most strongly conserved, with the intervening positions showing less constraint (Figure 2b). Examining the nsRBNS enrichment of 6mers ending with the six GHNUG 5mers, we observed a preference for C or U at the first position, consistent with the preference of GCAYG motifs for an upstream U or C (Extended Data Figure 2a)41.
Figure 2. Rbfox proteins reproducibly bind a class of secondary motifs with moderate affinity.
a. Ribbon structure of RBFOX1 (teal) bound to UGCAUG (gold). Generated with data from Auweter et al.41 (PDB 2ERR). Protein–RNA hydrogen bonds are indicated in black. b. Relative per-base conservation, as represented by PhyloP score, for each position of GCAUG at all instances of the motif in 3' UTRs (dark teal, n = 26707) and introns (light teal, n = 91791). c. Primary (gold), secondary (teal), polyA and polyC (light grey), and GCAGG, GUAAG, and GUCCG (dark grey) R values are shown across four concentrations of RBFOX2 nsRBNS experiments. d. Analysis of the fraction of oligonucleotides bound in nsRBNS at three concentrations of RBFOX2 for primary (gold (GCAUG and GCACG), nGCAUG-1 = 5435, nGCAUG-2 = 384, nGCACG-1 = 1246, nGCACG-2 = 30) and secondary (teal, nSecondary-1 = 15676, nSecondary-2 = 6722, nSecondary-6 = 64) motifs. An oligonucleotide was considered bound if it had an R value of at least 1.1. e. nsRBNS R values at 1.1 μM RBFOX2 concentration for all pentamers diverging from GCAUG or GCACG by 1 or 2 bases. Secondary motifs identified here are outlined in black.
To further explore these candidate motifs, we reanalyzed data from previous random-library RBNS and intronic nsRBNS experiments performed with RBFOX228,38. In random-library RBNS, which employs much shorter sequences that are unlikely to contain more than a single motif by chance, secondary motifs were only weakly enriched (Extended Data Figure 2b). However, in an nsRBNS experiment using highly conserved intronic regions, U-rich secondary motifs GCUUG, GUUUG, and GUGUG were enriched (Extended Data Figure 2c). Thus, length and sequence composition of the library used in nsRBNS may impact detection of specific secondary motifs.
Our design with varying concentrations of RBFOX2 enabled analysis of relative RBP occupancies and saturation. As seen previously28, Rbfox primary motifs had high enrichment that declined at the highest protein concentration (1.1 μM), consistent with these sites reaching saturation around the 2nd-highest concentration, 365 nM (Figure 2c). Control 5mers (e.g., AAAAA, CCCCC) or 5mers differing from GCAUG by one substitution but not identified as secondary motifs (GCAGG, GUAAG, GUCCG) had low R values across concentrations, suggesting the absence of specific binding. By contrast, the secondary motifs identified above exhibited steadily increasing enrichment at successive protein concentrations, consistent with moderate-affinity binding that becomes saturated at or above 1.1 μM [RBFOX2].
We noted that about half of the oligonucleotides containing six or more secondary motifs were detectably bound at 1.1 μM [RBFOX2], comparable to the fraction of oligonucleotides containing a single GCAUG that were bound at lower Rbfox concentrations (Figure 2d). This observation suggests that clusters of secondary motifs may function in regulation similarly to single primary motifs when Rbfox concentrations are high. Notably, in a previous study using surface plasmon resonance, several secondary motifs had Kd values in the 100–600 nM range29, well above the low nanomolar value observed for GCAUG but comparable to the highest-affinity motifs of many other RNA-binding proteins42. Of the 4,358 sequences bound at R ≥ 1.1 in nsRBNS that lacked a primary motif, 1,885 (43%) contain at least one of the GHNUG secondary motifs. Thus, the six secondary motifs identified appear to explain a plurality of the non-canonical (non-GCAYG) RBFOX2 binding to our nsRBNS library. To further explore whether other related 5mers beyond those identified above are specifically bound by RBFOX2, we examined the binding at 1.1 μM [RBFOX2] of all 5mers with one or two positions substituted relative to the primary motif GCAUG (Figure 2e). The most enriched 5mers consisted predominantly of the two primary and six secondary motifs. Besides these, certain AU-rich 5mers with two differences from GCAUG (UUAUG, AUAUG, GUAUU, and GUAUA) showed modest enrichment.
We tested RBFOX2 binding independently using a nitrocellulose and nylon filter binding assay (Extended Data Figure 2d, Supplementary Table 3). This assay showed stronger binding to radio-labeled primary motifs than to any secondary motifs, as expected. The secondary motifs GCUUG, GAAUG, GUUUG and GUAUG bound more strongly than GUGUG or any of the negative controls (GCAGG, GCUAG, GUCCG, U23), most of which exhibited minimal or no binding.
RBFOX2 binds to specific secondary motifs in vivo
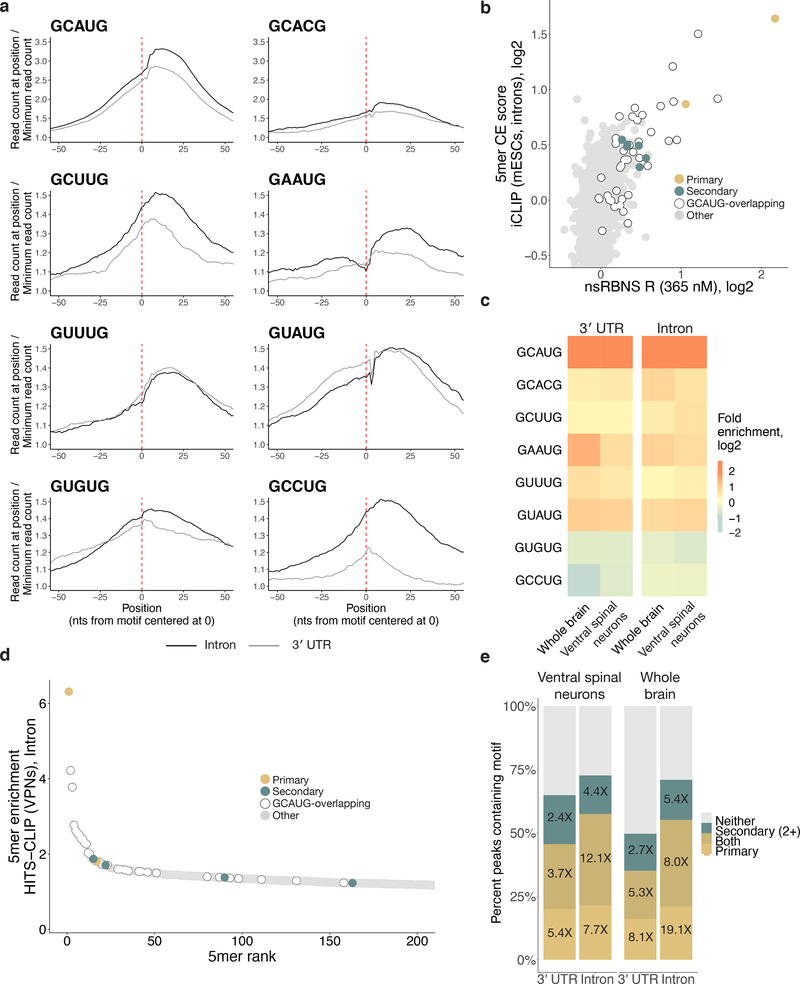
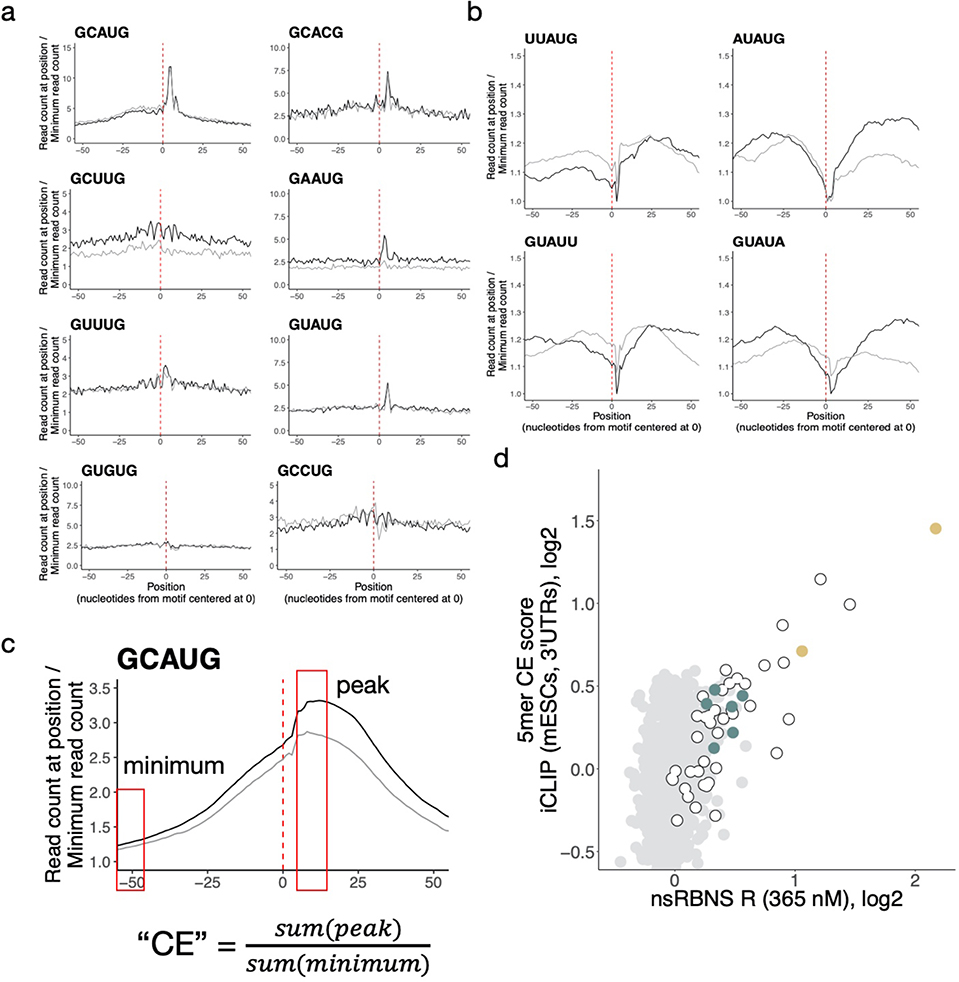
We next asked whether Rbfox binding to individual secondary motifs could also be observed in vivo. We analyzed published binding data generated using individual-nucleotide resolution CLIP (iCLIP) from mouse embryonic stem cells (mESCs)27. We constructed meta-motif plots, summing read density as a function of distance for every instance of a given 5mer in expressed introns or 3' UTRs (Figure 3a). Primary motifs and all six GHNUG secondary motifs showed a characteristic peak located somewhat 3' of the motif location, as expected28, with broader peaks observed in a few cases (e.g., GAAUG). Some of the motifs also showed evidence of crosslinking at U4 of the motif (Extended Data Figure 3a). The four AU-rich 5mers noted above lacked robust peaks and were thus excluded from further analyses (Extended Data Figure 3b). In general, the peaks were stronger and more clearly defined in introns than in 3' UTRs, likely reflecting the predominantly nuclear localization of RBFOX2 and its prominent role in splicing. We generated a CLIP enrichment value for each motif by normalizing the read density at the peak apex to the density at positions distal from the peak (Extended Data Figure 3c). Comparing iCLIP 5mer enrichments in 3' UTRs with nsRBNS 5mer R values in introns (Figure 3b) and 3' UTRs (Extended Data Figure 3d) yielded similar results: GCAUG- and GCAUG-overlapping 5mers were the most highly enriched by both measures, with GCACG next, and the six secondary motifs near the top of remaining 5mers by both measures.
Figure 3. Rbfox proteins bind secondary motifs in vivo.
a. Primary and secondary motif reads peak near 0 in a metaplot centered at the motif in introns (black) and 3' UTRs (grey) in RBFOX2 iCLIP data27 (GEO GSE54794). iCLIP reads containing the motif of interest (see Methods for read counts) were aligned with position one of the pentamer at 0 and normalized to the minimum read count in an 80-nt window (50-nt window shown). Y-axis range was reduced for secondary motifs. b. Correlation of intronic iCLIP- and nsRBNS-enriched 5mers (n = 1024). Secondary motifs indicated in teal, primary motifs indicated in gold. Grey dots indicate “hitchhiking” motifs that overlap the primary motif GCAUG by at least three bases but do not have intrinsic Rbfox affinity. c. RBFOX1 HiTS-CLIP data8,14 (SRA SRP128054, SRP035321) enrichments for primary motifs and secondary six motifs in both 3' UTRs (left, n = 2963 and 989) and introns (right, n = 847 and 1431) relative to transcriptomic frequencies in mouse whole brain and ventral spinal neurons, respectively. Enrichment was calculated based on the 5mer composition of 100-base CLIP peak regions centered around the apex of the CLIP peak relative to 5mer composition of the transcriptomic region. d. Four secondary motifs (GCUUG, GAAUG, GUUUG, GUAUG) are indicated among the top 200 highly enriched 5mers derived from intronic HiTS-CLIP peaks from mouse ventral spinal neurons. Primary motifs in gold, secondary motifs in teal. Peaks calculated as above. e. High-confidence CLIP peaks in two different Rbfox1 HiTS-CLIP datasets (SRA SRP128054, SRP035321) in ventral spinal neurons8 and mouse whole brain cells14 attributable to primary (light gold), or four secondary (teal; GCUUG, GAAUG, GUUUG, and GUAUG), or both (dark gold) motifs in both 3' UTRs (n = 15487 and n = 24972, respectively) and introns (n = 4800 and n = 1519, respectively). Fold enrichments above transcriptomic background are indicated. Peaks containing neither primary nor two or more secondary motifs are shown in grey.
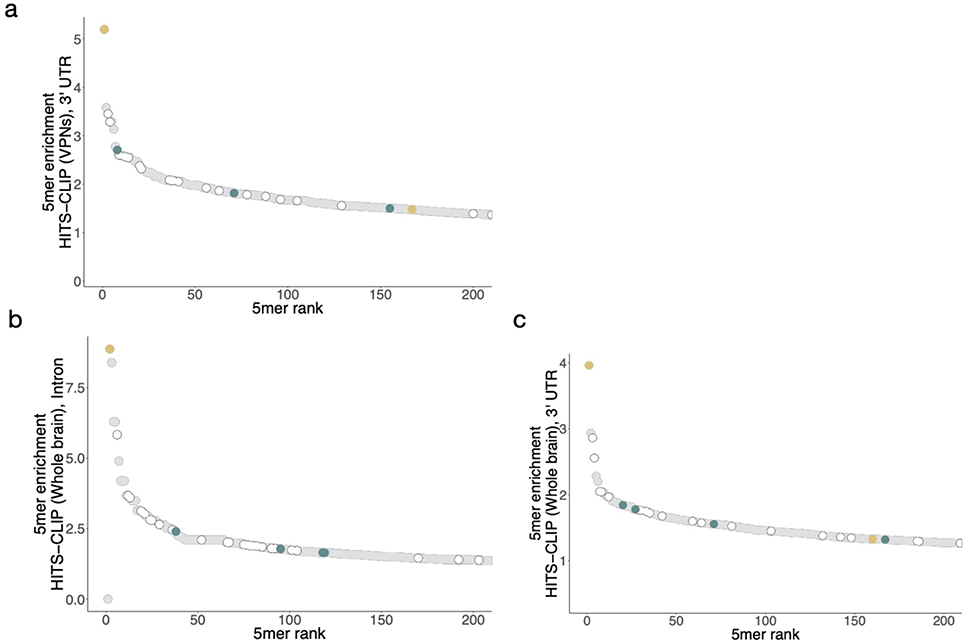
We further explored in vivo binding to specific 5mers in neuronal cell types, where expression of Rbfox protein is often very high. Using two high-throughput crosslinking and immunoprecipitation (HiTS-CLIP) datasets – in whole mouse brain and in vitro-differentiated ventral spinal neurons8,14 – we analyzed the enrichment of secondary motifs in stringently-filtered CLIP peaks present in two replicates in both 3' UTR and intronic regions. As expected, primary motifs were strongly (4.1–6.2-fold) and moderately (1.3–1.7-fold) enriched (Figure 3c–d, Extended Data Figure 4). Notably, four of the six secondary motifs (GCUUG, GAAUG, GUUUG, GUAUG) were also enriched in CLIP peaks to extents approaching that observed for GCACG. Because secondary motifs GUGUG and GCCUG lacked robust enrichment in HiTS-CLIP data, we chose to exclude them from further analysis of in vivo function, focusing instead on the remaining four motifs GCUUG, GAAUG, GUUUG, and GUAUG, all of the form GHWUG.
We explored the extent to which secondary motifs can account for CLIP peaks not explained by presence of a primary motif. To do so, we looked for instances of primary, secondary, or both motif types near 3' UTR or intronic HiTS-CLIP peaks that appeared in both replicates (Figure 3e)8,14. In both datasets, ~50% of peaks contained a primary motif or both types of motifs, while another 15–20% of peaks lacked primary motifs but contained two or more secondary motifs. The presence of ≥ 2 secondary motifs was enriched approximately five-fold in the intronic HiTS-CLIP peaks, and about 2.5-fold in 3' UTR peaks. Thus, consideration of secondary motifs helps to explain a substantial fraction of CLIP peaks that lack a primary motif.
Secondary motifs regulate splicing in an Rbfox-dependent manner
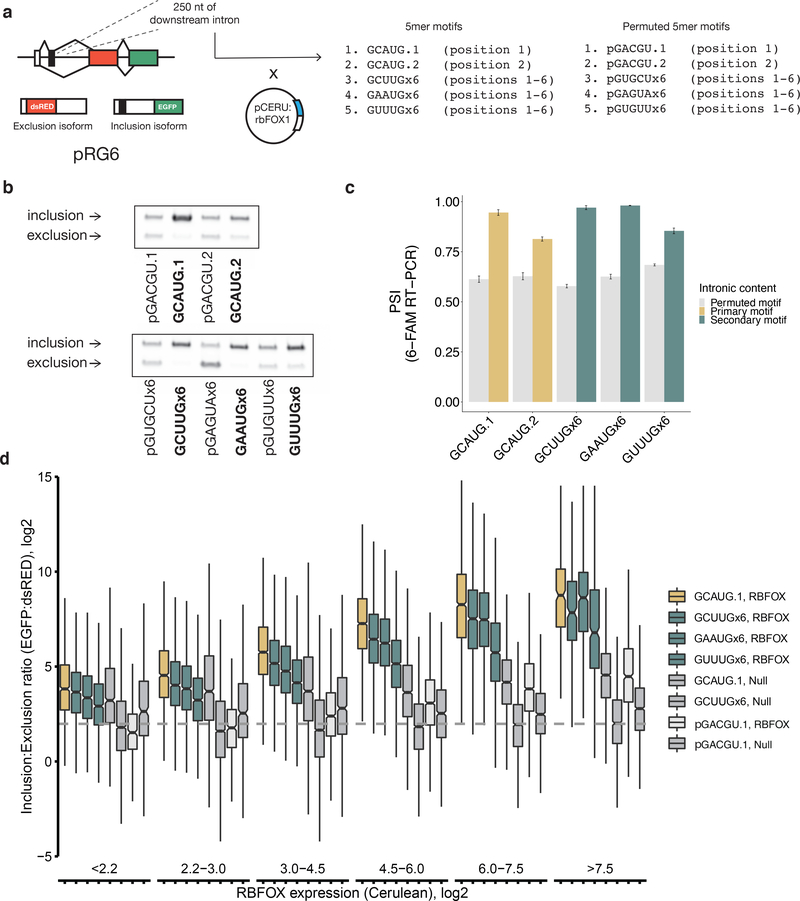
We next assessed the potential of secondary motifs to mediate Rbfox-dependent regulation. We adapted a bichromatic splicing reporter43 (pRG6) by introducing one copy of GCAUG or six copies of one of three secondary motifs (GCUUGx6, GAAUGx6, or GUUUGx6) into a 250 nt region downstream of an alternative exon (Figure 4a). For the secondary motifs, the six copies were inserted into interspersed positions (Supplementary Table 4), and a control vector was constructed for each by inserting a permuted version of the motif at the same positions (designated as pGCUUG, etc., with “p” for permuted). Exclusion of the alternative exon yields a transcript in which the DsRED ORF is in frame, while inclusion of the exon shifts the frame so that EGFP is produced; exon inclusion can be measured by red versus green fluorescence. We co-transfected the modified RG6 plasmid with or without a Cerulean:RBFOX1 fusion protein (pCERU:rbFOX1) into HEK293T cells to augment low endogenous levels of RBFOX2.
Figure 4. Secondary motifs in downstream introns promote exon inclusion in an Rbfox-dependent manner in a splicing reporter.
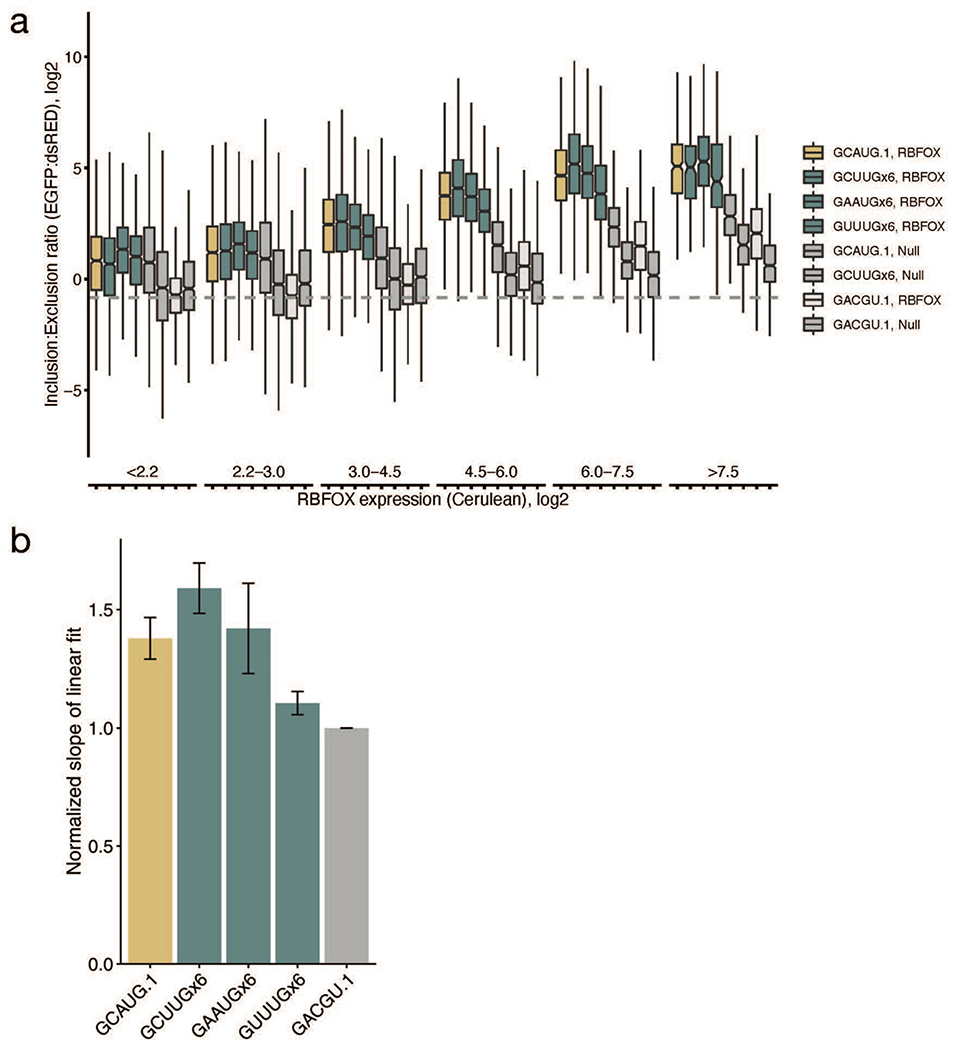
a. Experimental design of Rbfox1 splicing reporter. One GCAUG primary motif or six copies of a secondary motif (GCUUG, GAAUG, or GUAUG) were cloned in a 250-base window downstream of an alternative exon in the RG6 dual fluorescent splicing reporter. Plasmids were co-transfected in HEK293T cells with a plasmid expressing fluorescently labelled RBFOX1 to monitor cellular protein levels. b. Semi-quantitative PCR with 5’ 6-FAM-labelled primer indicates exon inclusion in the presence of both primary and secondary motifs in an Rbfox1-dependent manner. c. Mean percent spliced in (PSI) values of exons containing primary motifs (gold), secondary motifs (teal), or motif permutations (grey) in the downstream intron after expression of Rbfox1. Error bars show SD of technical replicates in triplicate. For GAAUG, the median permutation value was used due to the introduction of a splicing silencer in its permuted form. d. Per-cell inclusion:exclusion (EGFP:dsRED, y-axis) ratio for the RG6 alternative exon as Rbfox expression (Cerulean, x-axis) increases as measured by flow cytometry. Primary motifs (gold), six copies of three indicated secondary motifs (teal), primary (intact and permuted) and secondary motifs without co-transfection of Rbfox (dark grey), and a permuted primary motif with co-expressed Rbfox (light grey) are shown. Representative data from one of two replicates (the other is shown in Extended Data Figure 6). Bin numbers can be found in Supplementary Table 5. The center line represents the median, lower and upper hinges the first and third quartiles, respectively, and whiskers extend to the smallest or largest value (at most 1.5*IQR (interquartile range) of the hinge. Outliers are not shown. Notches extend 1.58*IQR/sqrt(n), giving a roughly 95% confidence interval on the medians. Uncropped gel image is available as source data online.
To measure the effect of Rbfox-mediated regulation of splicing in the presence of secondary motifs, we measured exon inclusion by RT-PCR with a fluorescently-labeled primer (Figure 4b). Insertion of either a single GCAUG or six copies of any of the secondary motifs tested drove percent spliced in (PSI) values of the exon to nearly 100% in the presence of exogenous RBFOX1 (Figure 4c).
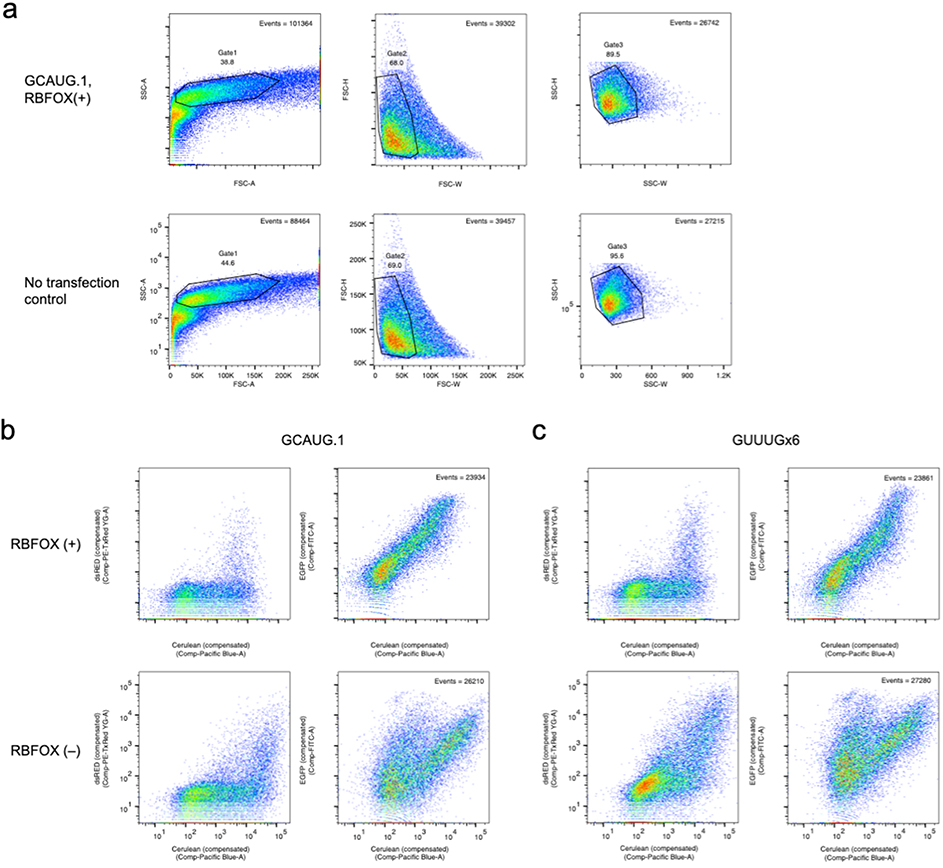
We observed similar effects of Rbfox protein expression by flow cytometry. Using Cerulean fluorescence to quantify exogenous RBFOX1 levels, and the EGFP:DsRED ratio to quantify exon inclusion, we could measure the relationship between RBFOX1 levels and exon inclusion driven by secondary motifs in single cells (Figure 4d, Extended Data Figure 5–6, Supplementary Table 5). Generally, six copies of any of the secondary motifs GCUUG, GAAUG, or GUUUG drove exon inclusion to about the same extent as a single copy of the primary motif GCAUG. At low levels of RBFOX1 expression (bins 1–2), all reporters exhibited exon inclusion similar to the GCAUG construct co-transfected with an empty Cerulean vector (GCAUG.1, Null), matching the RT-PCR results. As RBFOX1 expression increased, exon inclusion increased well above background for constructs containing either primary or secondary motifs, but failed to increase or increased modestly with control constructs. Across two replicates, exon inclusion was significantly more correlated with Rbfox expression when Rbfox primary or secondary motifs were present (Extended Data Figure 6b). Together, these observations demonstrate that secondary motifs can robustly regulate splicing, particularly when levels of Rbfox proteins are high.
Secondary motifs regulate splicing at specific stages of neuronal differentiation
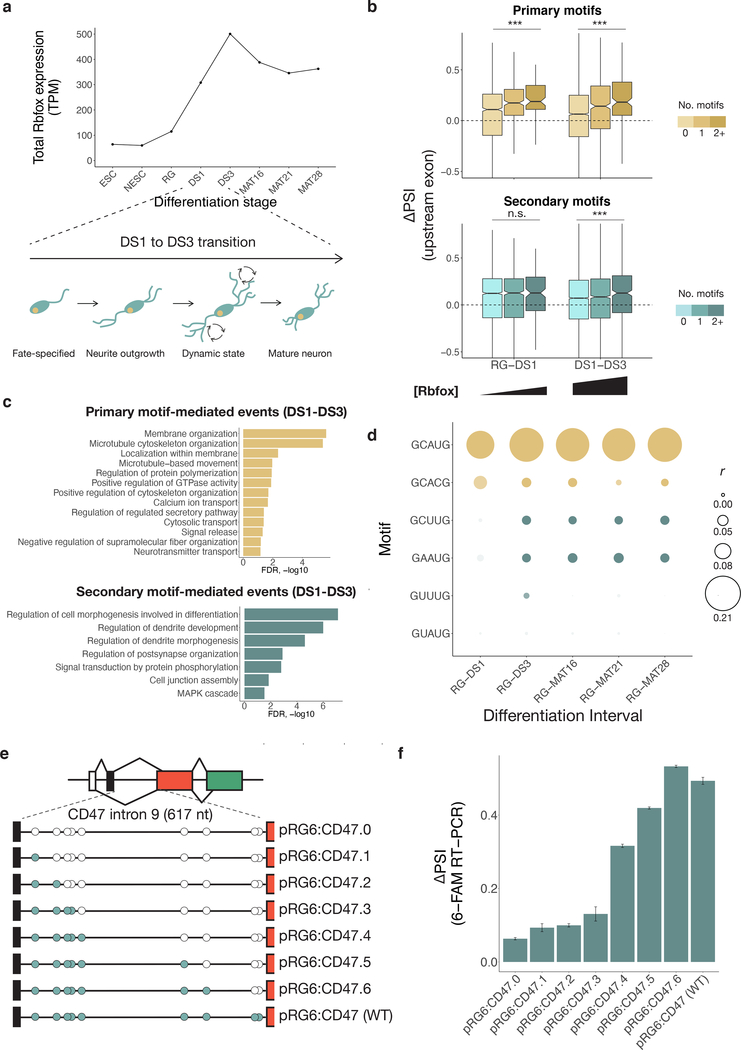
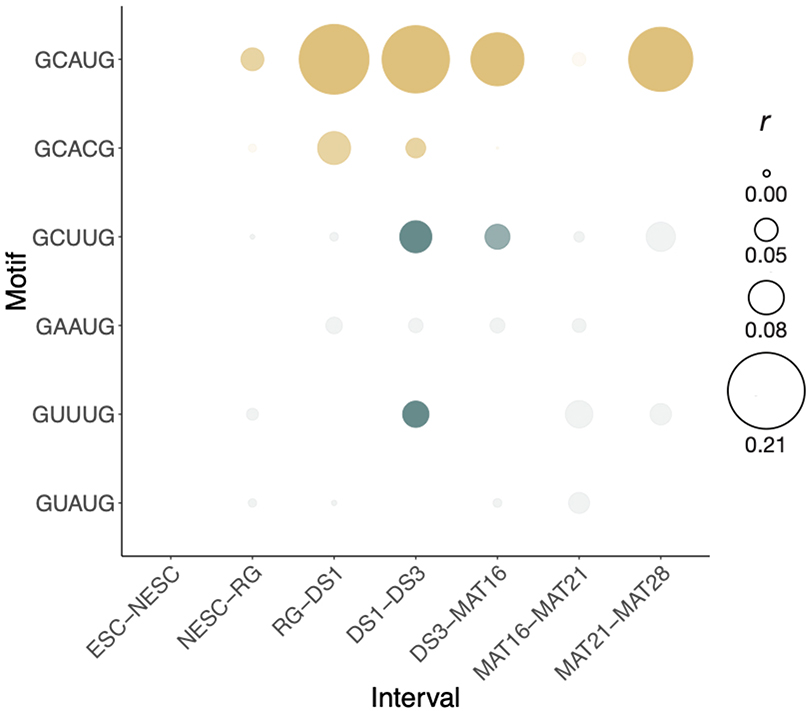
Given our observations that secondary motifs are most bound at high Rbfox concentrations, we examined neuronal differentiation, a process in which levels of Rbfox rise naturally. In an eight-stage time course of mESCs differentiating into glutamatergic neurons39, total Rbfox expression increases five-fold from the radial glia stage (RG) to developmental stage 3 (DS3) (Figure 5a). During this period, cells progress from a bipolar-shaped progenitor neuron (RG) to fate-specified developmental stage 1 (DS1) neurons, then to developmental stage 3 (DS3) over seven-days, and eventually become mature neurons after extensive growth and pruning of dendrites (Figure 5a). We examined the relationship between exon inclusion and presence of primary or secondary motifs in the first 250 nt of the downstream intron. We first examined the interval RG–DS1, where Rbfox increases from low to moderate expression, and then DS1–DS3, where Rbfox levels reach their highest point. For primary motifs GCAUG and GCACG, exon inclusion is significantly correlated with motif frequency at both intervals. However, the secondary motifs are correlated with exon inclusion only at the DS1–DS3 interval, suggesting that they are mostly active later, when Rbfox levels are higher (Figure 5b).
Figure 5. Secondary motifs enable splicing regulation at distinct concentration Rbfox concentration ranges in neuronal differentiation.
a. Total expression of Rbfox1, Rbfox2, and Rbfox3 in transcripts per million (TPM) based on RNA-seq during a neuronal differentiation time course39 (SRA PRJNA185305). b. Correlation of Rbfox primary (gold) and secondary (teal) motifs in the downstream intron with delta PSI at both low-moderate (RG-DS1) and moderate-high (DS1-DS3) transitions of Rbfox expression during in vitro neuronal differentiation. Increased color intensity represents 0, 1, or 2+ motifs in the downstream intron. Primary motifs, RG–DS1: 0 (n = 1521), 1 (n = 269), 2+ (n = 90), DS1–DS3: 0, (n = 3611), 1 (n = 596), 2+ (n = 171). Secondary motifs, RG–DS1: 0 (n = 2763), 1 (n = 838), 2+ (n = 159), DS1–DS3: 0, (n = 6461), 1 (n = 1882), 2+ (n = 413). The center line of the boxplot represents the median, lower and upper hinges the first and third quartiles, respectively, and whiskers extend to the smallest or largest value (at most 1.5*IQR (interquartile range) of the hinge. Outliers are not shown. Notches extend 1.58*IQR/sqrt(n), giving a roughly 95% confidence interval on the medians. *** P < 0.001 (two-sided Wilcoxon Rank-Sum). c. Gene Ontology categories of splicing events driven by primary motifs (n = 388) (top) and secondary motifs (n = 561) (bottom) during neuronal differentiation. Events were compared to all expressed genes at DS3 and terms were filtered for FDR < 0.1, B > 99, and b > 9. d. Correlation of Rbfox primary (gold) and secondary (teal) motifs throughout stages of neuronal differentiation subsequent to RG stage. Pearson correlation of secondary motif presence with delta PSI is shown at intervals of neuronal differentiation from radial glia stage to mature 28-day glutamatergic neurons. Events: RG–DS1 (n = 940), RG–DS3 (n = 3436), RG–MAT16 (n = 3860) RG–MAT21 (n = 3942) RG–MAT28 (n = 4119). Size of point indicates correlation coefficient, intensity indicates uncorrected p-value < 0.05. e. Reporter design of CD47 intron 10-containing RG6. All secondary motifs were ablated from the 617-nt intron and sequentially reintroduced into the reporter to examine the effects of individual secondary motifs. f. Mean percent spliced in (PSI) values of exons containing secondary motifs in the downstream intron after expression of Rbfox1. Error bars show SD of triplicate technical replicates.
In order to examine potential functions of splicing changes in the DS1–DS3 interval, we assessed the functions of genes whose splicing changed. For exons associated with primary Rbfox motifs (n=388), Gene Ontology analysis found enrichment for functions related to membrane and cytoskeletal organization, while exons associated with secondary motifs (n=561) were enriched for functions in dendrite development and signal transduction (Figure 5c). This distinction could reflect a regulatory program in which primary motifs mediate earlier splicing events related to neurite outgrowth and secondary motifs mediate a later wave of splicing changes related to dendrite development and signaling as Rbfox levels increase.
We next examined the correlation between motif count and difference in exon inclusion (delta PSI) across every interval of the time course (Extended Data Figure 7). The DS1–DS3 interval was the only interval in which secondary motif counts were significantly correlated with Rbfox activity, coincident with peaking of Rbfox expression. Examining intervals from RG to subsequent stages of the time course (Figure 5d), secondary motifs GCUUG and GAAUG had signal throughout the rest of the differentiation, while GUUUG had signal only at DS3, and GUAUG lacked detectable signal.
We identified mouse Cd47 exon 10 as a candidate target of Rbfox proteins likely mediated by secondary motifs in its downstream intron. CD47 is a plasma membrane protein with four known isoforms that encode variation in its intracytoplasmic tail44. Isoforms containing this exon are associated with memory retention in rats45, and CD47-deficient neurons have impaired axon and dendrite formation in development46.
Over the course of neuronal differentiation, CD47 exon 10 shows a 36% increase in inclusion from developmental stage 1 (DS1) to developmental stage 3 (DS3). The 617-base downstream intron contains 2 GCUUGs, 2 GAAUGs, and 4 GUUUGs. We replaced the RG6 intron with the natural sequence of the CD47 intron, mutating each secondary motif (Figure 5e, Supplementary Table 4). We successively re-introduced secondary motifs into the intron in 5’ to 3' order, measuring the effect of each additional secondary motif on the PSI value of the upstream exon. Restoration of the cluster of five motifs at the 5’ end of the intron gave a 19% increase in PSI for the upstream exon. Adding back a subsequent GUUUG and GAAUG yielded additional 10% and 11% increases in PSI, respectively, demonstrating that individual secondary motifs can act additively to trigger substantial increases in PSI (Figure 5f).
Rbfox expression-dependent splicing through secondary motifs across neuronal subtypes
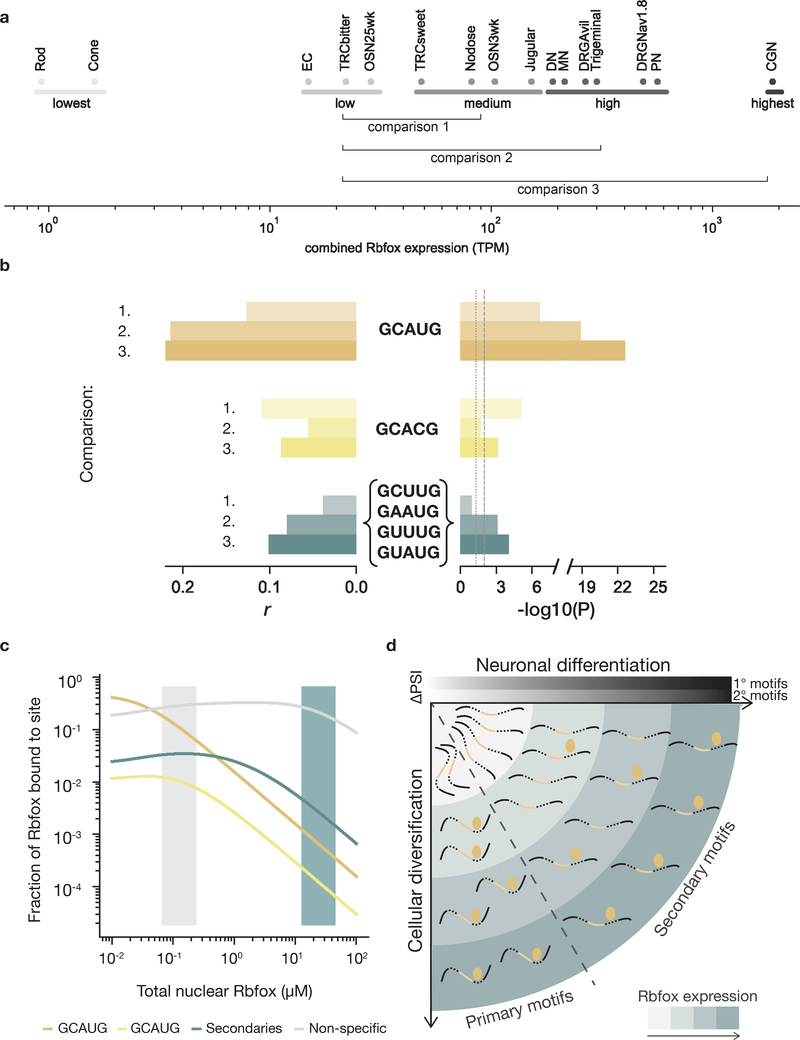
We next asked to what extent Rbfox contributes to diversification between differentiated neuronal cell types. We analyzed data from thirteen cell types that span almost three orders of magnitude of Rbfox gene expression, combining mRNA levels of Rbfox1, Rbfox2 and Rbfox34. Specifically, we compared mean differences in PSI between cell types grouped by their Rbfox expression from lowest (EC, TRCbitter, OSN25wk) to highest (CGN) (Figure 6a). We expected that the number of GCAUG motifs downstream of alternatively spliced exons should generally correlate with exon inclusion, whereas secondary motifs should contribute only in cell types with higher Rbfox expression. Indeed, we observed that downstream GCAUG motif count is significantly correlated with exon inclusion, even when comparing medium to low Rbfox expression (P < 0.0015), and is more strongly correlated when comparing high to medium (P < 1.3 × 10⁻¹⁹) and highest to low (P < 2.4 × 10⁻²³) (Figure 6b). Consistent with our previous results, the strongest secondary motifs together contribute significantly to increased exon inclusion in high (P < 7.7 × 10⁻⁴) and highest (P < 1.3 × 10⁻⁴) Rbfox-expressing cells compared to low-expressing cells. When comparing highest to low Rbfox-expressing cells, the slope of the regression predicts that, on average, each downstream GCAUG increases exon PSI by 15%, while each secondary motif elicits a 3.6% increase in PSI. Thus, in endogenous loci as in our reporter assays, the regulatory activity attributable to a single secondary motif is comparable to that conferred by a set of ~4 secondary motifs.
Figure 6. Secondary motifs are active in neuronal cell types with high Rbfox expression.
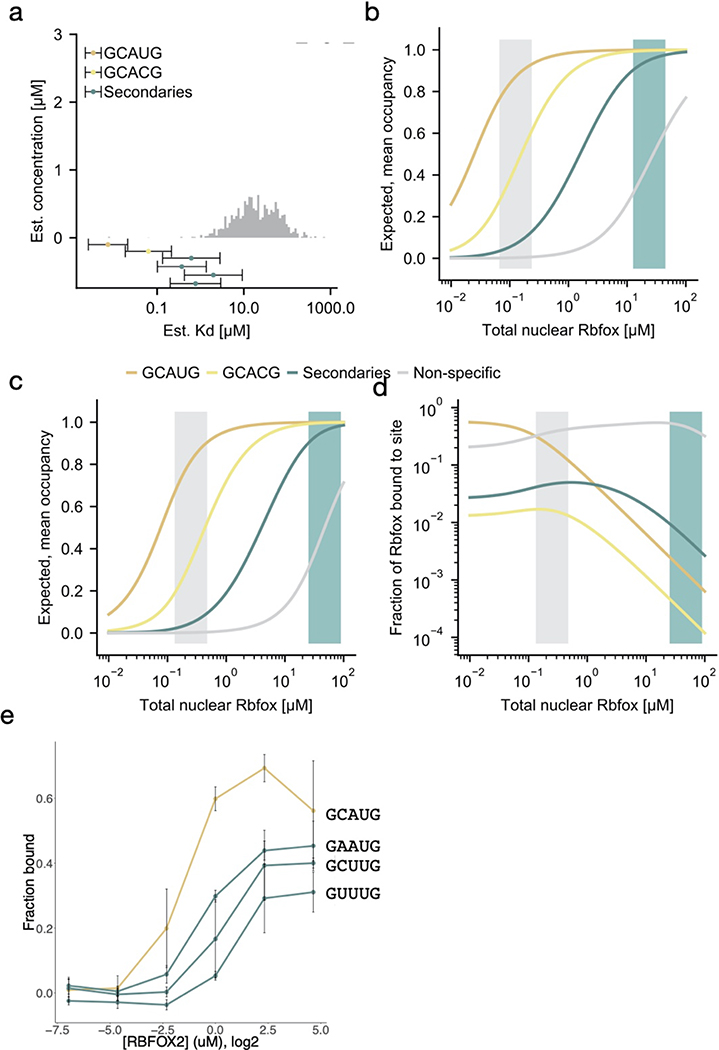
a. Differentiated neuronal cell types from Weyn-Vanhentenryck et al.4 (SRA SRP055008), arranged by combined Rbfox1, Rbfox2, and Rbfox3 expression (log10 of sum of RPKM values). Cell types were grouped into Lowest, Low, Medium, High, and Highest Rbfox expression categories. Cells analyzed: olfactory sensory neurons (OMP+) (OSN), enterochromaffin cells (EC), taste receptor cells (TRC), rod or cone photoreceptors, jugular or nodose visceral sensory ganglia, dopaminergic neurons (DN), motor neurons (MN), dorsal root ganglia sensory neurons (Nav1.8+ or Avil+) (DRG), trigeminal ganglia, Purkinje neurons (PN), and cerebellar granule neurons (CGN). b. Linear regression of 1,909 alternatively spliced exons comparing the Rbfox expression groups indicated in a. Horizontal bars represent the Pearson r value (left) and uncorrected significance (right) of the correlation between the number of occurrences of primary or secondary (GCUUG, GAAUG, GUUUG, and GUAUG) motifs and ΔPSI values between Medium and Low (1.), between High and Low (2.), or between Highest and Low (3.) Rbfox expression regimes. Grey dotted and dashed lines indicate 0.05 and 0.01 significance thresholds, respectively. c. An equilibrium model for Rbfox binding to intronic sequences in the nucleus at various expression levels of Rbfox (low, grey area; high, teal area). GCAUG indicated by gold, GCACG indicated by yellow, secondary motifs indicated in teal, non-specific 5mers in grey. d. Graphical summary of how Rbfox proteins (golden ellipses) regulate distinct splicing events at different expression levels (teal shading). Secondary motifs are functionally relevant only at higher Rbfox levels, occurring at later stages of neuronal differentiation or in cell types with high Rbfox expression, while primary motifs are functionally relevant at earlier stages and in cell types with medium as well as high Rbfox levels.
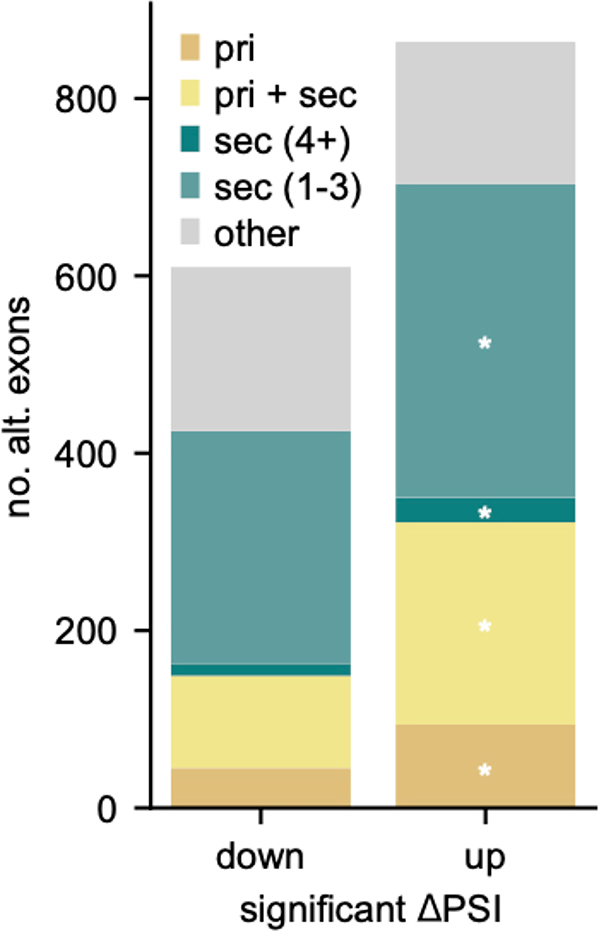
We examined 864 alternative exons with increased inclusion associated with Rbfox expression (Extended Data Figure 8). Of these, 11% had primary motifs, 26.4% had primary and secondary motifs, and 3.2% had at least 4 secondary motifs but no primary motif (2.2-fold enrichment, P < 0.0084, Fisher’s exact test). Even exons with one to three secondary motifs (n = 354) were 1.3-fold enriched in this set (P < 0.0012). This analysis supports that secondary motifs contribute to regulation of dozens of exons or more in neuronal subtypes with high Rbfox levels.
A quantitative model for Rbfox expression-dependent, differential motif activity
In order to better understand the distribution of Rbfox protein binding across the nuclear transcriptome, we built a quantitative equilibrium model (Extended Data Figures 9, 10). To illustrate the plausible range of RNA concentrations in the neuronal nucleus, we considered two scenarios: a large cell with lower RNA turnover and lower nuclear RNA concentration (Figure 6c, Extended Data Figure 10a,b) and a small cell with higher RNA turnover and nuclear RNA concentration (Extended Data Figure 10c,d) (Methods).
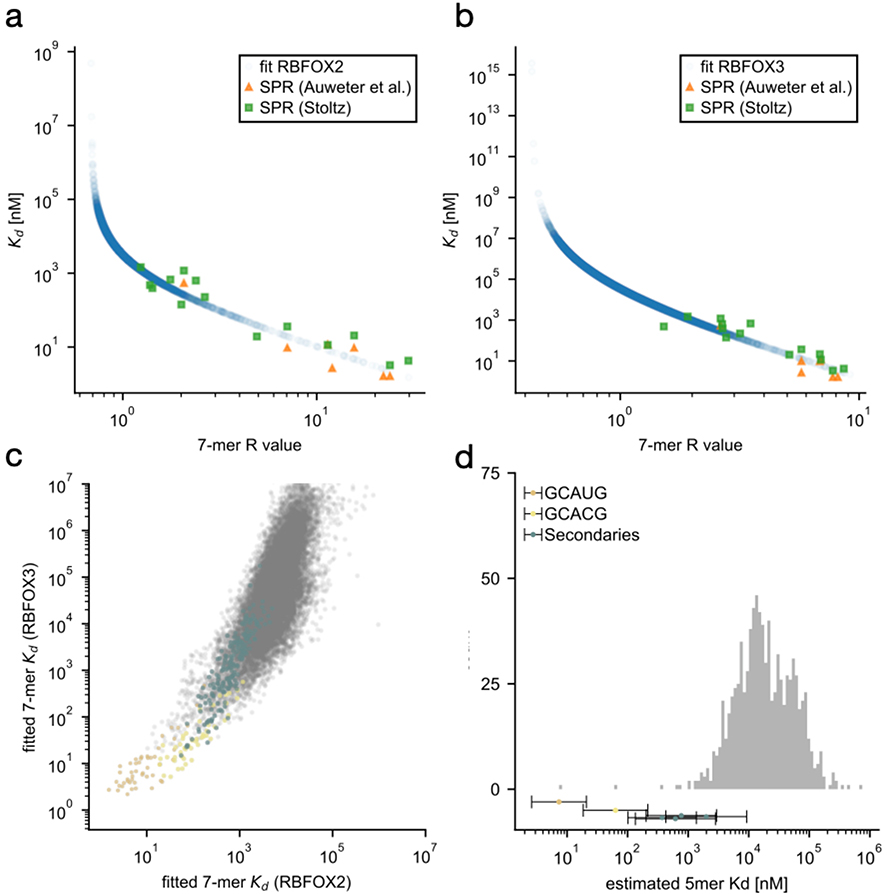
Using this model, we estimated the aggregate concentration of neuronal intronic RNA 5mers as between ~14 and 56 μM (Methods). Of this total, the concentration of GCAUG will fall between ~16 to 63 nM, with GCACG five-fold lower (3–12 nM), and the four secondary motifs together occurring at several-fold higher concentration (67 to 270 nM) (Extended Data Figure 10a). After assigning approximate dissociation constants to all Rbfox 5mer motif variants by calibrating our random RBNS data for human RBFOX2 and RBFOX326 to SPR data29 (Extended Data Figure 9, Supplementary Table 6), we modeled the equilibrium distribution of Rbfox proteins across the pool of nuclear binding sites, analogous to a previous model for miRNAs in the cytoplasm47, as a function of nuclear Rbfox concentration (Figure 6c). Next, we estimated the nuclear Rbfox concentration from the range of Rbfox mRNA expression across neuronal cells (Figure 6a), extrapolating from the mRNA expression, using proteins-per-mRNA ratios of 2,800–10,000, in line with reported protein:mRNA ratio for Rbfox in cell lines48,49. The model indicates that, in cells with low to intermediate Rbfox expression, 20% to 40% of Rbfox is recruited to primary motifs, even though they represent a small fraction of the available RNA pool. On the other hand, at very high Rbfox expression, the primary motifs become saturated (because of their high affinity and low abundance) and a larger fraction of Rbfox protein occupies secondary motifs (Figure 6c, Extended Data Figure 10d). We estimate that individual instances of secondary motifs reach ~50% occupancy at nuclear Rbfox concentrations between 10 and 50 μM (Extended Data Figure 10b,c).
To support this model, we performed filter binding experiments wherein radiolabeled primary (GCAUG) or secondary (GCUUG, GAAUG, GUUUG) motifs in three copies were co-incubated with RBFOX2 and unlabeled, single-copy GCAUG at increasing protein concentrations (Extended Data Figure 10f). As predicted, the fraction bound increased for both primary and secondary motifs, with increases occurring at somewhat higher protein concentrations for secondary motifs, mimicking the modeled scenario in which secondary motifs are preferentially bound after saturation of primary motifs. We conclude that the secondary motifs identified here contribute to regulation under physiological conditions, with greatest activity at high nuclear concentrations of Rbfox proteins (Figure 6d).
Discussion
We show that Rbfox family proteins bind a defined, abundant set of secondary motifs in vitro and in vivo. These motifs enable concentration-dependent regulation of exon inclusion by Rbfox in neuronal differentiation and diversification, adding a second wave of regulation in cells that with high Rbfox expression. The mediation of temporally-staged and cell-type-specific activity by secondary motifs has rarely been reported for RBPs50,51, but may be widespread.
Examples of spatial and temporal regulation via secondary motifs have been described for several transcription factors (TFs). The C. elegans TF PHA-4 activates its primary motif target in early pharyngeal development, while its secondary targets are activated later, when protein levels are higher52. In mice, PREP1 activates its enhancers sequentially, according to their affinity, during eye lens development53, and suboptimal motifs for the GATA and FGF families of TFs enable tissue-specific expression in tunicates54. At the genomic level, a Bayesian biophysical model that considered binding to both high- and low-affinity sites better predicted gene expression in human cells, supporting the importance of low-affinity sites to regulation55.
The Rbfox secondary motifs identified in this paper likely represent a combination of the strongest-binding and most frequently-occurring secondary motifs across a continuum of related sequences that bind RBFOX with varying affinity. One feature of the RBNS natural sequence assay, as opposed to a random sequence RBNS experiment (or SELEX), is that its sequence composition and oligonucleotide length aids in the discovery of motifs that appear frequently in the transcriptome in arrangements compatible with binding. Therefore, while the discovered motifs may not represent all of those with highest affinity, they should tend to be those with largest transcriptome-wide regulatory effects. As an in vitro assay, nsRBNS in its current form does not capture the native protein environment of the cell, with interacting proteins and modifications, for example, but is a straightforward method to determine the spectrum of protein binding to cellular sequences.
Though variant motifs have occasionally been noted in other Rbfox studies, many go on to filter out sequences lacking GCAUG from their datasets8–10,12–14,34. In some cases, binding of secondary motifs has been attributed to other proteins, e.g., presence of GUGUG in Rbfox CLIP peaks has been attributed to binding by SUP-1232 or HNRNP M of the LASR complex33. The potential for direct binding of GUGUG motifs by Rbfox proteins should also be considered. Our finding that secondary motifs exert regulatory activity only in cell types with high Rbfox levels may explain varying enrichments of primary and secondary motifs among CLIP data derived from different cell lines8,14,33.
Suboptimal motifs may function in different ways. First, they may enhance binding to nearby primary motifs. Second, a cluster of several secondary motifs may create a stretch of sequence with total Rbfox binding comparable to that of a high-affinity motif. Consistent with this idea, we observed increased binding to oligonucleotides with larger numbers of secondary motifs in nsRBNS, and found evidence that 4–6 copies of a secondary motif can enhance exon inclusion to an extent comparable to that of a single GCAUG motif in vivo. Third, these motifs can introduce more subtle changes in exon splicing, as we saw for CD47, or incrementally tune splicing over evolutionary time. Lastly, suboptimal cis-regulatory elements may function only at high levels of a trans-factor to narrow the temporal or spatial scope of activity, a phenomenon we observed for Rbfox regulation in cellular differentiation and diversification.
Our study argues that it is time to reconsider the simplifying dichotomy of “binding site” versus “non-binding site” and to start incorporating site affinities as well as motif transcriptomic frequencies, extending consideration to abundant sites of lower affinity when RBP activity is high56. For Rbfox family proteins, we demonstrate that secondary motifs contribute significantly to Rbfox-dependent gene regulation, with their modest affinity enabling highly cell- and stage-specific regulation. This behavior could also be relevant in regimes of high local protein concentration. For instance, Rbfox and other RBPs are associated with phase-separated compartments, which rely on multivalent protein and RNA interactions to form;22,57,58 secondary motifs will have increasing significance as our understanding of such subcellular environments deepens.
Methods
Cloning, expression, and purification of RBFOX2
The RRM domain of RBFOX2 (amino acids 100–194) was cloned into the pGEX6P-1 expression vector (GE Healthcare, 28–9546-48) downstream of a GST-SBP tandem affinity tag. Following 12 hr recombinant expression in Rosetta Competent Cells (Millipore, #70954) at 12°C with ampicillin and chloramphenicol selection, the protein was expressed by addition of IPTG and purified via the GST tag as described previously26,28,38.
Library design of natural 3' UTR sequences
GENCODE59-annotated human transcripts were evaluated for presence of appropriate start codon and stop codon sequences at the corresponding GENCODE-annotated positions. Coding genes that had a 3' UTR between 100 and 10,000 bp were considered for library inclusion. For the H. sapiens library, 120 transcript pairs were included because of evidence of alternative 3' UTRs, 720 transcripts were selected based on expression level of >10 fragments per kilobase million (FPKM) in both HepG2 and K562 cell lines, and 360 other transcripts were selected at random. Each of the resulting transcripts was assigned a homologous M. musculus transcript by identifying a transcript in the homologous M. musculus gene in which the annotated polyA tail was ±150 nt from the location of the homologous H. sapiens polyA tail site, as identified by Batch Coordinate Conversion (liftOver, UCSC Genome). This procedure generated 1108 H. sapiens 3' UTRs paired with 1104 M. musculus 3' UTRs. Each 3' UTR sequence was then split into overlapping 110 nt segments at 43 nt intervals to achieve approximately 2.5X coverage of each 3' UTR, yielding 64,319 unique sequences.
Natural sequence RNA Bind-n-Seq procedure and analysis
The 64,319-oligonucleotide library was synthesized by Twist Biosciences and nsRBNS was performed as previously described26,28,38. Briefly: Library was amplified with Phusion Polymerase (NEB, #E0553L, primers below, Integrated DNA Technologies (IDT)), in vitro-transcribed, treated with Turbo DNase (Thermofisher, #AM2238), and gel- and phenol:chloroform:isoamyl alcohol-purified. Streptavidin T1 magnetic beads (Invitrogen, #65601) and 250 nM of the prepared library was incubated with recombinant, tagged RBFOX2 at concentrations of 0 (no protein control), 4, 14, 43, 121 (2 replicates), 365, and 1100 nM for 1 hr at 4° C to equilibrium binding in binding buffer (25 mM Tris, 150 mM KCl, 0.1% Tween, 0.5 mg/ml BSA, 3 mM MgCl2, 1 mM DTT, pH 7.5). RBP:RNA:bead complexes were pulled down with a magnet and washed gently twice with wash buffer (25 mM Tris, 150 mM KCl, 0.1% Tween, 0.5 mM EDTA, pH 7.5). RNA was eluted by two separate incubations with 4 mM biotin (pH 7.5) for 30 min at room temperature. RNA eluate was purified with Ampure beads (Beckman Coulter, #A63987), and the resulting RNA was reverse transcribed with Superscript III (Thermofisher, #18080093). The cDNA was amplified for 6–16 cycles with Phusion Polymerase (NEB, #E0553L) and gel-purified with ZymoClean Gel DNA Recovery Kit (Genesee Scientific, #11–300C) to produce the final library. Each library was sequenced single-end on an Illumina HiSeq 2500 instrument. Sequences with at least 100 associated reads in the input sample were considered for further analysis. Read counts in each sample were normalized by the total reads in that sample. To produce enrichment (R) values at the single-oligonucleotide level, normalized reads for an oligonucleotide in a given sample were divided by the normalized reads for that oligonucleotide in the 0 nM control sample. In general, sequences enriched at an R value of 1.1 (10% enrichment) were considered “bound”.
Replicates of nsRBNS performed with different in vitro transcriptions and on different days correlate at r > 0.9, although there is variability at finer intervals of R values. To reduce technical noise, we have found that it is important to keep the number of PCR cycles after RNA pulldown as close as possible across both experiments and samples. For example, the 0 nM control for the first 121 nM experiment was cycled 9X, while the second was cycled 16X, which may have caused variation due to different amplification biases, expected to be more pronounced for lowly enriched motifs. Approximately 2,700 oligonucleotides had R ≥ 2.0 in these experiments, with an estimated FDR of 20% at this cutoff.
PhyloP scores
Plus-strand hg19 46-way alignment phyloP60 scores were obtained for each genomic position from the UCSC genome database. Hg19 46-way alignment scores are not strand-symmetric (https://genome.cshlp.org/content/suppl/2009/10/27/gr.097857.109.DC1/supplement.pdf, S2.6), and minus-strand scores are thus inappropriate to include in transcriptomic analyses and were excluded. For meta-phyloP scores, all scores for the sequence GCAUG were averaged at each base in 3' UTRs and shallow introns (+250 bases) and normalized to the average phyloP score of the 5mer.
Identification of secondary motifs by iterative kmer analysis
Initial 5mer enrichments were determined by generating five-base sequences from the 3' UTR regions of each valid oligonucleotide in a 0 nM and pulldown experiment. 5mer enrichment values were then determined by dividing the normalized count of a particular 5mer in the pulldown by the normalized counts of the 5mer in the 0 nM experiment. Of the 1024 5mers, GCAUG had the highest R value. To identify other sequences that influence binding, we took an iterative approach in which all oligonucleotides containing the highest R value 5mer were removed from consideration, and enrichments for all other 5mers were regenerated from this set. Following identification of the primary motifs (GCAUG, GCACG) in the 1.1 μM experiment, the top 5mer in each subsequent iteration was considered a secondary motif (GUUUG, GAAUG, UUUUU, UGCAU, AAAAA, GUAUG, GCUUG). After four iterations, there was insufficient power to continue the iterative method with ~18,000 of ~64,000 sequences remaining. All remaining 5mers of the format GNNUG, NGCAU, or W5 that had R value two standard deviations above the mean were considered secondary motifs (GCCUG, GCCUG, CGCAU, AGCAU, AUAUA, UAUAU).
Filter binding
23-base oligonucleotides with three copies of motifs of interest spaced by two random bases (IDT, Supplementary Table 3) were in vitro-transcribed as above and 5’ dephosphorylated with Calf Intestinal Phosphatase (NEB, #M0290) according to manufacturer’s protocol and phenol:chloroform:isoamyl alcohol-purified. ~120 ng RNA was radiolabeled with T4 Polynucleotide Kinase (NEB, #M0201L) and 2 mCi [γ−32P]-ATP (PerkinElmer). Unincorporated [γ−32P]-ATP were removed with illustra Microspin G-25 Columns (GE Life Sciences, #27532501). RBFOX2 was purified as above and buffer exchanged using a Zeba Spin Desalting Column (7K MWCO, 0.5mL, Thermofisher, #89882). 20uL reactions were prepared in 96-well plates with binding buffer (10% glycerol, 25nM Tris, 150mM KCl, 0.1mg/mL BSA, 1mM MgCl2, 1mM DTT, pH 7.5), 1–5nM radiolabeled RNA, and six concentrations of protein: 25uM, 5uM, 1uM, 200nM, 40nM, and 8nM. After 1h incubation at RT, 10uL of the reactions were applied to pre-soaked (wash buffer, 25nM Tris, 150mM KCl, 1mM MgCl2, pH 7.5) stacked 0.45 μm nitrocellulose (Thermofisher, #77010) and nylon (Amersham Hybond-XL, GE Life Sciences, #RPN303S) in a 96-well Bio-Dot vacuum apparatus (Bio-Rad, #RPN303S) on low vacuum. Reactions were immediately washed with 100μL wash buffer. Blots were exposed on a phosphor screen (GE Healthcare) and imaged on a Typhoon FLA 9500 (GE Healthcare). Fraction bound was quantified using ImageJ software. For competition filter binding experiments in Extended Data Figure 10, roughly equimolar unlabeled, single copy GCAUG was additionally added to each reaction and assay was otherwise as above. For these experiments, due to an increased background with the higher concentration of RNA, the poly-U control values were subtracted from our measurements.
eCLIP peak enrichment and iCLIP metaplot analyses
eCLIP enrichment values were produced from significant RBFOX2 eCLIP read peaks in HepG2 cells obtained from the ENCODE Project Consortium40. RBFOX2-pulldown peak densities were normalized to a no-protein input control to produce enrichment values roughly analogous to nsRBNS R values to facilitate comparisons between the two assays.
RBFOX2 individual nucleotide crosslinking and immunoprecipitation (iCLIP data) from mouse embryonic stem cells27 was analyzed at RBFOX secondary motif sites. Adapters and barcodes were trimmed prior to mapping with STAR to the mm10 genome following standard ENCODE guidelines (http://labshare.cshl.edu/shares/gingeraslab/www-data/dobin/STAR/STAR.posix/doc/STARmanual.pdf, page 7). Duplicate PCR reads were removed from the mapped reads to generate final reads. These reads were aligned in a metaplot centering on all possible 5mers to visualize an iCLIP meta-peak. Peak height was quantified with a CLIP enrichment (CE) score centered on position 1 of the 5mer. For 3' UTR peaks, the CE score was calculated as the sum of the read coverage between positions 10 to 15 divided by the sum of the read coverage between positions –85 to –80. For the intronic peaks, the CE score was calculated by the read coverage between positions 5 and 10 divided by the read coverage at positions −85 to −80. The ranges differed between 3' UTR and intronic peaks due to different maximum peak heights in these regions; the maximum range was chosen for each region. Control scores were produced using an untagged RBFOX2 protein with identical data processing; these background reads were subtracted from the metaplots and CE scores to eliminate iCLIP noise. Total base-read counts per regions were 1) 3' UTR: nGCAUG = 8296148, nGCACG = 914837, nGCUUG = 3876531, nGAAUG = 3529113, nGUUUG = 6172128, nGUAUG = 3482546, nGUGUG = 8735260, nGCCUG = 5432910, nUUAUG = 3954351, nAUAUG = 3142196, nGUAUU = 4395833, nGUAUA = 3092874; 2) Intronic: nGCAUG = 10538122, nGCACG = 1316449, nGCUUG = 3649606, nGAAUG = 2319706, nGUUUG = 4261360, nGUAUG = 2624047, nGUGUG = 7388214, nGCCUG = 5971647, nUUAUG = 2503772, nAUAUG = 2051322, nGUAUU = 2194441, nGUAUA = 1675246.
HiTS-CLIP motif enrichment
Two RBFOX1 HiTS-CLIP8,14 datasets, in mouse whole brain and differentiated mature neurons, respectively, were analyzed for the presence of secondary motifs. Both datasets were mapped with STAR after removing duplicate reads following ENCODE guidelines, except for requiring mapped reads to be completely unique (--outFilterMultimapNmax 1). For the Jacko et al.8 data, read length was relaxed to accommodate the slightly shorter average HiTS-CLIP read length (--outFilterMatchNminOverLread 0.33). Mapped reads were then processed into CLIP peaks using CLIPper with standard specifications. For each dataset, only peaks shared between two replicates were considered in subsequent analyses. Additionally, only peaks in 3' UTRs and shallow (splice site-proximal) regions of introns were analyzed. For each CLIPper peak, a region ±50 from the reported peak apex was analyzed for the frequencies of all possible 5mers to report a total 5mer frequency for each dataset analyzed. 5mer frequencies in CLIPper regions were normalized to the total 5mer frequencies in either 3' UTRs and shallow introns to generate 5mer enrichments. To analyze the enrichments of peaks containing primary, primary and secondary, or secondary motifs, a peak with one of these motifs in the 100-base region was considered to contain the motif. A minimum of two secondary motifs was required in this analysis to adjust for the higher frequency of these motifs in the transcriptome. To assess signal over background for these groups, artificial 100-base intervals derived from 3' UTRs and shallow introns, respectively, were analyzed identically and frequencies were compared.
Splicing reporter assay
We cloned primary and secondary Rbfox motifs GCAUG.1, GCAUG.2, GCUUGx6, GAAUGx6, or GUUUGx6 250 bases downstream of the alternative exon of the RG6 splicing reporter43 (see sequences below, with altered nucleotides in capitals) using custom-designed oligonucleotides (IDT) with InFusion cloning (Takara Bio #638920) in HEK293T cells. The GFP of a pEGFP rbFOX1 plasmid (Addgene #63085) was replaced with Cerulean (Cerulean-N1 Addgene #54742) to produce a Cerulean:Rbfox1 vector. The downstream Rbfox1 was also removed to produce a Cerulean:NULL control plasmid (see Supplementary Table 4). A far-downstream GCAUG endogenous to the plasmid was included in all plasmids.
We also introduced variation on a natural intron, mouse CD47 intron 9, into the RG6 plasmid. A wild-type and secondary motif-null construct were synthesized with GeneWiz FragmentGene, and sequential mutations in or restorations of secondary motifs were introduced using the QuickChange Lightning Multi Kit (Agilent, #210515) and custom-designed oligonucleotides (IDT) to produce a series of introns with increasing numbers of secondary motifs in the intron (see Supplementary Table 4, with altered nucleotides in capitals).
100 ng of RG6 construct and 300 ng of Cerulean:Rbfox or Cerulean:NULL were co-transfected into HEK293T cells in a 24-well plate with 1 uL of lipofectamine. Transfected cells were harvested after 24h. The cells were washed twice with 2 mL PBS and RNA was extracted using the Qiagen RNAeasy Kit (#74104). Three replicates of each condition were subjected to fluorescent PCR with a FAM-labelled forward primer (below) and with Phusion polymerase (NEB #M0530S) for 32 cycles. The product was imaged on a Typhoon FLA 9500 (GE Healthcare). Resultant bands were quantified using ImageJ to produce relative Percent Spliced In (PSI) values.
Flow cytometry and data processing
400 ng of RG6 construct, 400 ng of Cerulean:Rbfox or Cerulean:NULL was transfected into HEK293T cells in a 24-well plate with 4 uL of lipofectamine. Transfected HEK293T cells were harvested after 48 hours of transfection in 6-well plates, with 106 cells per well. After the media was removed, cells were gently washed in 1 mL PBS, and then resuspended into 1 mL ice-cold PBS with 1% BSA and 2 mM EDTA. Cell suspensions were collected into test tubes through a single-cell strainer (Fisher Scientific; Corning Falcon #352235) on ice. Flow cytometry was carried out with the LSR II flow cytometer (BD Biosciences), with the 405 nm laser and 450/50 nm filter for Cerulean, 488 nm laser and 515/20 nm filter for EGFP, and 561 nm laser and 610/20 nm filter for dsRED. A total of 30,000 events from single, live cells were acquired for each treatment set, and processed using the FlowJo software. Minor channel spillover between EGFP and Cerulean was compensated using single-fluorophore controls.
Cerulean signal was normalized by dividing over the median Cerulean signal of the no-plasmid control, to account for background fluorescence. To only include cells with at least one copy of both plasmids transfected, we used the 99th percentile of the signal from the three respective fluorophores in the no-plasmid control as the thresholds, and filtered for events with Cerulean above threshold, and with EGFP and/or dsRED above threshold. Events with EGFP or Cerulean signal above 104.5, or dsRED signal above 103.2, were discarded due to signal anomaly near the detector saturation limit. Events were sorted into bins by log2-transformed normalized Cerulean signal, dividing at 2.2, 3.0, 4.5, 6.0, and 7.5, to obtain six bins with generally similar number of events each. Log2-transformed ratio of EGFP signal to dsRED signal was used as the readout for the splicing ratio. Boxplots were visualized using ggplot2 (geom_boxplot). The center line represents the median, lower and upper hinges the first and third quartiles, respectively, and whiskers extend to the smallest or largest value (at most 1.5*IQR (interquartile range) of the hinge. Outliers are not shown. Notches extend 1.58*IQR/sqrt(n), giving a roughly 95% confidence interval on the medians. Bin numbers in Supplementary Table 5.
Cell Lines
HEK293T-A2 were obtained courtesy from the Eugene Makeyev Lab at Nanyang Technological University, Singapore. Cells were tested for mycoplasma by PCR. Cells were not authenticated.
Neuronal differentiation analysis
Using a deep transcriptomic sequencing dataset characterizing neuronal differentiation from mouse embryonic stem cells (mESCs) to glutamatergic neurons39, we examined the use of Rbfox primary and secondary motifs in neuronal differentiation. Each of eight (ESC, NESC, RG, DS1, DS3, MAT16, MAT21, MAT28) time points was analyzed for total Rbfox (Rbfox1, Rbfox2, Rbfox3) expression using kallisto61 with standard parameters. Splicing events were analyzed with rMATS.4.0.262 using standard specifications between the radial glia (RG) stage and all subsequent events (e.g. RG–DS1, RG–DS3, RG–MAT16, etc.) as well as between each interval (e.g. ESC–NESC, NESC–RG, RG–DS1, etc.). For all significantly changing cassette exons (FDR < 0.1), the secondary motif content of the first 250 bases of the downstream intron was computed and correlated with the magnitude of the inclusion of the upstream exon as reported by rMATS. Boxplots were visualized using ggplot2 (geom_boxplot). The center line represents the median, lower and upper hinges the first and third quartiles, respectively, and whiskers extend to the smallest or largest value (at most 1.5*IQR (interquartile range) of the hinge. Outliers are not shown. Notches extend 1.58*IQR/sqrt(n), giving a roughly 95% confidence interval on the medians.
Gene Ontology
Genes regulated exclusively by primary motifs (primary motif-mediated) or secondary motifs (secondary motif-mediated) in the 250 nt of the intron downstream of an exon increasing in inclusion from DS1 to DS3 were subjected to Gene Ontology analysis with GOrilla63,64. Results were then filtered by FDR < 0.1, B > 99, and b > 9. Background genes were all genes expressed >1 transcript per million (TPM) in DS3 as assessed by kallisto61.
Linear regression analysis of motif frequency and alternative splicing
Starting from a table with PSI values for 1,909 alternative exons regulated in neuronal cells and a list of RBP expression values (courtesy of the Chaolin Zhang lab, Columbia University), underlying data4, cell types were grouped by the sum of Rbfox1, Rbfox2, and Rbfox3 expression values. For each group of cell types, the arithmetic mean of PSI values was computed, from which followed a ΔPSI value for changes in exon inclusion between Low and Medium, Medium and High, and Medium and Highest Rbfox-expressing cells. Next, for each alternative exon, the intronic sequences 8nt to 250 nt downstream of the exon were scanned for the presence of Rbfox motif 5mers. Then, for each vector of ΔPSI values across all exons, linear regression was performed with the number of Rbfox motif occurrences as explanatory variable (using the python scipy.stats.linregress function of the scipy package65). The resulting P-values and r values were plotted using matplotlib66.
Furthermore, PSI values were converted to logit scores by computing logit(PSI) = log2 PSI/(1-PSI) after replacing 1 with 0.999 and 0 with 0.001 to avoid infinities. A regression was then performed to find optimal loadings for each considered primary and secondary motif, as well as scrambled negative control motifs, to explain the PSI values observed at high Rbfox expression, as a function of the PSI values observed at low Rbfox concentration and a linear combination of motif loadings for motifs present in the considered region of the downstream intron (see above), after the mean trend had been subtracted.
Briefly, we predicted
with
where M is the matrix of occurrences of motif j for each alternative exon I, and <ΔPSI>=<PSI2 – PSI1> the mean change in exon inclusion across all alternative exons. The regression then computed optimal motif weight fj to minimize the squared difference between predicted and observed PSI:
Exons with no primary or secondary motifs in the downstream intron +8 to +250 window were dropped from the regression. We performed this regression on 1,000 bootstraps of the alternative exon set (random sampling with replacement) to assess the robustness of the resulting motif loadings.
RBNS calibration to surface plasmon resonance (SPR) database
We computed RBFOX2 and RBFOX3 7-mer enrichments from RNA Bind-n-Seq (RBNS) experiments performed with 1.1 and 1.3 μΜ respectively26,28. These R-values should directly track with the occupancy of RBFOX protein, but also contain a contribution from non-specific sequences, either captured through the apparatus or due to the fact that 20 nt and 40 nt random sequences were used rather than 7mers (see Lambert et al. 201428 for a discussion). We therefore estimated the R-value of non-specific 7mers Rns from the bottom percentile of R-values and derived corrected R-values as R’ = R + Rns * (R – 1)/(1 – Rns). The corrected R-values display a higher dynamic range and provide a slightly better fit to SPR reference affinities (not shown). The results change only marginally if Rns is estimated from other percentiles (5 or 10, not shown).
Next, we compiled a list of dissociation constants for 22 7mer sequences binding to RBFOX1, measured via SPR from Auweter et al.41 and Stoltz29. We then used the scipy.stats.linregress function to find an optimal linear relationship between log(R’) and log(Kd) for these sequences. We then extended the linear interpolation to all 7mer R’ values to assign approximate dissociation constants. The two experimental replicates (with RBFOX2 and RBFOX3, using 20 nt and 40 nt random sequences) yielded highly correlated results (Extended Data Figure 10c). We then computed average 5mer dissociation constants as Kd5 = exp( <log(Kd7)>), where < … > denotes the arithmetic mean over all 7mers containing the 5mer of interest, and across both calibrated data sets for RBFOX2 and RBFOX3. Values obtained by subtracting or adding one standard error of the mean were used to estimate the error bars. In the affinity histogram (Extended Data Figure 10d), non-primary or secondary 5mers containing partial primary motifs (GCA, AUG, and ACG) were masked, because RBNS R values are always contaminated by the enrichment of kmers that overlap authentic high affinity motifs but are not necessarily directly bound (see Lambert et al. 201428).
Estimation of the intronic sequence content of the nucleus
Common estimates for total mRNA copy numbers per cell range from 100,000 to 1,000,000 molecules per mammalian cell (consistent with 0.1 to 1 pg of mRNA per cell) (BioNumbers.org ID 111220). This is in line with previously estimated mRNA copy number from human CA1 pyramidal neurons (~1,000,000) and the smaller cell body size of mouse pyramidal neurons67,68. To arrive at a rough estimate of how much intronic RNA is made, we therefore convert the estimated average half-life time of mRNA molecules of Th = 5 to 10 hours into a rate kdeg = log(2)/Th and assume that mRNA decay is balanced by new mRNA production (BioNumbers.org ID 106378, 104747), consistent with measured mRNA half-lives for mouse embryonic stem cells treated with RA and LIF withdrawal69. We thus considered two scenarios that span the anticipated range of RNA concentrations based on these estimates: a small cell (concentrated RNA) scenario with 100,000 mRNAs in a cell volume of 500 μm3 with Th = 5 h; and a large cell (dilute RNA) scenario with 1,000,000 mRNAs in a cell volume of 10,000 μm3 with Th = 10 h, with the cell sizes estimated using a rodent neuron (BioNumbers.org ID 112112, ID 106320). We further assume that the nucleus comprises ~10% of the cell’s volume, and that effectively 70% of that volume is available for the diffusion of intronic RNA and Rbfox proteins (subtracting nucleolus and chromatin). Our findings are not dependent on these exact values.
By iterating over the catalog of mouse transcripts expressed in differentiating mouse neurons39 (gencode M97) and weighting each encountered intron with the RNA-seq-derived TPM (transcripts per million) expression value for the harboring transcript (using kallisto61) we thus estimate the amount of intronic sequence being transcribed per minute. Assuming an average intronic half-life time of 1 minute, we conclude that, on average a mouse neuronal cell nucleus may harbor between 1.2 and 6 million intronic 5mer sequences that could represent potential protein binding sites. Using the same TPM-weighting scheme, we then compute the share of this total nuclear, intronic 5mer concentration allotted to each 5mer.
With a given estimate of total cellular mRNA copy number, TPM values correspond directly to cellular mRNA copies/cell. To estimate how many protein molecules are present per mRNA copy, we investigated Schwanhäusser et al. 201148 who report ~10,800 proteins/mRNA for Rbm9 (aka Rbfox2) in NIH 3T3 cells and a median of ~2,800 proteins/mRNA across all proteins. Li et al. 201470 (BioNumbers.org ID 110236) suggest that this might be an underestimate and place the median at 9,800 proteins/mRNA. We also investigated Wiśniewski et al.49 who report ~74,000 copies of Rbfox protein per A549 cell. Combined with mRNA expression data from the EBI Gene Expression Atlas (E-MTAB-4729) of 37 TPM and an estimated mRNA count of 300,000 mRNAs per cell, this yields an estimated ratio of 6,700 proteins/mRNA. We therefore consider the range between 2,800 (a lower estimate for the median across all proteins) as a reasonable lower bound for Rbfox and 10,000 (reported by Schwannhaeuser for 3T3 cells) as reasonable Rbfox protein to mRNA ratio, while assuming that the bulk of Rbfox protein is nuclear. This range reflects the shaded areas in Figure 6c corresponding to low Rbfox expression (10 TPM) and the highest Rbfox expression (1,900 TPM) observed among the neuronal cell types.
Equilibrium model for protein binding to a diverse pool of binding sites
We follow the procedure employed in Jens and Rajewsky47 for miRNA binding sites. Briefly, in equilibrium, within a well-mixed compartment, every potential binding site interacts with the same pool of free (unbound) protein [Pfree]. Further, each binding site’s occupancy is assumed to be solely dependent on its primary sequence affinity, represented by a 5mer (no cooperativity, no competition with other proteins or RNA structure). Under these assumptions, we can compute the occupancy for each 5mer i using its SPR-calibrated, RBNS-derived Kd (see above) as Oi = [Pfree] / ([Pfree] + Kd). This is the familiar Michaelis-Menten type relationship between protein concentration and binding probability, also known as the Langmuir isotherm. The distinctive features are approximate linearity for [Pfree] << Kd where Oi ≈ [Pfree]/Kd, Oi = 0.5 for [Pfree] = Kd, and saturation with Oi asymptotically approaching 1 for [Pfree] >> Kd. The relationship between total and free protein can be found from mass-action: [Pfree] = [Ptotal] – [Pbound]. And [Pbound] = Σi Oi * ci (where ci is the estimated concentration of 5mer i in the nucleus). This is equivalent to standard formulations in biophysical chemistry for mixtures of many ligands.71 Because [Pfree] occurs on both sides of this non-linear equation, we numerically find the free RBP concentration 0 < [Pfree] < [Ptotal] to optimally satisfy mass-action. From this then directly follow the expected occupancies of Rbfox motifs and the fraction of total Rbfox protein allotted to the corresponding sites as f = Σj Oj * cj / [Ptotal] (where j are motif 5mers). Non-primary, non-secondary 5mers with partial overlap to primary motifs (139 out of 1,024 5mers) were ignored for this analysis.
Statistics
Supplementary Table 7 contains details of all statistical tests performed.
Code availability statement
Custom code generated during the current study is available from the corresponding author upon reasonable request.
Data availability statement
nsRBNS raw data is available under accession number GSE152510 and processed data is available in Supplementary Table 2. Due to their large volume, FACS data are available from the corresponding author on reasonable request. Data used in other analyses can be found at PDB 2ERR (Figure 2a), GEO GSE54794 (Figure 3a,b), SRA SRP128054, SRP035321 (Figure 3c–e), SRA PRJNA185305 (Figure 5), and SRA SRP055008 (Figure 6a–b)
Extended Data
Extended Data Figure 1. RBFOX2 nsRBNS reveals binding to a set of moderate-affinity secondary motifs.
a. Correlations among seven natural sequence nsRBNS experiments. Pearson correlations are reported for any sequence with an enrichment (R) value greater than 1. Darker color indicates a higher correlation (R 1.1.463 cor.test function). n = 38467. b. Correlation of nsRBNS R with eCLIP enrichment at oligo-derived regions for all oligonucleotides or sequence regions containing a single GCAUG Rbfox primary motif (n = 2946). c. R value distribution of nsRBNS sequences containing 0 (n = 21596) or 1–3 (n = 2397) NGCAU motifs. d. R value distribution of nsRBNS sequences containing 0 (n = 11077) or 1–3 (n = 12916) AU motifs. e. RBFOX2 eCLIP in HepG2 at library positions in the transcriptome for 0 (n = 7041) or 1–3 (n = 711) NGCAU motifs. RBFOX2 peaks were compared to an IgG control to determine enrichments. f. RBFOX2 eCLIP in HepG2 at library positions in the transcriptome for 0 (n = 4610) or 1–3 (n = 3142) AU motifs. RBFOX2 peaks were compared to an IgG control to determine enrichments.
Extended Data Figure 2. Different nsRBNS libraries emphasize different 5mer binding preferences for RBFOX2.
a. R value distribution of nsRBNS sequences containing 1–2 copies of different 6mer classes UGNNUG (n = 7725), CGNNUG (n = 1751), AGNNUG (n = 6260), GGNNUG (n = 4935). b-c. Comparison of random (b) and intronic natural sequence (c) RBNS with 3' UTR nsRBNS 5mer enrichments. Primary and secondary motifs are labelled in red and blue, respectively. Dotted lines show 2.5 standard deviations above the mean. d. Filter binding with radiolabeled oligonucleotides containing three copies of the indicated sequence brought to equilibrium with six concentrations of RBFOX2. Primary motifs in gold, secondary motifs in teal, controls in grey. Error bars indicate +/− SD for three replicates.
Extended Data Figure 3. RBFOX2 iCLIP demonstrates broad agreement with nsRBNS.
a. Some secondary motifs show sharp peaks near 0 in a metaplot centered at the motif in introns (black) and 3' UTRs (grey) in RBFOX2 iCLIP data27. 5' ends of iCLIP reads containing the motif of interest were aligned with position one of the pentamer at 0 and normalized to the minimum read count in an 80-nt window (50-nt window shown). Y-axis range was reduced for secondary motifs. See Methods for read counts. b. AU-rich nsRBNS motifs do not show characteristic read peaks near 0 in a metaplot centered at the motif in introns (black) and 3' UTRs (grey) in RBFOX2 iCLIP data27. iCLIP reads containing the motif of interest were aligned with position one of the pentamer at 0 and normalized to the minimum read count in an 80-nt window (50-nt window shown). Y-axis range was reduced for secondary motifs. See methods for read counts. c. Schematic showing the generation of a clip enrichment (CE) score from iCLIP data. After generation of a metaplot, the read count at the peak apex was divided by the read count at its lowest point to generate a CE score analogous to an enrichment. d. Correlation of iCLIP- and nsRBNS-enriched 5mers in 3' UTRs (n = 1024). CLIP enrichment (CE) scores were computed for iCLIP peaks. Secondary motifs indicated in teal, primary motifs indicated in gold.
Extended Data Figure 4. Enrichment of 5mers in HiTS-CLIP.
5mer enrichment of top 200 5mers in two HiTS-CLIP datasets in both introns and 3' UTRs. 5mer enrichment was calculated by determining the frequencies of all 1,024 5mers in CLIP peaks in each region and dataset and subsequently normalizing to control peaks from that region. Peaks from (a) Mouse ventral spinal neuron 3' UTR HiTS-CLIP, (b) Mouse whole brain intronic HiTS-CLIP, and (c) Mouse whole brain 3' UTR HiTS-CLIP were analyzed. Gold indicates primary motifs, teal indicates secondary motifs.
Extended Data Figure 5. Representative raw data from flow cytometry.
Graphs were drawn with pseudocolor in FlowJo. a. Gating strategy to select for single, live, intact cells. Events were gated through three serial gates to obtain approximately 25000 events for downstream analysis. Total number of events in each graph, and the percentage of events within the gate in each graph are shown. (FSC: forward scatter; SSC: side scatter; A: area; H: height; W: width.) b,c. Compensated values of the three fluorophores used (dsRED, EGFP, Cerulean), in positive and control samples with (b) primary and (c) secondary motifs.
Extended Data Figure 6. Secondary motifs promote inclusion in a splicing reporter in an RBFOX1-dependent manner at the protein level.
a. Six secondary motifs approximate the exon inclusion of one primary motif in an Rbfox1-dependent manner at the protein level, replicate 2. RG6 plasmids containing one primary motif or six secondary motifs were co-transfected in HEK293T cells with fluorescently labelled Rbfox1 and monitored by flow cytometry for the inclusion isoform (GFP), exclusion isoform (dsRED), and Rbfox1 (Cerulean) expression at the single-cell level. Controls including a scrambled motif co-transfected with Rbfox1 (light grey) and scrambled and intact motifs without Rbfox1 (grey) are also shown. Bins detailed in Supplementary Table 5. b. The slope of linear fit of two flow cytometry replicates were null-subtracted and normalized to their permuted controls. Error bars represent standard error of the mean (SEM).
Extended Data Figure 7. Secondary motifs become engaged at specific intervals of neuronal differentiation.
Pearson correlation of secondary motif presence with exon inclusion at intervals of neuronal differentiation beginning with embryonic stem cells and progressing to mature 28-day glutamatergic neurons (ESC–NESC (n = 448), NESC–RG (n = 1478), RG–DS1 (n = 940), DS1–DS3 (n = 2189), DS3–MAT16 (n = 1600), MAT16–MAT21 (n = 378), MAT21–MAT28 (n = 373)). Size of point indicates correlation coefficient, intensity indicates p-value < 0.05.
Extended Data Figure 8. Estimation of secondary motif-dependent Rbfox events across neuronal cell types.
In a comparison of neuronal cell types with medium to highest Rbfox mRNA expression, exons likely to be regulated by Rbfox are significantly (P < .0084 Fisher’s exact test, ndown = 13; nup = 28) enriched in secondary motifs. Of 864 alternative exons with increased splicing, 11% are primary, 26.4% primary and secondary, and 3.2% are 4+ secondary motif-associated. Exons with one to three secondary motif instances are also significantly enriched (P < 0.0012, Fisher’s exact test, ndown = 263; nup = 354).
Extended Data Figure 9. Affinity estimation of Rbfox secondary motifs.
RBNS 7-mer enrichments (R-value) for 1.1 μΜ RBFOX2 (a) and 1.3 μΜ RBFOX3 (b) binding were first corrected for non-specific contributions (R’ see Methods) and then linearly correlated with known dissociation constants (Kd) for RBFOX1 binding1,2. Correlation coefficients between log(R’) and log(Kd) were r=-0.955, P-value=8.379 × 10⁻⁹ (a) and r=−0.915, P-value=6.7 × 10⁻⁷ (b). Scatter plots show estimated Kd as a function of the original, uncorrected R-value. Resulting 7-mer Kd estimates were highly correlated between RBFOX2 and RBFOX3 (c) with r=0.763, P-value ≈ 0. Data for all 7-mers are shown on a logarithmic scale. Primary motif containing 7-mers are highlighted in gold (GCAUG), yellow (GCACG), and teal (secondary motifs GCUUG, GAAUG, GUUUG, GUGUG, GUAUG, GCCUG). Grouping 7-mers by their 5-mer content allows to estimate average Kds for each 5-mer (see Methods). A histogram of these 5-mer dissociation constants is shown in (d), with primary and secondary motifs highlighted as in (c). Motifs GCUUG, GAAUG and GUUUG were considered strong motifs. 136 non-primary or secondary 5-mers with partial overlap to primary motifs GCAUG, GCACG were excluded.
Extended Data Figure 10. A model for Rbfox secondary motifs.
a. A high nuclear mRNA expression weighted histogram of potential intronic Rbfox binding sites (1,000,000 mRNAs/cell with average half-life time of 3 hours). Motif 5mers in gold (GCAUG), yellow (GCACG), and teal (GCUUG, GAAUG, GUUUG, GUAUG). b. A low nuclear mRNA expression weighted histogram of potential intronic Rbfox binding sites (10x lower mRNA copies/cell and a half-life time of 4 hours). c-d. Predicted average Rbfox occupancies on 5mer motifs as a function of the nuclear Rbfox concentration in low (c) and high (d) mRNA scenarios. The low mRNA scenario predicts that the fraction of Rbfox bound to secondary motifs surpasses primary motifs at Rbfox levels > 1 μΜ. This is lower than estimates from the high mRNA scenario in main Figure 6 (~14 μΜ). Non-specific binding depicted in grey. e. Filter binding with radiolabeled oligonucleotide containing three copies of a primary (GCAUG) or secondary (GCUUG, GAAUG, GUUUG) were incubated to equilibrium in the presence of unlabeled, single copy GCAUG oligonucleotide at six concentrations of RBFOX2. As protein concentration increased, so did the fraction bound of labeled RNA for both primary and secondary motifs. Error bars indicate +/− SD of three replicates.
Supplementary Material
Acknowledgments
We thank past and present members of the C. Burge Lab, J. Conboy, and I. Jarmoskaite for helpful comments on the manuscript. We gratefully acknowledge the courtesy of the C. Zhang lab of Columbia University, who shared intermediate results from Weyn-Vanhentenryck et al.4 used for Figure 6 (gene expression, PSI values, exon coordinates). M. Jens received an EMBO Long Term Fellowship ALTF-1130-2015. All other authors were supported by NIH 5-R01-GM085319.
Footnotes
Competing interests statement
The authors declare no competing interests.
References
- 1.Hodgkin J, Zellan JD & Albertson DG Identification of a candidate primary sex determination locus, fox-1, on the X chromosome of Caenorhabditis elegans. Development (1994). [DOI] [PubMed] [Google Scholar]
- 2.Skipper M, Milne CA & Hodgkin J Genetic and molecular analysis of fox-1, a numerator element involved in Caenorhabditis elegans primary sex determination. Genetics (1999). [DOI] [PMC free article] [PubMed] [Google Scholar]
- 3.Kim KK, Adelstein RS & Kawamoto S Identification of neuronal nuclei (NeuN) as Fox-3, a new member of the Fox-1 gene family of splicing factors. J. Biol. Chem. (2009). doi: 10.1074/jbc.M109.052969 [DOI] [PMC free article] [PubMed] [Google Scholar]
- 4.Weyn-Vanhentenryck SM et al. Precise temporal regulation of alternative splicing during neural development. Nat. Commun. (2018). doi: 10.1038/s41467-018-04559-0 [DOI] [PMC free article] [PubMed] [Google Scholar]
- 5.Gallagher TL et al. Rbfox-regulated alternative splicing is critical for zebrafish cardiac and skeletal muscle functions. Dev. Biol. (2011). doi: 10.1016/j.ydbio.2011.08.025 [DOI] [PMC free article] [PubMed] [Google Scholar]
- 6.Conboy JG Developmental regulation of RNA processing by Rbfox proteins. Wiley Interdisciplinary Reviews: RNA (2017). doi: 10.1002/wrna.1398 [DOI] [PMC free article] [PubMed] [Google Scholar]
- 7.Kuroyanagi H Fox-1 family of RNA-binding proteins. Cellular and Molecular Life Sciences (2009). doi: 10.1007/s00018-009-0120-5 [DOI] [PMC free article] [PubMed] [Google Scholar]
- 8.Jacko M et al. Rbfox Splicing Factors Promote Neuronal Maturation and Axon Initial Segment Assembly. Neuron (2018). doi: 10.1016/j.neuron.2018.01.020 [DOI] [PMC free article] [PubMed] [Google Scholar]
- 9.Gehman LT et al. The splicing regulator Rbfox1 (A2BP1) controls neuronal excitation in the mammalian brain. in Nature Genetics (2011). doi: 10.1038/ng.841 [DOI] [PMC free article] [PubMed] [Google Scholar]
- 10.Gehman LT et al. The splicing regulator Rbfox2 is required for both cerebellar development and mature motor function. Genes Dev. (2012). doi: 10.1101/gad.182477.111 [DOI] [PMC free article] [PubMed] [Google Scholar]
- 11.Hamada N et al. Essential role of the nuclear isoform of RBFOX1, a candidate gene for autism spectrum disorders, in the brain development. Sci. Rep (2016). doi: 10.1038/srep30805 [DOI] [PMC free article] [PubMed] [Google Scholar]
- 12.Lee JA et al. Cytoplasmic Rbfox1 Regulates the Expression of Synaptic and Autism-Related Genes. Neuron (2016). doi: 10.1016/j.neuron.2015.11.025 [DOI] [PMC free article] [PubMed] [Google Scholar]
- 13.Vuong CK et al. Rbfox1 Regulates Synaptic Transmission through the Inhibitory Neuron-Specific vSNARE Vamp1. Neuron (2018). doi: 10.1016/j.neuron.2018.03.008 [DOI] [PMC free article] [PubMed] [Google Scholar]
- 14.Weyn-Vanhentenryck SM et al. HITS-CLIP and Integrative Modeling Define the Rbfox Splicing-Regulatory Network Linked to Brain Development and Autism. Cell Rep. (2014). doi: 10.1016/j.celrep.2014.02.005 [DOI] [PMC free article] [PubMed] [Google Scholar]
- 15.Bhalla K et al. The de novo chromosome 16 translocations of two patients with abnormal phenotypes (mental retardation and epilepsy) disrupt the A2BP1 gene. J. Hum. Genet. (2004). doi: 10.1007/s10038-004-0145-4 [DOI] [PubMed] [Google Scholar]
- 16.Barnby G et al. Candidate-Gene Screening and Association Analysis at the Autism-Susceptibility Locus on Chromosome 16p: Evidence of Association at GRIN2A and ABAT. Am. J. Hum. Genet. (2005). doi: 10.1086/430454 [DOI] [PMC free article] [PubMed] [Google Scholar]
- 17.Martin CL et al. Cytogenetic and molecular characterization of A2BP1/FOX1 as a candidate gene for autism. Am. J. Med. Genet. Part B Neuropsychiatr. Genet (2007). doi: 10.1002/ajmg.b.30530 [DOI] [PubMed] [Google Scholar]
- 18.Sebat J et al. Strong association of de novo copy number mutations with autism. Science (80-. ). (2007). doi: 10.1126/science.1138659 [DOI] [PMC free article] [PubMed] [Google Scholar]
- 19.Jin Y et al. A vertebrate RNA-binding protein Fox-1 regulates tissue-specific splicing via the pentanucleotide GCAUG. EMBO J. (2003). doi: 10.1093/emboj/cdg089 [DOI] [PMC free article] [PubMed] [Google Scholar]
- 20.Brudno M Computational analysis of candidate intron regulatory elements for tissue-specific alternative pre-mRNA splicing. Nucleic Acids Res. (2001). doi: 10.1093/nar/29.11.2338 [DOI] [PMC free article] [PubMed] [Google Scholar]
- 21.Minovitsky S, Gee SL, Schokrpur S, Dubchak I & Conboy JG The splicing regulatory element, UGCAUG, is phylogenetically and spatially conserved in introns that flank tissue-specific alternative exons. Nucleic Acids Res. (2005). doi: 10.1093/nar/gki210 [DOI] [PMC free article] [PubMed] [Google Scholar]
- 22.Ying Y et al. Splicing Activation by Rbfox Requires Self-Aggregation through Its Tyrosine-Rich Domain. Cell (2017). doi: 10.1016/j.cell.2017.06.022 [DOI] [PMC free article] [PubMed] [Google Scholar]
- 23.Yeo GW et al. An RNA code for the FOX2 splicing regulator revealed by mapping RNA-protein interactions in stem cells. Nat. Struct. Mol. Biol. (2009). doi: 10.1038/nsmb.1545 [DOI] [PMC free article] [PubMed] [Google Scholar]
- 24.Lovci MT et al. Rbfox proteins regulate alternative mRNA splicing through evolutionarily conserved RNA bridges. Nat. Struct. Mol. Biol. (2013). doi: 10.1038/nsmb.2699 [DOI] [PMC free article] [PubMed] [Google Scholar]
- 25.Sun S, Zhang Z, Fregoso O & Krainer AR Mechanisms of activation and repression by the alternative splicing factors RBFOX½. RNA (2012). doi: 10.1261/rna.030486.111 [DOI] [PMC free article] [PubMed] [Google Scholar]
- 26.Dominguez D et al. Sequence, Structure, and Context Preferences of Human RNA Binding Proteins. Mol. Cell (2018). doi: 10.1016/j.molcel.2018.05.001 [DOI] [PMC free article] [PubMed] [Google Scholar]
- 27.Jangi M, Boutz PL, Paul P & Sharp PA Rbfox2 controls autoregulation in RNA-binding protein networks. Genes Dev. (2014). doi: 10.1101/gad.235770.113 [DOI] [PMC free article] [PubMed] [Google Scholar]
- 28.Lambert N et al. RNA Bind-n-Seq: Quantitative Assessment of the Sequence and Structural Binding Specificity of RNA Binding Proteins. Mol. Cell (2014). doi: 10.1016/j.molcel.2014.04.016 [DOI] [PMC free article] [PubMed] [Google Scholar]
- 29.Stoltz M Interactions of the alternative splicing factor RBFOX with non-coding RNAs (ETH Zurich, 2015). [Google Scholar]
- 30.Sellier C et al. RbFOX1/MBNL1 competition for CCUG RNA repeats binding contributes to myotonic dystrophy type 1/type 2 differences. Nat. Commun (2018). doi: 10.1038/s41467-018-04370-x [DOI] [PMC free article] [PubMed] [Google Scholar]
- 31.Kuroyanagi H, Ohno G, Mitani S & Hagiwara M The Fox-1 Family and SUP-12 Coordinately Regulate Tissue-Specific Alternative Splicing In Vivo. Mol. Cell. Biol. (2007). doi: 10.1128/mcb.01508-07 [DOI] [PMC free article] [PubMed] [Google Scholar]
- 32.Kuwasako K et al. RBFOX and SUP-12 sandwich a G base to cooperatively regulate tissue-specific splicing. Nat. Struct. Mol. Biol. (2014). doi: 10.1038/nsmb.2870 [DOI] [PubMed] [Google Scholar]
- 33.Damianov A et al. Rbfox Proteins Regulate Splicing as Part of a Large Multiprotein Complex LASR. Cell (2016). doi: 10.1016/j.cell.2016.03.040 [DOI] [PMC free article] [PubMed] [Google Scholar]
- 34.Zhang C et al. Defining the regulatory network of the tissue-specific splicing factors Fox-1 and Fox-2. Genes Dev. (2008). doi: 10.1101/gad.1703108 [DOI] [PMC free article] [PubMed] [Google Scholar]
- 35.Kishore S et al. A quantitative analysis of CLIP methods for identifying binding sites of RNA-binding proteins. Nat. Methods (2011). doi: 10.1038/nmeth.1608 [DOI] [PubMed] [Google Scholar]
- 36.Uren PJ et al. Site identification in high-throughput RNA-protein interaction data. Bioinformatics (2012). doi: 10.1093/bioinformatics/bts569 [DOI] [PMC free article] [PubMed] [Google Scholar]
- 37.Van Nostrand EL et al. Robust transcriptome-wide discovery of RNA-binding protein binding sites with enhanced CLIP (eCLIP). Nat. Methods (2016). doi: 10.1038/nmeth.3810 [DOI] [PMC free article] [PubMed] [Google Scholar]
- 38.Taliaferro JM et al. RNA Sequence Context Effects Measured In Vitro Predict In Vivo Protein Binding and Regulation. Mol. Cell (2016). doi: 10.1016/j.molcel.2016.08.035 [DOI] [PMC free article] [PubMed] [Google Scholar]
- 39.McNutt PM, Hubbard KS, Gut IM & Lyman ME Longitudinal RNA sequencing of the deep transcriptome during neurogenesis of cortical glutamatergic neurons from murine ESCs. F1000Research (2013). doi: 10.12688/f1000research.2-35.v1 [DOI] [PMC free article] [PubMed] [Google Scholar]
- 40.Feingold EA et al. The ENCODE (ENCyclopedia of DNA Elements) Project. Science (2004). doi: 10.1126/science.1105136 [DOI] [PubMed] [Google Scholar]
- 41.Auweter SD et al. Molecular basis of RNA recognition by the human alternative splicing factor Fox-1. EMBO J. (2006). doi: 10.1038/sj.emboj.7600918 [DOI] [PMC free article] [PubMed] [Google Scholar]
- 42.Helder S, Blythe AJ, Bond CS & Mackay JP Determinants of affinity and specificity in RNA-binding proteins. Current Opinion in Structural Biology (2016). doi: 10.1016/j.sbi.2016.05.005 [DOI] [PubMed] [Google Scholar]
- 43.Orengo JP, Bundman D & Cooper TA A bichromatic fluorescent reporter for cell-based screens of alternative splicing. Nucleic Acids Res. (2006). doi: 10.1093/nar/gkl967 [DOI] [PMC free article] [PubMed] [Google Scholar]
- 44.Mordue KE, Hawley BR, Satchwell TJ & Toye AM CD47 surface stability is sensitive to actin disruption prior to inclusion within the band 3 macrocomplex. Sci. Rep. (2017). doi: 10.1038/s41598-017-02356-1 [DOI] [PMC free article] [PubMed] [Google Scholar]
- 45.Lee EHY, Hsieh YP, Yang CL, Tsai KJ & Liu CH Induction of integrin-associated protein (IAP) mRNA expression during memory consolidation in rat hippocampus. Eur. J. Neurosci. (2000). doi: 10.1046/j.1460-9568.2000.00985.x [DOI] [PubMed] [Google Scholar]
- 46.Murata T et al. CD47 promotes neuronal development through Src- and FRG/Vav2-mediated activation of Rac and Cdc42. J. Neurosci. (2006). doi: 10.1523/JNEUROSCI.3981-06.2006 [DOI] [PMC free article] [PubMed] [Google Scholar]
- 47.Jens M & Rajewsky N Competition between target sites of regulators shapes post-transcriptional gene regulation. Nat. Rev. Genet. (2015). doi: 10.1038/nrg3853 [DOI] [PubMed] [Google Scholar]
- 48.Schwanhüusser B et al. Global quantification of mammalian gene expression control. Nature (2011). doi: 10.1038/nature10098 [DOI] [PubMed] [Google Scholar]
- 49.Wiśniewski JR, Hein MY, Cox J & Mann MA ‘proteomic ruler’ for protein copy number and concentration estimation without spike-in standards. Mol. Cell. Proteomics (2014). doi: 10.1074/mcp.M113.037309 [DOI] [PMC free article] [PubMed] [Google Scholar]
- 50.Xiao X et al. Splice site strength-dependent activity and genetic buffering by poly-G runs. Nat. Struct. Mol. Biol. (2009). doi: 10.1038/nsmb.1661 [DOI] [PMC free article] [PubMed] [Google Scholar]
- 51.Wagner SD et al. Dose-Dependent Regulation of Alternative Splicing by MBNL Proteins Reveals Biomarkers for Myotonic Dystrophy. PLoS Genet. (2016). doi: 10.1371/journal.pgen.1006316 [DOI] [PMC free article] [PubMed] [Google Scholar]
- 52.Gaudet J & Mango SE Regulation of organogenesis by the Caenorhabditis elegans FoxA protein PHA-4. Science (80-. ). (2002). doi: 10.1126/science.1065175 [DOI] [PubMed] [Google Scholar]
- 53.Rowan S et al. Precise temporal control of the eye regulatory gene Pax6 via enhancer-binding site affinity. Genes Dev. (2010). doi: 10.1101/gad.1890410 [DOI] [PMC free article] [PubMed] [Google Scholar]
- 54.Farley EK et al. Suboptimization of developmental enhancers. Science (80-. ). (2015). doi: 10.1126/science.aac6948 [DOI] [PMC free article] [PubMed] [Google Scholar]
- 55.Wang J, Malecka A, Trøen G & Delabie J Comprehensive genome-wide transcription factor analysis reveals that a combination of high affinity and low affinity DNA binding is needed for human gene regulation. BMC Genomics (2015). doi: 10.1186/1471-2164-16-S7-S12 [DOI] [PMC free article] [PubMed] [Google Scholar]
- 56.Jankowsky E & Harris ME Specificity and nonspecificity in RNA-protein interactions. Nature Reviews Molecular Cell Biology (2015). doi: 10.1038/nrm4032 [DOI] [PMC free article] [PubMed] [Google Scholar]
- 57.Sanders DW et al. Competing Protein-RNA Interaction Networks Control Multiphase Intracellular Organization. Cell (2020). doi: 10.1016/j.cell.2020.03.050 [DOI] [PMC free article] [PubMed] [Google Scholar]
- 58.Gomes E & Shorter J The molecular language of membraneless organelles. Journal of Biological Chemistry (2019). doi: 10.1074/jbc.TM118.001192 [DOI] [PMC free article] [PubMed] [Google Scholar]
- 59.Harrow J et al. GENCODE: The reference human genome annotation for the ENCODE project. Genome Res. (2012). doi: 10.1101/gr.135350.111 [DOI] [PMC free article] [PubMed] [Google Scholar]
- 60.Pollard KS, Hubisz MJ, Rosenbloom KR & Siepel A Detection of nonneutral substitution rates on mammalian phylogenies. Genome Res. (2010). doi: 10.1101/gr.097857.109 [DOI] [PMC free article] [PubMed] [Google Scholar]
- 61.Bray NL, Pimentel H, Melsted P & Pachter L Near-optimal probabilistic RNA-seq quantification. Nat. Biotechnol. (2016). doi: 10.1038/nbt.3519 [DOI] [PubMed] [Google Scholar]
- 62.Shen S et al. rMATS: Robust and flexible detection of differential alternative splicing from replicate RNA-Seq data. Proc. Natl. Acad. Sci. U. S. A. (2014). doi: 10.1073/pnas.1419161111 [DOI] [PMC free article] [PubMed] [Google Scholar]
- 63.Eden E, Navon R, Steinfeld I, Lipson D & Yakhini Z GOrilla: A tool for discovery and visualization of enriched GO terms in ranked gene lists. BMC Bioinformatics (2009). doi: 10.1186/1471-2105-10-48 [DOI] [PMC free article] [PubMed] [Google Scholar]
- 64.Eden E, Lipson D, Yogev S & Yakhini Z Discovering motifs in ranked lists of DNA sequences. PLoS Comput. Biol. (2007). doi: 10.1371/journal.pcbi.0030039 [DOI] [PMC free article] [PubMed] [Google Scholar]
- 65.Jones E, Oliphant T, Peterson P & Others. SciPy.org SciPy: Open source scientific tools for Python2 (2001). [Google Scholar]
- 66.Hunter JD Matplotlib: A 2D graphics environment. Comput. Sci. Eng. (2007). doi: 10.1109/MCSE.2007.55 [DOI] [Google Scholar]
- 67.Kosik KS Life at Low Copy Number: How Dendrites Manage with So Few mRNAs. Neuron (2016). doi: 10.1016/j.neuron.2016.11.002 [DOI] [PubMed] [Google Scholar]
- 68.Benavides-Piccione R et al. Differential Structure of Hippocampal CA1 Pyramidal Neurons in the Human and Mouse. Cereb. Cortex (2019). doi: 10.1093/cercor/bhz122 [DOI] [PubMed] [Google Scholar]
- 69.Sharova LV et al. Database for mRNA half-life of 19 977 genes obtained by DNA microarray analysis of pluripotent and differentiating mouse embryonic stem cells. DNA Res. (2009). doi: 10.1093/dnares/dsn030 [DOI] [PMC free article] [PubMed] [Google Scholar]
- 70.Li JJ, Bickel PJ & Biggin MD System wide analyses have underestimated protein abundances and the importance of transcription in mammals. PeerJ (2014). doi: 10.7717/peerj.270 [DOI] [PMC free article] [PubMed] [Google Scholar]
- 71.Cox RA Biophysical Chemistry Part III: The Behavior of Biological Macromolecules: by C. R. Cantor and P. R. Schimmel Freeman; San Francisco, 1980 xxx + 524 pages. £22.40 (board); £11.90 (paper). FEBS Lett. (1981). doi: 10.1016/0014-5793(81)80070-1 [DOI] [Google Scholar]
Associated Data
This section collects any data citations, data availability statements, or supplementary materials included in this article.
Supplementary Materials
Data Availability Statement
nsRBNS raw data is available under accession number GSE152510 and processed data is available in Supplementary Table 2. Due to their large volume, FACS data are available from the corresponding author on reasonable request. Data used in other analyses can be found at PDB 2ERR (Figure 2a), GEO GSE54794 (Figure 3a,b), SRA SRP128054, SRP035321 (Figure 3c–e), SRA PRJNA185305 (Figure 5), and SRA SRP055008 (Figure 6a–b)


