

Abstract
We conducted a serological study to define correlates of immunity against SARS-CoV-2. Compared to those with mild coronavirus disease 2019 (COVID-19) cases, individuals with severe disease exhibited elevated virus-neutralizing titers and antibodies against the nucleocapsid (N) and the receptor binding domain (RBD) of the spike protein. Age and sex played lesser roles. All cases, including asymptomatic individuals, seroconverted by 2 weeks after PCR confirmation. Spike RBD and S2 and neutralizing antibodies remained detectable through 5–7 months after onset, whereas α-N titers diminished. Testing 5,882 members of the local community revealed only 1 sample with seroreactivity to both RBD and S2 that lacked neutralizing antibodies. This fidelity could not be achieved with either RBD or S2 alone. Thus, inclusion of multiple independent assays improved the accuracy of antibody tests in low-seroprevalence communities and revealed differences in antibody kinetics depending on the antigen. We conclude that neutralizing antibodies are stably produced for at least 5–7 months after SARS-CoV-2 infection.
Keywords: SARS-CoV-2, COVID-19, antibodies, serology, serological test, orthogonal serological tests, neutralization, spike protein, nucleocapsid protein, receptor binding domain, S2 domain
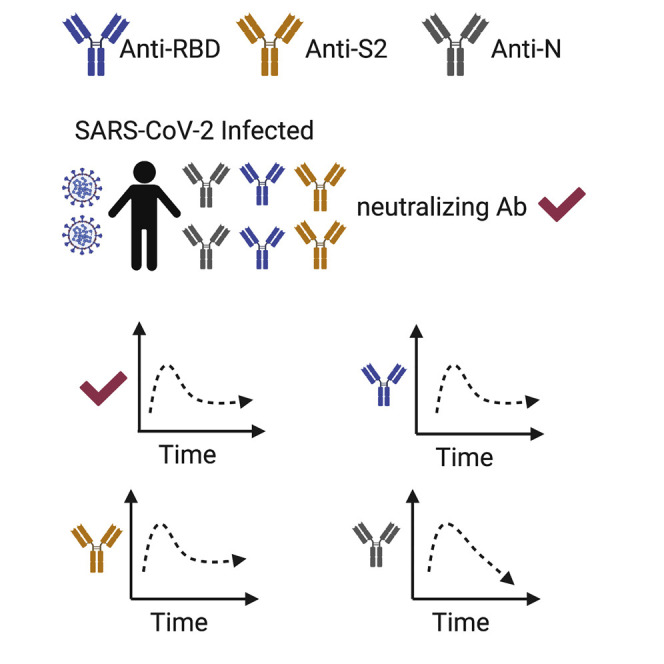
Graphical Abstract
Highlights
-
•
Using independent SARS-CoV-2 antigens improves the specificity of serological assays
-
•
Neutralizing and spike-specific antibody production persists for at least 5–7 months
-
•
Nucleocapsid antibodies frequently become undetectable by 5–7 months
-
•
Antibody production is higher in severe disease than in mild cases
Serological assays for SARS-CoV-2 exposures are challenging due to poor positive predictive values. Ripperger et al. show that the combinatorial use of spike receptor binding domain and S2 eliminates almost all false positives. This serological assay is used to show durable antibody production for at least 5–7 months after infection.
Introduction
SARS-CoV-2, the causative agent of coronavirus disease 2019 (COVID-19), has infected over 34 million people worldwide, with over 1 million dead as of October 1, 2020. Serological testing for SARS-CoV-2 antibodies is an important tool for measuring individual exposures, community transmission, and the efficacy of epidemiological countermeasures. Although a few epicenters of infection have seen a relatively robust spread of the virus (Rosenberg et al., 2020; Stadlbauer et al., 2020), COVID-19 prevalence in most of the world has been low. For example, studies in Spain and Switzerland revealed overall seroprevalences of ∼5%, and some communities were at just 1% antibody positivity (Pollán et al., 2020; Stringhini et al., 2020). There are many challenges associated with accurate antibody testing for SARS-CoV-2 in low-seroprevalence communities. As an example, a seroprevalence study in Santa Clara County, California, suggested higher infection rates than had been anticipated, thereby leading to the interpretation that SARS-CoV-2 was much less deadly than originally thought (Bendavid et al., 2020). Yet, this conclusion was problematic given that the false-positive rates of the administered test approached the true seroprevalence of the community (Bennett and Steyvers, 2020). Thus, it is likely that many positive results were inaccurate, and the overall infection fatality rate was substantially higher than estimated in this study (Bennett and Steyvers, 2020). These problems in poor positive predictive value (the percentage of positive results that are correct) have led the Infectious Diseases Society to recommend against the use of SARS-CoV-2 serological tests except in very limited circumstances (Hanson et al., 2020). The Centers for Disease Control and Prevention has suggested a possible solution to this problem, in that “...an orthogonal testing algorithm (i.e., employing two independent tests in sequence when the first test yields a positive result) can be used when the expected positive predictive value of a single test is low (CDC, 2020).” Yet, because the biological basis for false positives is unknown, there is no guarantee that two different SARS-CoV-2 antigens would in fact behave independently in serological assays. Finally, the assumption of immunity associated with a positive test result might be among the primary motivations for participation in these serological surveys. Virus neutralization assays are functional correlates of immunity but require biosafety level 3 facilities and are difficult to scale and deploy as clinical assays. Tests that fail to provide confidence in functional immune status undermine this important epidemiological tool.
Serological studies have also been used to estimate the durability of antibody production and immunity after SARS-CoV-2 infections. Here again, several surprising conclusions have been reached regarding the short duration of immunity, and several studies suggest that in a substantial number of subjects, antibody levels wane to below the limit of detection within a matter of weeks to months (Ibarrondo et al., 2020; Long et al., 2020a; Pollán et al., 2020; Seow et al., 2020). Yet, all T-dependent humoral responses, even ones that are exceptionally durable, begin with an initial wave of short-lived plasma cells that decline quickly and are progressively replaced by a smaller number of longer-lived antibody-secreting plasma cells (Amanna et al., 2007; Manz et al., 1997; Slifka et al., 1998; Sze et al., 2000). Thus, the decay in antibody production after infection or vaccination is not linear and cannot be extrapolated from early time points, demonstrating the need for longer-term follow-up studies. Indeed, such short-term antibody production would be without precedent after acute coronavirus infections, which typically induce immunity for at least a year and, for SARS-CoV-1, often for much longer (Callow et al., 1990; Guo et al., 2020; Reed, 1984; Tan et al., 2020; Baumgarth et al., 2020). Keys to the accurate interpretation of such studies are sensitive assays, PCR confirmation of test cases, and longitudinal tests of seropositive individuals. Authentic virus neutralization assays are also useful as true correlates of immunity (Zinkernagel and Hengartner, 2006). Absent these components, conclusions about the duration of immunity are premature.
Here, we successfully employed a strategy using receptor binding domain (RBD) and S2 as antigenically distinct tests to accurately identify seropositive individuals in the community. This assay greatly reduced the existing limitations to testing accuracy in low-seroprevalence communities and identified individuals for subsequent analysis of the immune response. We found that disease severity, but not age or sex, were correlates of the magnitude of the response. Furthermore, use of these two antigens, nucleocapsid protein, and neutralizing antibody titers revealed discordance in the durability of antibody responses depending on the viral protein. In contrast to earlier reports, we demonstrate durable production of functionally important antibodies lasting at least 2–3 months after disease onset.
Results
Numerous serological tests that have received Food and Drug Administration Emergency Use Authorizations (https://www.fda.gov/medical-devices/coronavirus-disease-2019-covid-19-emergency-use-authorizations-medical-devices/eua-authorized-serology-test-performance) rely on reactivity to the SARS-CoV-2 RBD domain of the S protein (Amanat et al., 2020; Premkumar et al., 2020). To begin validation of a serological assay for antibodies to RBD, we tested 75 serum samples from PCR-confirmed COVID-19 patients in the hospital at various stages of disease, 54 convalescent samples, and 24 samples from healthy donors. We performed serum dilution ELISAs to quantify RBD-reactive antibodies in these samples. Mammalian RBD antigen preparations were selected as targets, given that they demonstrated superior signal:noise ratios in relation to bacterially produced protein (Figure S1A). Antibody titers were quantified as area under the curve (AUC) and correlated with neutralization of the live USA-WA1/2020 strain of SARS-CoV-2, rather than S-protein pseudotyped virus (Giroglou et al., 2004), because of the poor agreement between these functional assays (Figure S1B) and because of the modest sensitivity of some pseudovirus neutralization tests in relation to those of authentic virus (Schmidt et al., 2020). The correlation was strong between RBD-reactive immunoglobulin G (IgG) and plaque reduction neutralization test (PRNT) titers, which we quantified as the final dilution at which 90% viral neutralization occurred (PRNT90) (Figure 1 A). RBD-reactive IgM antibodies also correlated with PRNT90 titers (Figure S1C). Because (1) IgM and IgG ratios are not indicative of the timing of disease onset (Hou et al., 2020; Long et al., 2020b; Qu et al., 2020), (2) IgA is induced by SARS-CoV-2 (Isho et al., 2020; Iyer et al., 2020; Sterlin et al., 2020), and (3) both IgG and IgM isotypes correlated with neutralizing titers, we chose to quantify total (all isotypes) antigen-specific antibodies for seroprevalence studies.
Figure 1.

Assessment of RBD-Based Sensitivity and Specificity in Serological Testing
(A) Serum samples (153) from healthy controls and confirmed COVID-19 cases were assessed for RBD reactivity by ELISA and neutralization of live SARS-CoV-2. PRNT90 values were determined as the last dilution by which 90% neutralization occurred. Antibody titers were quantified for RBD by quantifying area under the curve (AUC) across a serial dilution curve. R values were calculated by Pearson correlation test.
(B) Pre-2020 negative-control samples (352) and 30 samples from SARS-CoV-2-exposed individuals were screened by ELISA at a single 1:40 dilution against RBD. The blue region indicates overlap of OD values between negative- and positive-control samples. % indicates frequency of negative-control values in this range. Experiments were repeated 3 times.
(C) RBD seroreactivity was quantified based on time elapsed from PCR+ confirmation of SARS-CoV-2 infection.
(D) Individuals recruited from the community (n = 5,882) were screened for seroreactivity to RBD.
(E) PRNT90 analysis from community drawn samples that displayed indeterminate or positive RBD seroreactivity. Samples that neutralized 90% of virions at least at a 1:20 dilution were considered positive. Experiments were repeated at least once. Error bars in (B), (D), and (E) depict mean values of datasets ± standard error of the mean (SEM) and were calculated in GraphPad Prism.
To determine whether RBD was capable of distinguishing between SARS-CoV-2 exposed and uninfected individuals and to set preliminary thresholds for positive calls, we initially tested 1:40 serum dilutions of samples from 30 PCR+ SARS-CoV-2-infected individuals and 32 samples collected prior to September 2019, well before the onset of the current pandemic (Figure S1D). Using this test dataset, we established a preliminary positive cutoff optical density 450 (OD450) value of 0.12, equal to 3 standard deviations above the mean values of the negative controls. We next used this preliminary threshold to test an expanded cohort of 320 negative-control samples collected prior to 2020. (Figure 1B). Reactivity to RBD was clearly distinguishable for the majority of positive samples from negative controls (Figure 1B). However, 6.5% of the expanded negative control group displayed RBD reactivity that overlapped with PCR+ individuals (Figure 1B, blue shade), some of whom might have been early into disease and had not yet generated high levels of antibodies. To quantify the sensitivity of the assay in relation to time of diagnosis, we measured antibody levels to RBD and plotted these values against time following SARS-CoV-2 PCR+ confirmation. The sensitivity was modest within the first 2 weeks, whereas after 2 weeks, 42 of 43 samples showed high ELISA signal (Figure 1C). Based on these data, samples were considered seropositive at OD450 numbers above 0.39, a value slightly above the highest OD obtained from the 352 subjects in the negative-control group (Figure 1B). Sera were considered negative at OD450 values below 0.12. Finally, we created an indeterminate call at OD450 values between 0.12 and 0.39, as we observed some overlap between negative controls and PCR-confirmed samples in this range (Figure 1B, blue shade).
We next applied this assay to community testing and obtained serum samples from 5,882 self-recruited volunteers from Pima County. Donors included healthcare workers (∼26%), first responders (∼27%), University of Arizona students (∼5%), and other members of the general public (∼42%). Currently febrile or otherwise symptomatic patients were excluded. Sera from 73 individuals preliminarily scored as seropositive (Figure 1D). These samples, along with another 171 samples with OD450 values in the indeterminate range were tested for virus neutralization at a serum dilution of 1:20 (Figure 1E). Nine samples with RBD OD450 values below 0.39 were observed to neutralize SARS-CoV-2 (Figure 1E). More problematically, we found that 13 of the 73 samples (17.8%) called positive by RBD reactivity failed to neutralize authentic SARS-CoV-2 (Figure 1E). If virus neutralization is considered a measure of “true” seropositivity, RBD ELISAs alone provided a relatively modest positive predictive value of 82%. These observations indicated a clear need for a secondary screen to accurately quantify seropositivity in a community with low infection rates.
To improve the positive predictive value, we considered the use of an orthogonal antigenically distinct test. Previous studies have used the full-length S protein as a secondary screen after RBD ELISAs (Amanat et al., 2020). Although this secondary screen improves the sensitivity of the assay and is perfectly reasonable in high-seroprevalence communities such as New York City, RBD is part of S and is not antigenically distinct. Thus, a false positive for RBD would presumably also be apparent in S ELISAs. We, therefore, first tested the nucleocapsid (N) protein because several other commercial serological tests quantify antibodies to this antigen (Bryan et al., 2020; Burbelo et al., 2020). IgG antibody titers to N protein in our collected sample cohort showed a strong correlation to PRNT90 titers (Figure 2 A). A weaker correlation was observed between N-reactive IgM levels and PRNT90 titers (Figure S2A). We next assayed reactivity to the N antigen by using a subset of the pre-2019 validation samples used for RBD. N protein seroreactivity overlapped substantially between negative and positive controls (Figure 2B). Moreover, five confirmed COVID-19 samples showed very weak reactivity to N (Figure 2B). Because of the relatively poor performance of N protein as an antigen in our hands, we next tested the S2 domain of S protein as another candidate to determine seropositivity. RBD is located on the S1 domain, rendering S2 antigenically distinct (Bosch et al., 2003; Li, 2016; Wrapp et al., 2020). IgG antibody titers to S2 correlated well with PRNT90 titers (Figure 2C), consistent with reports of S2-specific neutralizing antibodies to SARS-CoV-1 and SARS-CoV-2 (Duan et al., 2005; Song et al., 2020). An assessment of S2 serum reactivity in the pre-2019 cohort revealed that approximately 3.3% of these samples overlapped with signals in PCR-confirmed COVID-19 samples (Figure 2D). We, thereafter, used a threshold of OD450 of >0.35 as our cutoff for S2 positivity, which was 5 standard deviations above the average seroreactivity from the original 32 samples from the negative-control cohort. Specificity control testing using 272 negative-control sera showed that reactivities of negative samples against RBD and S2 were largely independent of one another, given that samples with high signal for one antigen rarely showed similar background for the other (Figure 2E). On the basis of these data, we chose to rely on combined RBD and S2 reactivities as accurate indicators of prior SARS-CoV-2 exposure.
Figure 2.

Assessment of S2 and N Antibodies as Secondary Confirmations of Seropositivity
(A) Correlations of neutralization and N-specific IgG ELISA titers across 156 serum samples from healthy controls and COVID-19 cases.
(B) A sample set of 32 pre-pandemic controls and 30 PCR+ SARS-CoV-2 samples were assayed for seroreactivity to N protein. Blue shaded region indicates overlap between negative and positive controls. Frequency of negative controls in this range is shown.
(C) Correlations of neutralization and S2-specific IgG ELISA titers across 151 serum samples from healthy controls and COVID-19 cases.
(D) Pre-pandemic negative-control samples (272) were screened for seroreactivity against S2 and compared to 30 PCR-confirmed SARS-CoV-2-exposed sera.
(E) Comparison of RBD and S2 seroreactivity across 272 pre-pandemic serum samples. Threshold for RBD positivity as described in Figure 1. Threshold for S2 positivity was set as 5 SDs above the average OD450 of the negative-control cohort.
(F) ELISA results from indeterminate and putative seropositive samples from community testing. Thresholds for seropositivity were defined as in (E). Red circles indicate samples that have PRNT90 titers of at least 1:20. Experiments were repeated at least once. Error bars in (B) and (D) depict the mean value of datasets ± SEM.
With this improved combinatorial RBD and S2 assay to exclude false positives, we re-examined the original samples from the cohort of 5,882 subjects that displayed RBD OD450 values greater than 0.12 (Figures 1D and 1E). Of the 13 non-neutralizing samples that displayed high (OD450 of >0.39) RBD reactivity, 12 lacked S2 reactivity (Figure 2F). In contrast, the remaining 60 RBD+ neutralizing samples all displayed substantial reactivity to S2 (Figure 2F). Five of the 9 samples that fell below the RBD cutoff, yet still neutralized virus, displayed strong reactivity to S2 (Figure 2F). On the basis of these data, we established a scoring criterion of RBD OD450 of >0.39, S2 OD450 of >0.35 as seropositive; RBD OD450 between 0.12 and 0.39, S2 OD450 of >0.35 as indeterminate; and all other samples as seronegative. We applied these criteria to 320 samples obtained prior to 2020 and found 317 negative, 3 indeterminate, and 0 positive calls. Using these same criteria, we achieved an empirically defined false-positive rate of just 0.02%, with only 1 positive sample incapable of neutralizing live SARS-CoV-2 virus. Approximately half the samples called as indeterminate contained neutralizing antibodies. Only 3 samples called as negative possessed neutralizing titers, which were usually low (1:20). To further confirm the sensitivity of the assay, we tested 993 samples at random for neutralizing antibodies. Of these samples, none that called as negative possessed neutralizing activity (data not shown). These data demonstrate that inclusion of S2 as a requisite confirmatory screen markedly improves the positive predictive value of SARS-CoV-2 serological assays, especially in areas with low SARS-CoV-2 seroprevalence.
Several recent reports have suggested more robust immune responses in individuals with severe disease than in individuals with mild cases (Choe et al., 2020; Ko et al., 2020; Long et al., 2020a; Qu et al., 2020). Moreover, the ratios of S and N antibody specificities correlate with disease outcome (Atyeo et al., 2020). We, therefore, examined our data for these trends. First, in our PCR-confirmed cohort, we plotted IgG titers in relation to the time of disease onset, stratified by disease severity. Severe disease (hospital admission) correlated with significantly higher antibody titers against RBD and N than in individuals with mild disease who were symptomatic but did not require hospital admission, whereas S2 titers were not statistically significantly different (Figures 3 A–3C). Neutralizing titers were also higher in those with severe disease than in those with mild cases (Figure 3D). Through campus screening efforts, we also identified six PCR+ individuals who either never developed symptoms or had only a brief and mild headache or anosmia. Although previous reports suggested that such individuals might infrequently seroconvert or frequently serorevert (Long et al., 2020a; Sekine et al., 2020), all such individuals in our cohort showed seroreactivity to RBD and S2 and all but one to N (Figures S3A–S3C), consistent with other recent studies (Choe et al., 2020; Ko et al., 2020). Given that older adults, as well as those of male sex, exhibit disproportional morbidity and mortality from COVID-19, we also sought to test whether humoral immunity in these subjects might be quantitatively reduced (Liu et al., 2020). Contrary to this expectation, we did not observe any adverse effect of advanced age on humoral immunity (Figures 3E–3H). Similarly, within our cohort, females and males had similar anti-RBD, N, S2, and neutralizing responses (Figure S3D–S3G).
Figure 3.

Antibody Responses to SARS-CoV-2 as a Function of Disease Severity and Age
(A–C) Antibody titers to RBD (A), S2 (B), and N (C), over time post-onset of SARS-CoV-2 infection symptom grouped by case severity. The negative-control average was determined by calculating the average AUC value of negative-control (n = 25) samples. The p values represent a comparison of fit in a non-linear regression model between displayed groups; p < 0.05 rejects a single non-linear regression model fit for all datasets in the plot and creates two significantly different model fits.
(D) PRNT90 values over time post-onset of SARS-CoV-2 infection symptoms. The p values were calculated as in (A)–(C).
(E–G) Antibody titers over time post-onset of SARS-CoV-2 infection symptoms from PCR+ confirmed patients or seropositive individuals from community-wide cohort for RBD (E), N (F), and S2 (G), grouped by patient age.
(H) PRNT90 values over time post-onset of SARS-CoV-2 infection symptoms grouped by patient age. For (E)–(H), p values were calculated as in (A)–(D).
Individuals with mild disease have been reported to quickly lose SARS-CoV-2-specific antibodies into convalescence (Ibarrondo et al., 2020; Long et al., 2020a; Seow et al., 2020). To assess the durability of antibody production in our cohort, we first returned to the community cohort of 5,882 individuals. Twenty-nine of the seropositive subjects had reported mild symptoms consistent with COVID-19. These positive samples were thus plotted alongside PCR-confirmed mild disease cases against time after disease onset to determine whether any trends could be observed in declining antibody levels. Across subjects, IgG specific for RBD (Figure 4 A) and S2 (Figure 4B) appeared to peak near 30 days after onset and then partially decline before settling to a more stable nadir at later time points, as would be expected for all acute viral infections. We considered the possibility that we might have missed subjects that had seroreverted prior to their antibody test, thereby incorrectly raising our estimates of the durability of antibody production. Therefore, to examine the duration of IgG production in more depth, a subset of seropositive individuals with relatively low titers was tested longitudinally up to 226 days after onset. These data again revealed stable RBD and S2 IgG levels at later stages of convalescence (Figures 4A and 4B). However, N-reactive IgG levels were quite variable, and most samples approached the lower limit of detection at later time points (Figure 4C). A direct comparison in matched subjects of the changes in RBD, S2, and N IgG titers over time confirmed the variability in N responses and rapid decline in a subset of individuals (Figure 4D). Most importantly, neutralizing antibody levels remained high with very little decay as a function of time in all but one subject (Figure 4E), which showed evidence of neutralizing antibodies that did not quite reach a PRNT90 titer of 20 (Figure S4). These data suggest persistent neutralizing, RBD, and S2-specific antibodies but variable and often declining N-reactive titers during convalescence. Altogether, these data are consistent with the maintenance of functionally important antibody production for at least several months after infection and caution against the use of α-N antibodies to estimate immunity or seroprevalence.
Figure 4.

Antibody Responses to Spike Glycoprotein Are More Stable Than Responses to Nucleocapsid
(A–C) Antibody titers for mild infections over time to RBD (A), S2 (B), and N (C) for PCR-confirmed subjects and seropositive samples from community serological testing. Solid lines connect data from individuals sampled serially over time. Blue line depicts smoothing splines curve fit with 4 knots. Dashed line depicts mean values from seronegative controls.
(D) Subjects sampled serially were assessed for changes in antibody titers to RBD, S2, and N from the first draw to the last draw collected. Only subjects in which the last draw occurred >6 weeks from onset are shown. The p values were calculated by paired 1-way ANOVA.
(E) Neutralizing titers were measured for longitudinal subjects over time post-onset. Solid lines connect data from individuals sampled serially over time. Spline curve (blue line) was generated in Prism using Loess smoothing splines. Pseudo-R2 values were calculated as the squared correlation of the predicted outcomes and the actual outcomes from the fitted model.
Discussion
Here, we demonstrated that using two antigenically distinct serological tests can greatly remedy specificity problems that are exacerbated in low SARS-CoV-2 seroprevalence communities. RBD and S2 seroreactivity behaved independently for SARS-CoV-2-unexposed individuals, thereby suggesting that the theoretical false-positive rate of the overall assay is the product of the two tests. Using neutralization assays to confirm these results, we found our empirically determined false-positive rate to be <0.02% (1 out of 5,882), consistent with the independence of the RBD and S2 tests. The tight co-incidence between RBD/S2 positivity and the presence of neutralizing antibodies, even in low-seroprevalence populations, is especially valuable for identifying individuals who likely have some degree of immunity. Surprisingly, the N, which is used by several commercial serological tests as an antigen, did not perform as well in our assays and had high false-positive and -negative rates.
Although we are uncertain why N protein reactivity proved less discriminatory in our hands than in that of published work (Bryan et al., 2020; Steensels et al., 2020), as one possible explanation, we observed that in several subjects, N-specific antibodies declined more rapidly than those against RBD or S2. This unexpected finding might in part help explain some discrepancies in the literature. In some reports, SARS-CoV-2-specific N antibodies fell to undetectable levels within 2–3 months in up to 40% of those recovering from mild disease (Long et al., 2020a; Pollán et al., 2020), which would be remarkably transient and very unusual for acute viral infections, even other common coronaviruses (Callow et al., 1990; Reed, 1984). We also observed such a decline in some subjects. Yet, encouragingly, neutralizing antibodies and those against RBD and S2 reached a stable nadir and persisted for at least 7 months after the initial expected decline, presumably as short-lived plasma cells were replaced with long-lived antibody-secreting cells. These data are consistent with expectations for acute viral infections and with the conclusions of other recent studies (Gudbjartsson et al., 2020; Isho et al., 2020; Iyer et al., 2020; Wajnberg et al., 2020). In this regard, the primary data for S and neutralizing antibody responses seem consistent across several studies (Ibarrondo et al., 2020; Seow et al., 2020), although the interpretations differ. These differences in interpretation are reminiscent of studies on the length of SARS-CoV-1 immunity. Early reports suggested that immunity was transient (Cao et al., 2007), but more recent studies have demonstrated that SARS-CoV-1 neutralizing antibodies can still be detected 12–17 years afterward (Guo et al., 2020; Tan et al., 2020). Given these lessons, conclusions about the rapid loss of immunity to SARS-CoV-2 are premature and inconsistent with the data we presented here. Indeed, of nearly 30 million cases to date since December 2019, there have been only ∼10 documented and confirmed cases of re-infections (Korean Centers for Disease Control, 2020; To et al., 2020; Yang et al., 2020). These data suggest that resistance to re-infection might be less a function of durability of the immune response and more one of breadth. Although the SARS-CoV-2 genome is diversifying slowly compared with other more mutable pathogens (Worobey et al., 2020), high levels of pre-existing immunity in communities could lead to the selection of rare viral variants that evade neutralizing antibodies (Greaney et al., 2020; Weisblum et al., 2020).
The reasons for the differences in antibody responses across antigens are difficult to explain, given the identical inflammatory environment in which these responses arose. One possibility is that the avidities of germline precursors differ for N and S protein specificities. For both memory and plasma cells, there appears to be a “sweet spot” of antigen avidity that promotes optimal responses (Abbott et al., 2018). A second possibility is that N protein responses are driven by cross-reactive memory, rather than naive B cells. Memory B cells are substantially more diverse than plasma cells, thereby encoding a hidden repertoire that is not represented in serum antibodies (Lavinder et al., 2014; Purtha et al., 2011; Smith et al., 1997; Wong et al., 2020). Consistent with this possibility, the N protein is more conserved across coronaviruses than RBD (Srinivasan et al., 2020). Memory responses, especially by isotype-switched B cells, are directed by fundamentally distinct transcriptional programs than those of naive cells (Bhattacharya et al., 2007; Jash et al., 2016; Wang et al., 2012; Zuccarino-Catania et al., 2014). For example, the transcription factor ZBTB32 specifically limits the magnitude and duration of memory B cell responses, perhaps to keep chronic infections from overwhelming the system (Jash et al., 2016, 2019). It remains to be established whether such mechanisms might be selectively operating on SARS-CoV-2 and other coronavirus N antibody responses because of their antigenic similarity between strains.
Altogether, we have reported a highly specific serological assay for SARS-CoV-2 exposure that is usable in very-low-seroprevalence communities and that returns positive results that are highly co-incident with virus neutralization. Using this assay, we characterize the responses in different subject populations by age, sex, and disease severity; we demonstrate that antibody production persists for at least 3 months; and we suggest explanations for some reports that concluded otherwise.
Limitations of Study
One caveat to our study is that in our community testing cohort we might have missed individuals who were seropositive initially but then seroreverted by the time of the antibody test. Second, the latest time point after disease onset in our study is 226 days. It remains possible that antibody titers will wane substantially at later times. Additional serial sampling of PCR-confirmed mild cases will be needed to test these possibilities. Another limitation is that our study uses the presence of neutralizing antibodies as a metric of true seropositivity. This does not account for exposures that lead to antibodies without detectable virus neutralization. Thus, although such cases are rare (Amanat et al., 2020), we might slightly underestimate seroprevalence by using our approach. Finally, SARS-CoV-2 was cultured on Vero cells, where deletions in the furin cleavage site are frequently selected (Johnson et al., 2020). Sequencing of our virus stocks revealed that mutations in the furin cleavage site (RRAR to WRAR or LRAR) were detected alongside wild-type sequences. This mutation might have modestly reduced the observed neutralizing titers (Johnson et al., 2020), suggesting that immunity could be even more robust than our assays suggest, although the precise titers required to prevent re-infections are unknown.
STAR★Methods
Key Resources Table
| REAGENT or RESOURCE | SOURCE | IDENTIFIER |
|---|---|---|
| Antibodies | ||
| Peroxidase-AffiniPure Goat Anti-Human IgA + IgG + IgM (H+L) | Jackson ImmunoResearch | 109-035-064 RRID: AB_2337583 |
| Peroxidase AffinPure Goat Anti-Human IgG, Fcγ fragment specific | Jackson ImmunoResearch | 109-035-170 |
| Peroxidase AffiniPure Donkey Anti-Human IgM Fc5u fragment specific | Jackson ImmunoResearch | 709-035-073 |
| Anti-COVID-19 & SARS-CoV S glycoprotein [CR3022], Human IgG1, Kappa | Absolute Antibody | Ab01680-10.0 |
| Anti-SARS-CoV-2 S2 Monoclonal antibody | Creative Diagnostics | CABT-CS054 |
| Virus Strains | ||
| SARS-Related Coronavirus 2, Isolate USA-WA1/2020 | BEI Resources | NR-52281 |
| Biological Samples | ||
| Healthy adult serum and plasma | University of Arizona Department of Immunobiology, University of Arizona Health Sciences Biorepository | |
| Adult serum and plasma from acute and convalescent SARS-CoV-2 patients | Banner University Medical Center, University of Arizona Antibody Testing Pilot, University of Arizona Department of Immunobiology | |
| Chemicals, Peptides, and Recombinant Proteins | ||
| SARS-CoV-2 Spike protein (RBD, His Tag) | GenScript | Z03479 |
| SARS-CoV-2 Nucleocapsid protein | GenScript | Z03488 |
| SARS-CoV-2 (2019-nCoV) Spike Protein (S2 ECD, His tag) | Sino Biological | 50590-V08B |
| Alfa Aesar™ 3,3′,5,5′- Tetramethylbenzidine solution, Ready-to-Use, high sensitivity | Fisher Scientific | AAJ61325AU |
| 2N Sulfuric Acid (H2SO4) | Sigma-Aldrich | 258105 |
| Methylcellulose | Millipore Sigma | MP155496 |
| Crystal Violet | Millipore Sigma | C0775 |
| DMEM | GIBCO | 11965 |
| FBS, Heat Inactivated | Omega | FB-02 |
| Sodium Pyruvate | Lonza | 13-115E |
| Trypsin, 0.25% | GIBCO | 25200 |
| Penicillin/Streptomycin | GIBCO | 15140 |
| MEM Non-essential amino acids | GIBCO | 11140 |
| Experimental Models: Cell Lines | ||
| Vero cells, confirmed mycoplasma negative | ATCC | CCL-81 RRID: CVCL_0059 |
| Lenti-X™ 293T Cell Line | Takara Bio USA | 632180 |
| Experimental Models: Organisms/Strains | ||
| Oligonucleotides | ||
| Recombinant DNA | ||
| pCAGGS SARS-Related Coronavirus 2 Wuhan-Hu-1 Spike Glycoprotein Gene | BEI Resources | NR-52310 |
| psPax2 lentiviral packaging plasmid | Trono Lab Packaging and Envelope Plasmids | RRID:Addgene_ 12260 |
| pMD2.G VSV envelope expression plasmid | Trono Lab Packaging and Envelope Plasmids | RRID:Addgene _12259 |
| Software and Algorithms | ||
| Prism v8 | GraphPad | https://www.graphpad.com/scientificsoftware/prism/ |
| R statistical package | https://www.r-package.org | |
Resource Availability
Lead Contact
Further information and requests for resources and reagents should be directed to and will be fulfilled by the Lead Contact, Deepta Bhattacharya (deeptab@arizona.edu).
Materials Availability
This study did not generate new unique reagents.
Data and Code Availability
The data generated in this study and corresponding analyses have been described in main and supplemental figures. Robotic code for 384 well serological automated screening is available upon request. Supplemental Data is available on Mendeley Data (https://doi.org/10.17632/rj4gxdd7sg.1).
Experimental Model and Subject Details
Human subjects
All human subject work was approved by the University of Arizona IRB and was conducted in accordance with all federal, state, and local regulations and guidelines under the protocols 1510182734 and 1410545697A048. Subjects under 18 years of age were excluded. Human subject group characteristics are described in Table S1, as well as below in the text. Subjects were recruited in three ways. First, targeted recruitment was used to recruit confirmed positive COVID-19 PCR test subjects with severe COVID-19, defined as one that needed hospitalization into the Banner-University Medical Center. Second, targeted recruitment was used to recruit subjects with confirmed positive COVID-19 PCR test who did not require hospitalization (mild/moderate COVID-19 cases). Finally, the vast majority of subjects were recruited via public announcement and website registration as part of the University of Arizona Antibody Testing Pilot. For that recruitment, following website registration, subjects were ascertained to be afebrile and without COVID-19 symptoms based on questionnaire, were consented and bled. Blood was centrifuged at six sites across Tucson, AZ, between April 30 and May 7th. For all subjects, venous blood was obtained by venipuncture into SST Vacutainer tubes (Becton Dickinson, Sunnyvale, CA, cat. #367988), serum separated by centrifugation at 1,200 rpm and sent to the central processing laboratory within 4 h. For both hospitalized and non-hospitalized targeted recruitment groups, following aliquoting, serum was used for the ELISA assay with or without freezing and thawing as described below. Finally, sera from 352 subjects recruited into the above two IRB protocols prior to September, 2019, served as negative controls for assay development. Based on local and general prevalence, it would be expected that 96%–98% of these subjects have previously encountered seasonal coronaviruses (Gorse et al., 2010). Freezing and thawing had no effect on levels of antibodies detected by ELISA or PRNT.
Cell Lines
Lenti-X™ 293T cells (Takaro Bio USA) were grown at 37°C, 5% CO2 in high glucose DMEM supplemented with 10% fetal bovine serum, non-essential amino acids, penicillin/streptomycin, glutamine, and sodium pyruvate.
Vero cells (ATCC) for SARS-CoV-2 neutralization assays were grown at 37°C with 5% fetal bovine serum, penicillin/streptomycin, glutamine, and sodium pyruvate. Vero cells for pseudovirus neutralization assays were grown in identical conditions, with the exception of non-essential amino acid addition.
Method Details
Virus
SARS-Related Coronavirus 2, Isolate USA-WA1/2020 (BEI NR-52281) was passaged once on Vero (ATCC #CCL-81) cells at a MOI of 0.01 for 48 h. Supernatant and cell lysate were combined, subjected to a single freeze-thaw, and then centrifuged at 3000RPM for 10 min to remove cell debris.
Antigens and Antiviral antibody assay
The bacterially produced recombinant receptor-binding domain (RBD) of the spike (S) glycoprotein was a gift of Dr Daved Fremont (Washington University, St. Louis, MO). Mammalian RBD was purchased from GenScript (catalog # Z03483). SARS-CoV-2 N (nucleocapsid) protein was purchased from GenScript (catalog # Z03488), and S2 subdomain of the SARS-CoV-2 S glycoprotein was purchased from Sino Biological (catalog # 40590-V08B).
Enzyme-linked immunosorbent assay (ELISA) was performed as described (Amanat et al., 2020) with several minor modifications. To obtain titers, antigens were immobilized on high-adsorbency 96-well plates at 5 ng/ml. Plates were blocked with 1% non-fat dehydrated milk extract (Santa Cruz Biotechnology #sc-2325) in sterile PBS (Fisher Scientific Hyclone PBS #SH2035,) for 1 h, washed with PBS containing 0.05% Tween-20, and overlaid with serial dilutions of the serum or plasma for 60 min. Plates were then washed and incubated for 1hr in 1% PBS and milk containing an anti-human IgG-HRP conjugated antibody (Jackson ImmunoResearch catalog 109-035-170) at a concentration of 1:2000 for 1 h. For IgM detection an anti-human IgM-HRP conjugated antibody (Jackson ImmunoResearch catalog 709-035-073) was used at a concentration of 1:5000 and incubated for 1 h. Plates were washed with PBS-Tween solution followed by PBS wash. To develop, plates were incubated in tetramethylbenzidine prior to quenching with 2N H2SO4. Plates were then read for 450nm absorbance. Area Under the Curve values were calculated in GraphPad Prism (v8) using a technical baseline = 0.05 based on OD readings from no sample controls.
ELISAs on community-wide samples were performed at the University of Arizona Genomics Core. A 384 well format was applied for high throughput screening, with protocol conditions remaining identical except for the substitution of anti-human Pan-Ig HRP conjugated antibody (Jackson ImmunoResearch catalog 109-035-064). Plates were read for 450nm absorbance on CLARIOstar Plus from BMG Labtech. Samples with OD630 values greater than 0.05 were re-run. Every plate contained at least 32 seronegative controls and either CR3022 or HM3128 (Creative Diagnostics) monoclonal antibodies as a positive control for RBD or S2, respectively. This assay has received Emergency Use Authorization from the US Food and Drug Administration (ID 201116).
Pseudovirus Production
293Tx cells were cultured in a 10cm2 dish to approximately 60% confluency and transfected using 30 μL GeneJuice (Sigma-Aldrich) with 5 μg mCherry containing plasmid, 3.25 μg psPax2 (Addgene 12260), and either 1.75 μg VSV.G (Addgene 12259) or SARS-CoV2 spike glycoprotein (BEI Resources, NR-52310). Medium was changed 6-8 h aftertransfection, and viral supernatant was then collected at both 48 and 72 h later. Samples were centrifuged to pellet cellular debris, and supernatants were collected and stored at −80°C until time of use.
Pseudovirus Neutralization Assay
Patient plasma was diluted to a ratio of 1:10 followed by 3-fold serial dilutions. Plasma was incubated with an equivalent volume of either control (VSV.G) or SARS-CoV2 pseudovirus for 1 h at 37°C. The plasma-pseudovirus mixture was then transferred to Veros and cultured for approximately 48 h at 37°C. Veros were washed, trypsinized, and prepared for flow cytometric analysis. Percent neutralization was calculated using the frequency of infected Veros in the presence of patient plasma relative to without plasma.
Plaque Reduction Neutralization Test
A plaque reduction neutralization test (PRNT) for SARS-CoV-2 was developed based on our prior work (Uhrlaub et al., 2011). Briefly, Vero cells (ATCC # CCL-81) were plated in 96 well tissue culture plates and grown overnight. Serial dilutions of plasma/serum samples were incubated with 100 plaque forming units of SARS-CoV-2 for 1 h at 37°C. Plasma/serum dilutions plus virus were transferred to the cell plates and incubated for 2 h at 37°C, 5% CO2 then overlayed with 1% methylcellulose. After 72, plates were fixed with 10% Neutral Buffered Formalin for 30 min and stained with 1% crystal violet. Plaques were imaged using an ImmunoSpot Versa (Cellular Technology Limited, Cleveland, OH) plate reader. The serum/plasma dilution that contained 10 or less plaques was designated as the NT90 titer.
Quantification and Statistical Analysis
Thresholds for SARS-CoV-2 Seropositivity
Statistical analyses were performed in GraphPad Prism (v8) and Microsoft excel (v16.40). The threshold for indeterminate seropositivity to RBD was calculated as 3 standard deviations above the average OD value of the pre-pandemic negative control group. RBD seropositivity was established with an indeterminant range from an OD value 3 standard deviations above the mean OD value of the negative control cohort (OD450 = 0.12) to an OD slightly above the highest OD value observed in the negative control cohort (OD450 = 0.39). Readings above OD450 = 0.39 were considered seropositive. The seropositive threshold to S2 was determined by calculating the OD value 5 standard deviations above the average OD (OD450 = 0.35) of the pre-pandemic negative control cohort.
Antibody and Neutralization Titers
Correlation r values between antibody titers and neutralizing titers were determined using a Pearson correlation. p values to compare non-linear regression fits of antibody and neutralization titers over time grouped by disease severity, patient age, and patient sex were calculated in GraphPad Prism. Null hypothesis was set for a single curve to fit all subject groups, which was rejected with less than 95% confidence. LOESS soothing splines were generated in GraphPad Prism. Pseudo-R2 values were calculated by using the squared correlation between the predicted outcomes and the actual outcomes from the fitted model (Efron, 1978).
Acknowledgments
The authors are indebted to the nurses in the intensive care units of Banner University Medical Center—Tucson and South Campuses and research coordinators (Cathleen Wilson and Trina Hughes) for facilitating the collection of samples in critically ill hospitalized patients with COVID-19. We thank F. Krammer, V. Simon, M. Rao, and J. Jhang at Mt. Sinai Hospital and A. Ellebedy and D. Fremont at Washington University in St. Louis for reagents and protocols. This work was supported in part by National Institutes of Health awards AG020719 and AG057701 and Centers for Disease Control and Prevention award 75D30120C08379 to J.N.-Ž., the contract CTR050053 from the State of Arizona to J.N.-Ž. and D.B., R01AI099108 and R01AI129945 to D.B., by the COVID-19 Rapid Response Grant from the UArizona BIO5 Institute to C.C.W., D.B., and J.N.-Ž., and the Bowman Endowment in Medical Sciences to J.N.-Ž. The graphical abstract for this study was created on biorender.com.
Author Contributions
T.J.R., J.L.U., M.W., R.W., R.S., J.N.Ž., and D.B. designed the study. T.J.R., J.L.U., M.W., R.W., H.A.P., C.B., M.E.K., and R.S. performed experiments. T.J.R., J.L.U., M.W., R.W., A.P.C., C.M.S., M.E.K., T.E., R.S., J.N.Ž., and D.B. analyzed the data. T.J.R., J.N.Ž., and D.B. wrote the paper. All other authors participated in collection of samples and patient care for the study.
Declaration of Interests
Unrelated intellectual property of D.B. and Washington University has been licensed by Sana Biotechnology. J.N.Ž. is on the scientific advisory board of and receives research funding from Young Blood, Inc. R.S. is a founder and chief scientific officer of Geneticure. R.W. is currently an employee of Vir Biotechnology. A provisional patent application related to this work has been filed with the US Patent Office.
Published: October 14, 2020
Footnotes
Supplemental Information can be found online at https://doi.org/10.1016/j.immuni.2020.10.004.
Supplemental Information
References
- Abbott R.K., Lee J.H., Menis S., Skog P., Rossi M., Ota T., Kulp D.W., Bhullar D., Kalyuzhniy O., Havenar-Daughton C. Precursor Frequency and Affinity Determine B Cell Competitive Fitness in Germinal Centers, Tested with Germline-Targeting HIV Vaccine Immunogens. Immunity. 2018;48:133–146.e6. doi: 10.1016/j.immuni.2017.11.023. [DOI] [PMC free article] [PubMed] [Google Scholar]
- Amanat F., Stadlbauer D., Strohmeier S., Nguyen T.H.O., Chromikova V., McMahon M., Jiang K., Arunkumar G.A., Jurczyszak D., Polanco J. A serological assay to detect SARS-CoV-2 seroconversion in humans. Nat. Med. 2020;26:1033–1036. doi: 10.1038/s41591-020-0913-5. [DOI] [PMC free article] [PubMed] [Google Scholar]
- Amanna I.J., Carlson N.E., Slifka M.K. Duration of humoral immunity to common viral and vaccine antigens. N. Engl. J. Med. 2007;357:1903–1915. doi: 10.1056/NEJMoa066092. [DOI] [PubMed] [Google Scholar]
- Atyeo C., Fischinger S., Zohar T., Slein M.D., Burke J., Loos C., McCulloch D.J., Newman K.L., Wolf C., Yu J. Distinct Early Serological Signatures Track with SARS-CoV-2 Survival. Immunity. 2020;53:524–532.e4. doi: 10.1016/j.immuni.2020.07.020. [DOI] [PMC free article] [PubMed] [Google Scholar]
- Baumgarth N., Nikolich-Zugich J., Lee F.E., Bhattacharya D. Antibody Responses to SARS-CoV-2: Let’s Stick to Known Knowns. Journal of Immunology. 2020 doi: 10.4049/jimmunol.2000839. In press. [DOI] [PMC free article] [PubMed] [Google Scholar]
- Bendavid E., Mulaney B., Sood N., Shah S., Ling E., Bromley-Dulfano R., Lai C., Weissberg Z., Saavedra-Walker R., Tedrow J. COVID-19 Antibody Seroprevalence in Santa Clara County, California. MedRxiv. 2020 doi: 10.1101/2020.04.14.20062463. [DOI] [PMC free article] [PubMed] [Google Scholar]
- Bennett S.T., Steyvers M. Estimating COVID-19 Antibody Seroprevalence in Santa Clara County, California. A re-analysis of Bendavid et al. MedRxiv. 2020 doi: 10.1093/ije/dyab010. 2020.04.24.20078824. [DOI] [PMC free article] [PubMed] [Google Scholar]
- Bhattacharya D., Cheah M.T., Franco C.B., Hosen N., Pin C.L., Sha W.C., Weissman I.L. Transcriptional profiling of antigen-dependent murine B cell differentiation and memory formation. J. Immunol. 2007;179:6808–6819. doi: 10.4049/jimmunol.179.10.6808. [DOI] [PMC free article] [PubMed] [Google Scholar]
- Bosch B.J., van der Zee R., de Haan C.A.M., Rottier P.J.M. The coronavirus spike protein is a class I virus fusion protein: structural and functional characterization of the fusion core complex. J. Virol. 2003;77:8801–8811. doi: 10.1128/JVI.77.16.8801-8811.2003. [DOI] [PMC free article] [PubMed] [Google Scholar]
- Bryan A., Pepper G., Wener M.H., Fink S.L., Morishima C., Chaudhary A., Jerome K.R., Mathias P.C., Greninger A.L. Performance Characteristics of the Abbott Architect SARS-CoV-2 IgG Assay and Seroprevalence in Boise, Idaho. J. Clin. Microbiol. 2020;58:e00941-20. doi: 10.1128/JCM.00941-20. [DOI] [PMC free article] [PubMed] [Google Scholar]
- Burbelo P.D., Riedo F.X., Morishima C., Rawlings S., Smith D., Das S., Strich J.R., Chertow D.S., Davey R.T., Cohen J.I. Detection of Nucleocapsid Antibody to SARS-CoV-2 is More Sensitive than Antibody to Spike Protein in COVID-19 Patients. MedRxiv. 2020 2020.04.20.20071423. [Google Scholar]
- Callow K.A., Parry H.F., Sergeant M., Tyrrell D.A. The time course of the immune response to experimental coronavirus infection of man. Epidemiol. Infect. 1990;105:435–446. doi: 10.1017/s0950268800048019. [DOI] [PMC free article] [PubMed] [Google Scholar]
- Cao W.-C., Liu W., Zhang P.-H., Zhang F., Richardus J.H. Disappearance of antibodies to SARS-associated coronavirus after recovery. N. Engl. J. Med. 2007;357:1162–1163. doi: 10.1056/NEJMc070348. [DOI] [PubMed] [Google Scholar]
- CDC. 2020. Information for Laboratories about Coronavirus (COVID-19)https://www.cdc.gov/coronavirus/2019-ncov/lab/resources/antibody-tests-guidelines.html [Google Scholar]
- Choe P.G., Kang C.K., Suh H.J., Jung J., Kang E., Lee S.Y., Song K.-H., Kim H.B., Kim N.J., Park W.B. Antibody Responses to SARS-CoV-2 at 8 Weeks Postinfection in Asymptomatic Patients. Emerg. Infect. Dis. 2020;26:2484–2487. doi: 10.3201/eid2610.202211. [DOI] [PMC free article] [PubMed] [Google Scholar]
- Duan J., Yan X., Guo X., Cao W., Han W., Qi C., Feng J., Yang D., Gao G., Jin G. A human SARS-CoV neutralizing antibody against epitope on S2 protein. Biochem. Biophys. Res. Commun. 2005;333:186–193. doi: 10.1016/j.bbrc.2005.05.089. [DOI] [PMC free article] [PubMed] [Google Scholar]
- Efron B. Regression and ANOVA with Zero-One Data: Measures of Residual Variation. J. Am. Stat. Assoc. 1978;73:113–121. [Google Scholar]
- Giroglou T., Cinatl J., Jr., Rabenau H., Drosten C., Schwalbe H., Doerr H.W., von Laer D. Retroviral vectors pseudotyped with severe acute respiratory syndrome coronavirus S protein. J. Virol. 2004;78:9007–9015. doi: 10.1128/JVI.78.17.9007-9015.2004. [DOI] [PMC free article] [PubMed] [Google Scholar]
- Gorse G.J., Patel G.B., Vitale J.N., O’Connor T.Z. Prevalence of antibodies to four human coronaviruses is lower in nasal secretions than in serum. Clin. Vaccine Immunol. 2010;17:1875–1880. doi: 10.1128/CVI.00278-10. [DOI] [PMC free article] [PubMed] [Google Scholar]
- Greaney A.J., Starr T.N., Gilchuk P., Zost S.J., Binshtein E., Loes A.N., Hilton S.K., Huddleston J., Eguia R., Crawford K.H.D. Complete mapping of mutations to the SARS-CoV-2 spike receptor-binding domain that escape antibody recognition. bioRxiv. 2020 doi: 10.1016/j.chom.2020.11.007. 2020.09.10.292078. [DOI] [PMC free article] [PubMed] [Google Scholar]
- Gudbjartsson D.F., Norddahl G.L., Melsted P., Gunnarsdottir K., Holm H., Eythorsson E., Arnthorsson A.O., Helgason D., Bjarnadottir K., Ingvarsson R.F. Humoral Immune Response to SARS-CoV-2 in Iceland. N. Engl. J. Med. 2020 doi: 10.1056/NEJMoa2026116. [DOI] [PMC free article] [PubMed] [Google Scholar]
- Guo X., Guo Z., Duan C., Chen Z., Wang G., Lu Y., Li M., Lu J. Long-Term Persistence of IgG Antibodies in SARS-CoV Infected Healthcare Workers. MedRxiv. 2020 2020.02.12.20021386. [Google Scholar]
- Hanson K.E., Caliendo A.M., Arias C.A., Englund J.A., Hayden M.K., Lee M.J., Loeb M., Patel R., Altayar O., El Alayli A. 2020. Infectious Diseases Society of America: COVID-19 Guideline, Part 4: Serology.https://www.idsociety.org/practice-guideline/covid-19-guideline-serology/ [Google Scholar]
- Hou H., Wang T., Zhang B., Luo Y., Mao L., Wang F., Wu S., Sun Z. Detection of IgM and IgG antibodies in patients with coronavirus disease 2019. Clin. Transl. Immunology. 2020;9:e01136. doi: 10.1002/cti2.1136. [DOI] [PMC free article] [PubMed] [Google Scholar]
- Ibarrondo F.J., Fulcher J.A., Goodman-Meza D., Elliott J., Hofmann C., Hausner M.A., Ferbas K.G., Tobin N.H., Aldrovandi G.M., Yang O.O. Rapid Decay of Anti-SARS-CoV-2 Antibodies in Persons with Mild Covid-19. N. Engl. J. Med. 2020;383:1085–1087. doi: 10.1056/NEJMc2025179. [DOI] [PMC free article] [PubMed] [Google Scholar]
- Isho B., Abe K.T., Zuo M., Jamal A.J., Rathod B., Wang J.H., Li Z., Chao G., Rojas O.L., Bang Y.M. Evidence for sustained mucosal and systemic antibody responses to SARS-CoV-2 antigens in COVID-19 patients. MedRxiv. 2020 doi: 10.1126/sciimmunol.abe5511. 2020.08.01.20166553. [DOI] [PMC free article] [PubMed] [Google Scholar]
- Iyer A.S., Jones F.K., Nodoushania A., Kelly M., Becker M., Slater D., Mills R., Teng E., Kamruzzaman M., Garcia-Beltran W.F. Dynamics and significance of the antibody response to SARS-CoV-2 infection. MedRxiv. 2020 2020.07.18.20155374. [Google Scholar]
- Jash A., Wang Y., Weisel F.J., Scharer C.D., Boss J.M., Shlomchik M.J., Bhattacharya D. ZBTB32 Restricts the Duration of Memory B Cell Recall Responses. J. Immunol. 2016;197:1159–1168. doi: 10.4049/jimmunol.1600882. [DOI] [PMC free article] [PubMed] [Google Scholar]
- Jash A., Zhou Y.W., Gerardo D.K., Ripperger T.J., Parikh B.A., Piersma S., Jamwal D.R., Kiela P.R., Boon A.C.M., Yokoyama W.M. ZBTB32 restrains antibody responses to murine cytomegalovirus infections, but not other repetitive challenges. Sci. Rep. 2019;9:15257. doi: 10.1038/s41598-019-51860-z. [DOI] [PMC free article] [PubMed] [Google Scholar]
- Johnson B.A., Xie X., Kalveram B., Lokugamage K.G., Muruato A., Zou J., Zhang X., Juelich T., Smith J.K., Zhang L. Furin Cleavage Site Is Key to SARS-CoV-2 Pathogenesis. bioRxiv. 2020 doi: 10.1038/s41586-021-03237-4. 2020.08.26.268854. [DOI] [PMC free article] [PubMed] [Google Scholar]
- Ko J.-H., Joo E.-J., Park S.-J., Baek J.Y., Kim W.D., Jee J., Kim C.J., Jeong C., Kim Y.-J., Shon H.J. Neutralizing Antibody Production in Asymptomatic and Mild COVID-19 Patients, in Comparison with Pneumonic COVID-19 Patients. J. Clin. Med. 2020;9:2268. doi: 10.3390/jcm9072268. [DOI] [PMC free article] [PubMed] [Google Scholar]
- Korean Centers for Disease Control. 2020. Findings from investigation and analysis of re-positive cases.http://www.cdc.go.kr [Google Scholar]
- Lavinder J.J., Wine Y., Giesecke C., Ippolito G.C., Horton A.P., Lungu O.I., Hoi K.H., DeKosky B.J., Murrin E.M., Wirth M.M. Identification and characterization of the constituent human serum antibodies elicited by vaccination. Proc. Natl. Acad. Sci. USA. 2014;111:2259–2264. doi: 10.1073/pnas.1317793111. [DOI] [PMC free article] [PubMed] [Google Scholar]
- Li F. Structure, Function, and Evolution of Coronavirus Spike Proteins. Annu. Rev. Virol. 2016;3:237–261. doi: 10.1146/annurev-virology-110615-042301. [DOI] [PMC free article] [PubMed] [Google Scholar]
- Liu K., Chen Y., Lin R., Han K. Clinical features of COVID-19 in elderly patients: A comparison with young and middle-aged patients. J. Infect. 2020;80:e14–e18. doi: 10.1016/j.jinf.2020.03.005. [DOI] [PMC free article] [PubMed] [Google Scholar]
- Long Q.-X., Tang X.-J., Shi Q.-L., Li Q., Deng H.-J., Yuan J., Hu J.-L., Xu W., Zhang Y., Lv F.-J. Clinical and immunological assessment of asymptomatic SARS-CoV-2 infections. Nat. Med. 2020;26:1200–1204. doi: 10.1038/s41591-020-0965-6. [DOI] [PubMed] [Google Scholar]
- Long Q.-X., Liu B.-Z., Deng H.-J., Wu G.-C., Deng K., Chen Y.-K., Liao P., Qiu J.-F., Lin Y., Cai X.-F. Antibody responses to SARS-CoV-2 in patients with COVID-19. Nat. Med. 2020;26:845–848. doi: 10.1038/s41591-020-0897-1. [DOI] [PubMed] [Google Scholar]
- Manz R.A., Thiel A., Radbruch A. Lifetime of plasma cells in the bone marrow. Nature. 1997;388:133–134. doi: 10.1038/40540. [DOI] [PubMed] [Google Scholar]
- Pollán M., Pérez-Gómez B., Pastor-Barriuso R., Oteo J., Hernán M.A., Pérez-Olmeda M., Sanmartín J.L., Fernández-García A., Cruz I., Fernández de Larrea N. Prevalence of SARS-CoV-2 in Spain (ENE-COVID): a nationwide, population-based seroepidemiological study. Lancet. 2020;396:535–544. doi: 10.1016/S0140-6736(20)31483-5. [DOI] [PMC free article] [PubMed] [Google Scholar]
- Premkumar L., Segovia-Chumbez B., Jadi R., Martinez D.R., Raut R., Markmann A.J., Cornaby C., Bartelt L., Weiss S., Park Y. The receptor-binding domain of the viral spike protein is an immunodominant and highly specific target of antibodies in SARS-CoV-2 patients. Sci. Immunol. 2020;5:eabc8413. doi: 10.1126/sciimmunol.abc8413. [DOI] [PMC free article] [PubMed] [Google Scholar]
- Purtha W.E., Tedder T.F., Johnson S., Bhattacharya D., Diamond M.S. Memory B cells, but not long-lived plasma cells, possess antigen specificities for viral escape mutants. J. Exp. Med. 2011;208:2599–2606. doi: 10.1084/jem.20110740. [DOI] [PMC free article] [PubMed] [Google Scholar]
- Qu J., Wu C., Li X., Zhang G., Jiang Z., Li X., Zhu Q., Liu L. Profile of IgG and IgM antibodies against severe acute respiratory syndrome coronavirus 2 (SARS-CoV-2) Clin. Infect. Dis. 2020:ciaa489. doi: 10.1093/cid/ciaa489. [DOI] [PMC free article] [PubMed] [Google Scholar]
- Reed S.E. The behaviour of recent isolates of human respiratory coronavirus in vitro and in volunteers: evidence of heterogeneity among 229E-related strains. J. Med. Virol. 1984;13:179–192. doi: 10.1002/jmv.1890130208. [DOI] [PMC free article] [PubMed] [Google Scholar]
- Rosenberg E.S., Tesoriero J.M., Rosenthal E.M., Chung R., Barranco M.A., Styer L.M., Parker M.M., John Leung S.-Y., Morne J.E., Greene D. Cumulative incidence and diagnosis of SARS-CoV-2 infection in New York. Ann. Epidemiol. 2020;48:23–29.e4. doi: 10.1016/j.annepidem.2020.06.004. [DOI] [PMC free article] [PubMed] [Google Scholar]
- Schmidt F., Weisblum Y., Muecksch F., Hoffmann H.-H., Michailidis E., Lorenzi J.C.C., Mendoza P., Rutkowska M., Bednarski E., Gaebler C. Measuring SARS-CoV-2 neutralizing antibody activity using pseudotyped and chimeric viruses. J. Exp. Med. 2020;217:e20201181. doi: 10.1084/jem.20201181. [DOI] [PMC free article] [PubMed] [Google Scholar]
- Sekine T., Perez-Potti A., Rivera-Ballesteros O., Strålin K., Gorin J.-B., Olsson A., Llewellyn-Lacey S., Kamal H., Bogdanovic G., Muschiol S. Robust T cell immunity in convalescent individuals with asymptomatic or mild COVID-19. bioRxiv. 2020 doi: 10.1016/j.cell.2020.08.017. 2020.06.29.174888. [DOI] [PMC free article] [PubMed] [Google Scholar]
- Seow J., Graham C., Merrick B., Acors S., Steel K.J.A., Hemmings O., O’Bryne A., Kouphou N., Pickering S., Galao R. Longitudinal evaluation and decline of antibody responses in SARS-CoV-2 infection. MedRxiv. 2020 doi: 10.1038/s41564-020-00813-8. 2020.07.09.20148429. [DOI] [PMC free article] [PubMed] [Google Scholar]
- Slifka M.K., Antia R., Whitmire J.K., Ahmed R. Humoral immunity due to long-lived plasma cells. Immunity. 1998;8:363–372. doi: 10.1016/s1074-7613(00)80541-5. [DOI] [PubMed] [Google Scholar]
- Smith K.G.C., Light A., Nossal G.J.V., Tarlinton D.M. The extent of affinity maturation differs between the memory and antibody-forming cell compartments in the primary immune response. EMBO J. 1997;16:2996–3006. doi: 10.1093/emboj/16.11.2996. [DOI] [PMC free article] [PubMed] [Google Scholar]
- Song G., He W., Callaghan S., Anzanello F., Huang D., Ricketts J., Torres J.L., Beutler N., Peng L., Vargas S. Cross-reactive serum and memory B cell responses to spike protein in SARS-CoV-2 and endemic coronavirus infection. bioRxiv. 2020 doi: 10.1038/s41467-021-23074-3. 2020.09.22.308965. [DOI] [PMC free article] [PubMed] [Google Scholar]
- Srinivasan S., Cui H., Gao Z., Liu M., Lu S., Mkandawire W., Narykov O., Sun M., Korkin D. Structural Genomics of SARS-CoV-2 Indicates Evolutionary Conserved Functional Regions of Viral Proteins. Viruses. 2020;12:360. doi: 10.3390/v12040360. [DOI] [PMC free article] [PubMed] [Google Scholar]
- Stadlbauer D., Tan J., Jiang K., Hernandez M., Fabre S., Amanat F., Teo C., Arunkumar G.A., McMahon M., Jhang J. Seroconversion of a city: Longitudinal monitoring of SARS-CoV-2 seroprevalence in New York City. MedRxiv. 2020 2020.06.28.20142190. [Google Scholar]
- Steensels D., Oris E., Coninx L., Nuyens D., Delforge M.-L., Vermeersch P., Heylen L. Hospital-Wide SARS-CoV-2 Antibody Screening in 3056 Staff in a Tertiary Center in Belgium. JAMA. 2020;324:195–197. doi: 10.1001/jama.2020.11160. [DOI] [PMC free article] [PubMed] [Google Scholar]
- Sterlin D., Mathian A., Miyara M., Mohr A., Anna F., Claer L., Quentric P., Fadlallah J., Ghillani P., Gunn C. IgA dominates the early neutralizing antibody response to SARS-CoV-2. MedRxiv. 2020 doi: 10.1126/scitranslmed.abd2223. 2020.06.10.20126532. [DOI] [PMC free article] [PubMed] [Google Scholar]
- Stringhini S., Wisniak A., Piumatti G., Azman A.S., Lauer S.A., Baysson H., De Ridder D., Petrovic D., Schrempft S., Marcus K. Seroprevalence of anti-SARS-CoV-2 IgG antibodies in Geneva, Switzerland (SEROCoV-POP): a population-based study. Lancet. 2020;396:313–319. doi: 10.1016/S0140-6736(20)31304-0. [DOI] [PMC free article] [PubMed] [Google Scholar]
- Sze D.M.-Y., Toellner K.-M., García de Vinuesa C., Taylor D.R., MacLennan I.C.M. Intrinsic constraint on plasmablast growth and extrinsic limits of plasma cell survival. J. Exp. Med. 2000;192:813–821. doi: 10.1084/jem.192.6.813. [DOI] [PMC free article] [PubMed] [Google Scholar]
- Tan C.W., Chia W.N., Qin X., Liu P., Chen M.I.-C., Tiu C., Hu Z., Chen V.C.-W., Young B.E., Sia W.R. A SARS-CoV-2 surrogate virus neutralization test based on antibody-mediated blockage of ACE2-spike protein-protein interaction. Nat. Biotechnol. 2020;38:1073–1078. doi: 10.1038/s41587-020-0631-z. [DOI] [PubMed] [Google Scholar]
- To K.K.-W., Hung I.F.-N., Ip J.D., Chu A.W.-H., Chan W.-M., Tam A.R., Fong C.H.-Y., Yuan S., Tsoi H.-W., Ng A.C.-K. COVID-19 re-infection by a phylogenetically distinct SARS-coronavirus-2 strain confirmed by whole genome sequencing. Clin. Infect. Dis. 2020:ciaa1275. doi: 10.1093/cid/ciaa1275. [DOI] [PMC free article] [PubMed] [Google Scholar]
- Uhrlaub J.L., Brien J.D., Widman D.G., Mason P.W., Nikolich-Žugich J. Repeated in vivo stimulation of T and B cell responses in old mice generates protective immunity against lethal West Nile virus encephalitis. J. Immunol. 2011;186:3882–3891. doi: 10.4049/jimmunol.1002799. [DOI] [PMC free article] [PubMed] [Google Scholar]
- Wajnberg A., Amanat F., Firpo A., Altman D., Bailey M., Mansour M., McMahon M., Meade P., Mendu D.R., Muellers K. SARS-CoV-2 infection induces robust, neutralizing antibody responses that are stable for at least three months. MedRxiv. 2020 2020.07.14.20151126. [Google Scholar]
- Wang N.S., McHeyzer-Williams L.J., Okitsu S.L., Burris T.P., Reiner S.L., McHeyzer-Williams M.G. Divergent transcriptional programming of class-specific B cell memory by T-bet and RORα. Nat. Immunol. 2012;13:604–611. doi: 10.1038/ni.2294. [DOI] [PMC free article] [PubMed] [Google Scholar]
- Weisblum Y., Schmidt F., Zhang F., DaSilva J., Poston D., Lorenzi J.C.C., Muecksch F., Rutkowska M., Hoffmann H.-H., Michailidis E. Escape from neutralizing antibodies by SARS-CoV-2 spike protein variants. bioRxiv. 2020 doi: 10.7554/eLife.61312. 2020.07.21.214759. [DOI] [PMC free article] [PubMed] [Google Scholar]
- Wong R., Belk J.A., Govero J., Uhrlaub J.L., Reinartz D., Zhao H., Errico J.M., D’Souza L., Ripperger T.J., Nikolich-Zugich J. Affinity-Restricted Memory B Cells Dominate Recall Responses to Heterologous Flaviviruses. Immunity. 2020 doi: 10.1016/j.immuni.2020.09.001. In this issue. [DOI] [PMC free article] [PubMed] [Google Scholar]
- Worobey M., Pekar J., Larsen B.B., Nelson M.I., Hill V., Joy J.B., Rambaut A., Suchard M.A., Wertheim J.O., Lemey P. The emergence of SARS-CoV-2 in Europe and North America. Science. 2020:eabc8169. doi: 10.1126/science.abc8169. [DOI] [PMC free article] [PubMed] [Google Scholar]
- Wrapp D., Wang N., Corbett K.S., Goldsmith J.A., Hsieh C.-L., Abiona O., Graham B.S., McLellan J.S. Cryo-EM structure of the 2019-nCoV spike in the prefusion conformation. Science. 2020;367:1260–1263. doi: 10.1126/science.abb2507. [DOI] [PMC free article] [PubMed] [Google Scholar]
- Yang C., Jiang M., Wang X., Tang X., Fang S., Li H., Zuo L., Jiang Y., Zhong Y., Chen Q. Viral RNA level, serum antibody responses, and transmission risk in discharged COVID-19 patients with recurrent positive SARS-CoV-2 RNA test results: a population-based observational cohort study. MedRxiv. 2020 doi: 10.1080/22221751.2020.1837018. 2020.07.21.20125138. [DOI] [PMC free article] [PubMed] [Google Scholar]
- Zinkernagel R.M., Hengartner H. Protective ‘immunity’ by pre-existent neutralizing antibody titers and preactivated T cells but not by so-called ‘immunological memory’. Immunol. Rev. 2006;211:310–319. doi: 10.1111/j.0105-2896.2006.00402.x. [DOI] [PubMed] [Google Scholar]
- Zuccarino-Catania G.V., Sadanand S., Weisel F.J., Tomayko M.M., Meng H., Kleinstein S.H., Good-Jacobson K.L., Shlomchik M.J. CD80 and PD-L2 define functionally distinct memory B cell subsets that are independent of antibody isotype. Nat. Immunol. 2014;15:631–637. doi: 10.1038/ni.2914. [DOI] [PMC free article] [PubMed] [Google Scholar]
Associated Data
This section collects any data citations, data availability statements, or supplementary materials included in this article.
Supplementary Materials
Data Availability Statement
The data generated in this study and corresponding analyses have been described in main and supplemental figures. Robotic code for 384 well serological automated screening is available upon request. Supplemental Data is available on Mendeley Data (https://doi.org/10.17632/rj4gxdd7sg.1).