FIG 7.
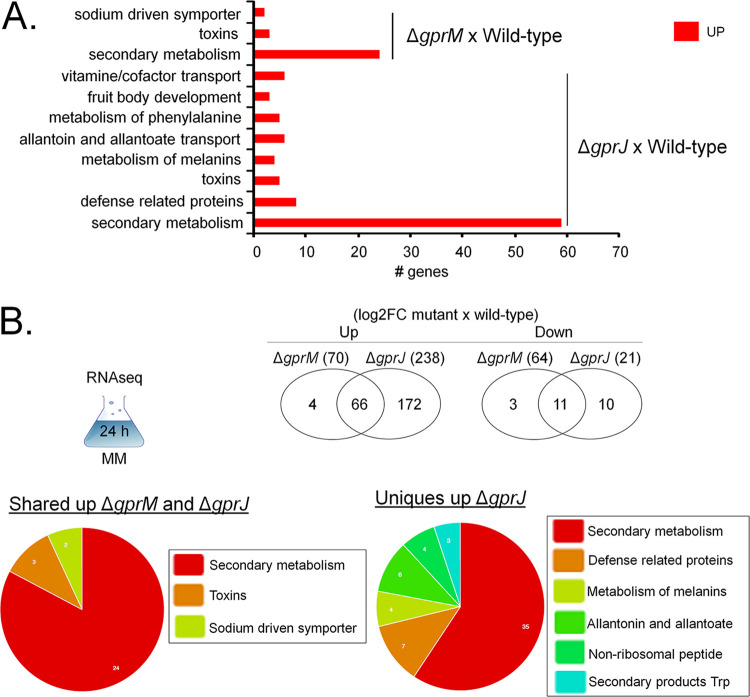
Functional characterization (FunCat) of significantly differently expressed genes (DEGs) identified by RNA-seq in the ΔgprM and ΔgprJ strains. (A) FunCat analysis of DEGs upregulated in the ΔgprM and ΔgprJ strains in comparison to the wild-type (WT) strain when grown for 24 h in glucose minimal medium (GMM). (B) Venn diagrams showing the number of up- or downregulated DEGs specific to each deletion strain and shared among the ΔgprM and ΔgprJ strains in comparison to the WT strain. In parentheses is the total number of DEGs identified for each strain (log2FC). A diagram depicting the growth condition used for RNA-seq is also shown. In addition, FunCat analyses for upregulated DEGs shared among the two deletion strains and for the ΔgprJ strain in comparison to the WT are shown as pie charts.

