Figure 3.
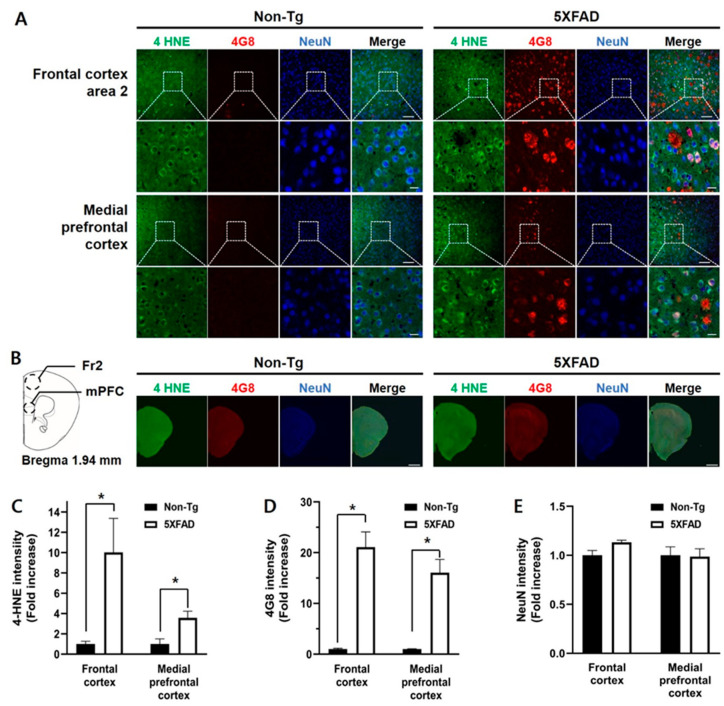
Triple immunofluorescence staining of the frontal cortex of the 4-month-old non-Tg control and 5XFAD mice. (A) Confocal microscopic images of triple immunofluorescence with 4-HNE, 4G8, and NeuN antibodies in the frontal cortex area 2 (Fr2) and medial prefrontal cortex (mPFC). (B) Schematic diagram of the analyzed brain regions and half-brain immunofluorescence images. The dashed circles in the diagram indicate the regions of interest. (C) 4-HNE levels in the Fr2 and mPFC in 5XFAD mice were significantly higher than those in control mice. (D) Aβ levels in the Fr2 and mPFC in 5XFAD mice were significantly higher than those in control mice. (E) There was no difference in the intensities of the NeuN-positive signal. Top row: scale bar indicates 100 μm; bottom row: scale bar indicates 20 μm. Non-Tg, n = 4; 5XFAD, n = 6. * p < 0.05.

